The Role of Macrophage Migration Inhibitory Factor (MIF) in the
Pathogenesis of murine Chronic Lymphocytic Leukemia (CLL)
Analysis based on the TCL1 mouse model
Inaugural-Dissertation zur
Erlangung des Doktorgrades
der Mathematisch–Naturwissenschaftlichen Fakultät der Universität zu Köln
vorgelegt von Nina Reinart
aus Trier
Köln
Dezember 2008
Berichterstatter/in: Prof. Dr. Jens Brüning Prof. Dr. Carien Niessen
PD Dr. Günter Fingerle-Rowson
Tag der letzten mündlichen Prüfung: ...05.02.2009...
Ever tried. Ever failed. No matter.
Try again. Fail again. Fail better.
(Samuel Beckett, 1983)
Table of Contents
_________________________________________________________________________
Table of Contents
1 Zusammenfassung ... 1
2 Abstract ... 3
3 Introduction ... 5
3.1 Macrophage Migration Inhibitory Factor (MIF) ... 5
3.1.1 Expression pattern of MIF ... 5
3.1.2 Organization of the MIF gene locus ... 7
3.1.3 Structure of the MIF protein ... 7
3.1.4 Extracellular and intracellular MIF... 9
3.1.5 MIF and tumorigenesis ... 10
3.1.6 MIF and p53 ... 11
3.2 Chronic Lymphocytic Leukemia (CLL) ... 11
3.2.1 Biology and Pathogenesis of CLL ... 12
3.2.2 Staging ... 13
3.2.3 Prognosis ... 14
3.2.4 Current therapy and treatment ... 15
3.3 T cell leukemia-1 (TCL1) ... 16
3.3.1 Expression pattern of TCL1 ... 16
3.3.2 Organization of the TCL1 gene locus ... 17
3.3.3 Structure of the TCL1 protein ... 18
3.3.4 Functional aspects of TCL1 ... 19
3.3.5 TCL1 in Chronic Lymphocytic Leukemia ... 19
3.3.6 The TCL1 mouse model ... 20
3.4 Aim of the Work ... 20
4 Results ... 22
4.1 Macrophage Migration Inhibitory Factor (MIF) is overexpressed in malignant B cells and human chronic lymphocytic leukemia (CLL) ... 22
4.2 Characterization of the Eµ-TCL1 model for murine CLL ... 23
4.3 Analysis of the role of Macrophage Migration Inhibitory Factor (MIF) in the development of murine CLL ... 26
4.4 Macrophage Migration Inhibitory Factor receptors are expressed in murine CLL ... 28
4.5 Analysis of the leukemia development ... 29
4.6 MIF increases leukemia load in murine CLL ... 37
4.7 Immunohistochemical analysis of the TCL1+/wt MIF+/+ and TCL1+/wt MIF-/- animals ... 38
4.8 MIF affects overall survival in murine CLL ... 41
4.9 MIF deficiency lowers the apoptotic threshold ... 44
4.10 Analysis of cellular proliferation ... 49
4.11 Analysis of Metaphase-Chromosomes... 50
Table of Contents
_________________________________________________________________________
4.12 Expression analysis of known tumor regulators in leukemic and pre-
leukemic mice ... 53
5 Discussion ... 55
5.1 MIF promotes the accumulation of CD68+ macrophages ... 56
5.2 MIF inhibits apoptosis in vivo and in vitro ... 57
5.3 MIF and in vitro and in vivo proliferation ... 58
5.4 Spectral karyotyping highlights the importance of trisomy 15 in TCL1- driven leukemogenesis ... 59
5.5 Outlook ... 60
6 Material ... 61
6.1 Instruments ... 61
6.2 Materials ... 61
6.3 Chemicals and Reagents ... 62
6.4 Antibodies ... 63
6.4.1 Antibodies for Western Blotting ... 63
6.4.2 Antibodies for FACS-Analysis ... 64
6.4.3 Antibodies for Immunohistochemistry ... 64
6.5 Mouse strains ... 64
6.6 Primers for Genotyping ... 65
6.7 Special Reagents and Kits ... 65
6.8 Abbreviations ... 65
6.9 Software ... 66
7 Methods ... 68
7.1 Breeding ... 68
7.2 Genotyping ... 68
7.2.1 DNA-Preparation ... 68
7.2.2 Polymerase-Chain-Reaction (PCR) ... 69
7.2.3 Agarose Gel Electrophoresis ... 70
7.3 Blood-Analysis ... 70
7.3.1 Bloodsampling ... 70
7.3.2 Differential Blood Count ... 71
7.3.3 Flow Cytometry ... 71
7.4 Extraction of organs ... 72
7.5 Eukaryotic cell culture ... 72
7.5.1 Culture conditions ... 72
7.5.2 Trypsinization ... 72
7.5.3 Counting ... 72
7.5.4 Freezing and thawing of Cells... 73
7.5.5 Primary splenocytes ... 73
7.6 Protein biochemistry ... 73
7.6.1 Preparation of cell lysates ... 73
7.6.2 Quantification of Proteins ... 74
7.6.3 SDS-Polyacrylamide gel electrophoresis (SDS-PAGE) ... 74
Table of Contents
_________________________________________________________________________
7.6.4 Protein Transfer ... 76
7.6.5 Immunoblotting and Development ... 77
7.7 Quantification of Apoptosis ... 78
7.7.1 Annexin V and 7-AAD staining ... 78
7.7.2 TUNEL assay ... 78
7.8 Quantification of Proliferating Cells ... 80
7.8.1 In vivo ... 80
7.8.2 In vitro ... 81
7.9 Chromosomal preparation ... 82
7.10 Immunohistochemistry ... 82
8 References ... 84
Zusammenfassung
_________________________________________________________________________
1 Zusammenfassung
Die Interaktion zwischen Tumorzelle und Mikromilieu spielt in der Leukämogenese der chronisch lymphatischen Leukämie (CLL) neben den genetischen Schäden eine bedeutende Rolle. Eine Stimulation durch extrazelluläre Faktoren ist wichtig für das Überleben der CLL-Zelle, denn ohne diese wird die CLL-Zelle außerhalb ihres Mikromilieus in den programmierten Zelltod getrieben.
Vorausgehende Untersuchungen zeigten, dass Macrophage Migration Inhibitory Factor (MIF), ein Chemokin mit proinflammatorischer Wirkung, in der CLL überexprimiert ist.
Da MIF regulatorische Einflüsse auf Zellwachstum, -differenzierung und Apoptose besitzt untersucht diese Arbeit die Hypothese, ob MIF eine Rolle bei der Pathogenese der CLL zukommt.
Wir benutzten zu diesem Zweck das Modell der Eµ-T-cell leukemia 1 (TCL1)-transgenen Maus (Bichi et al., 2002), bei der eine B-Zell-spezifische Überexpression von TCL1 zu einer Akkumulation und Organinfiltration von CD5+IgM+ reifen B-Zellen führt. Die transgenen Mäuse entwickeln eine CLL-ähnliche Erkrankung, die sich in einer Leukämie, einer Lymphadenopathie, einer Hepatosplenomegalie, Knochenmarksinfiltration sowie frühzeitigem Tod nach 8 bis 15 Monaten manifestiert. Der Einfluss von MIF wird durch Verpaarung der TCL1+/+ Maus mit der MIF-/- Maus (Fingerle-Rowson et al., 2003) in vivo getestet. TCL1+/wt MIF+/+ und TCL1+/wt MIF-/- Mäuse wurden in dieser Arbeit hinsichtlich Geschwindigkeit der Leukämieentstehung, Tumorlast, hämatopathologischen Veränderungen sowie Proliferations- und Apoptoseverhalten miteinander verglichen.
Die bekannten MIF-Oberflächenrezeptoren CD74/CD44 und CXCR2 sind auch auf den murinen B-Zellen exprimiert. Die TCL1+/wt MIF+/+ Mäuse zeigen schon in der prä- leukämischen Phase eine erhöhte Anzahl an CD5+IgM+ Zellen und TCL1+/wt MIF+/+ Mäuse entwickeln auch ca. 3 Monate vor den TCL1+/wt MIF-/- Mäusen eine periphere Leukämie (p
= 0.02). Im Alter von 12 Monaten sind Leber und Milz durch Infiltration der Organe durch reife, kleinzellige maligne B-Lymphozyten in TCL1+/wt MIF+/+ Mäusen deutlich stärker betroffen als die Organe der MIF-defizienten Tiere. Ursächlich hierfür könnte eine vermehrte Akkumulation von CD68+ Makrophagen in den leukämisch infiltrierten Milzen der TCL1+/wt MIF+/+ Mäuse sein (p < 0.0001), die als sogenannte „nurse-like cells“ (NLCs) die Leukämiezellen vor der Apoptose schützen.
Dazu passt, das die Rate an spontaner Apoptose in MIF-defizienten leukämisch infiltrierten Milzen in vivo erhöht ist und ein Trend zu vermehrter Apoptose ex vivo bei den TCL1+/wt
Zusammenfassung
_________________________________________________________________________
MIF-/- Splenozyten zu beobachten ist. Diese MIF-bedingten Unterschiede wirken sich sogar auf das Gesamtüberleben aus, denn in den MIF-/- Mäusen beobachten wir eine Verlängerung des medianen Überlebens von 80 Tagen (TCL1+/wt MIF+/+ 380 Tage vs.
TCL1+/wt MIF-/- 460 Tage, p = 0.04). Eine Analyse der erworbenen Genomschäden mittels Spektralem Karyotyping (SKY) von Metaphasen leukämischer Splenozyten zeigt verschiedene genetische Aberrationen mit Trisomie, Tetraploidie, Translokationen und Deletionen in beiden Genotypen. Eine Überexpression des Tumorsuppressors p53 durch eine vermutlich inaktivierende Genmutation wurde häufiger in den TCL1+/wt MIF+/+ als in den TCL1+/wt MIF-/- Mäusen gefunden.
Unsere Untersuchungen am Eµ-TCL1 Mausmodell zeigen, dass es sich hier um ein geeignetes Modell für die Validierung von potentiellen Targetmolekülen bei der Pathogenese der CLL handelt. Wie zeigen, dass MIF sowohl in der frühen als auch in der späten Phase der CLL-Entstehung als Tumor-Promoter agiert und im Wesentlichen über Einflüsse des Mikromilieus auf die Leukämie seine Wirkung ausübt. Weitere Untersuchungen schliessen sich noch an, die die Rolle von MIF für die Funktion von nurse-like cells bei der CLL und anderen Tumorentitäten sowie den Einfluss von MIF auf den Akt-Pathway zum Fokus haben.
Abstract
_________________________________________________________________________
2 Abstract
Besides the genetic aberrations the interaction between the tumor cell and its microenvironment plays an important role in the leukemogenesis of chronic lymphocytic leukemia (CLL). Stimulation via extracellular factors is important for the survival of the CLL cell, since without this the CLL cell is driven into apoptosis when taken out of its micromilieu.
Preliminary analyses showed that Macrophage Migration Inhibitory Factor (MIF), a chemokine with pro-inflammatory properties, is overexpressed in CLL. As MIF exerts regulatory control on cellular growth, -differentiation and apoptosis, this work tests the hypothesis whether MIF has a contribution in the pathomechanism of CLL development.
To this end, we used the Eµ-T-cell leukemia 1 (TCL1) mouse model (Bichi et al., 2002) in which B-cell specific overexpression of TCL1 leads to accumulation and organ infiltration by CD5+IgM+ mature B cells. The transgenic mice develop a CLL-like disease, which is manifested by leukemia, lymphadenopathy, hepatosplenomegaly, bone marrow infiltration as well as premature death after 8 to 15 months. The impact of MIF is tested in vivo by breeding the TCL1+/+ mouse to the MIF-/- mouse (Fingerle-Rowson et al., 2003).
In this work, TCL1+/wt MIF+/+ and TCL1+/wt MIF-/- mice were compared with each other regarding the rate of leukemia development, tumor burden, hematopathological alterations, overall survival, cytogenetic changes as well as proliferative capacity and apoptosis.
The known MIF cell surface receptors CD74/CD44 and CXCR2 are also expressed on the murine B cells. TCL1+/wt MIF+/+ mice show already in the pre-leukemic phase a higher number of CD5+IgM+ cells, and the development of a peripheral leukemia starts about three months earlier in TCL1+/wt MIF+/+ mice compared to TCL1+/wt MF-/- animals (p = 0.02). At the age of 12 months, organs like liver and spleen are infiltrated to a higher degree by small, mature and malignant B lymphocytes in the TCL1+/wt MIF+/+ than in the MIF-deficient mice. One reason for this could be the increased accumulation of CD68+ macrophages in the leukemia infiltrated spleens and bone marrow of the MIF wildtype mice (p < 0.0001). “nurse-like” cells (NLCs) act to protect the leukemic cells from apoptosis.
This fits the observation that the rate of spontaneous apoptosis is elevated in the MIF- deficient leukemia infiltrated spleens in vivo, and that a trend towards higher rates of apoptosis can be seen in splenocytes of the TCL1+/wt MIF-/- mice ex vivo. These MIF- dependent effects even affect overall survival since in the MIF-/- mice, the overall median
Abstract
_________________________________________________________________________
survival is prolonged by 80 days (TCL1+/wt MIF+/+ 380 days vs. TCL1+/wt MIF-/- 460 days, p = 0.04). An analysis of genomic aberrations by spectral karyotyping (SKY) of metaphases from leukemic splenocytes shows distinct genetic damages like trisomy, tetraploidy, translocations and deletions in both genotypes. An overexpression of the tumor suppressor p53 presumably due to an inactivating gene mutation was found in TCL1+/wt MIF+/+ mice at a higher frequency than in TCL1+/wt MIF-/- mice.
Our analysis of the Eµ-TCL1 mouse model shows that this is a valuable model for the validation of potential target molecules in the pathogenesis of CLL. We are able to demonstrate that MIF acts as a tumor promoter primarily by influencing the micromilieu in the early as well as in the late phase of leukemkia development. Further analyses are on the way which focus on the role of MIF in the function of the nurse-like cells in CLL and other tumor entities and which test the interaction of MIF and Akt.
Introduction
_________________________________________________________________________
3 Introduction
3.1 Macrophage Migration Inhibitory Factor (MIF)
Macrophage migration inhibitory factor (MIF) was first described by the scientists Barry Bloom and John David in 1966 when they both independently from each other isolated a protein from cultures of antigen-sensitized lymphocytes that could act at a distance to inhibit the random movement or migration of phagocytes (Bloom and Bennett 1966; David 1966). It was one of the first soluble, non-immunoglobulin cytokines which could be analysed in vitro. This molecule was named macrophage migration inhibitory factor (MIF) and its activity was reported over the next 20 years to alter phagocytosis, macrophage adherence, spreading and to increase phagocyte tumoricidal potential (Nathan et al., 1971; Nathan et al., 1973; Churchill et al., 1975).
In 1989, human MIF was cloned and a molecular analysis of the biological, biochemical and biophysical properties was approached (Weiser et al., 1989).
3.1.1 Expression pattern of MIF
MIF protein and MIF mRNA have been detected in a wide variety of tissues and cell types. Since there is no cell line or tissue known to be negative for MIF, one can assume that MIF is an ubiquitously expressed protein. It seems to be expressed at baseline levels in nearly all tissues; however, it can also be induced by a variety of stimuli depending on the cellular context.
Expression of MIF can already be detected at the beginning of life. Kobayashi et al.
studied the expression of mRNA during embryogenenis of mice and showed co-expression of MIF in organogenesis parallel to tissue specification. MIF mRNA was detected in somites, precartilage primordia in ribs and vertebrae, branchial arches, limb buds, neural tissues, all muscle cell types and during organogenesis of liver, kidney, testis, skin, intestine, adrenal gland and pancreas (Suzuki et al., 1996; Kobayashi et al., 1999). This broad expression pattern of MIF in embryogenesis continues during adult life. MIF protein can be detected constitutively in serum and plasma. This soluble MIF could arise from a great variety of tissues in which MIF is synthesised. Historically, MIF was considered to be a product of activated T-lymphocytes (David 1966), but immunohistochemical analysis of various tissues indicates a broad expression pattern of MIF (Bacher et al., 1997). MIF is
Introduction
_________________________________________________________________________
1994), T- and B-lymphocytes (Bacher et al., 1996; Takahashi et al., 1999), NK-cells (Apte et al., 1998), basophiles/mast cells (Chen et al., 1998) and eosinophils (Rossi et al., 1998).
Endocrine organs such as the anterior pituitary gland (Bernhagen et al., 1993), the adrenal cortex, the Leydig-cells of the testis, the epithelial cells of the epididymis and pancreatic β- cells (Waeber et al., 1997) have been reported to be a source of MIF production (Bacher et al., 1997). Other MIF synthesizing cells are smooth and skeletal muscle cells (Benigni et al., 2000), gastric parietal cells (Kudo 1998), keratinocytes and fibroblasts (Abe et al., 2000), hepatocytes and peripheral and central neurons (Bacher et al., 1998). Even erythrocytes have been reported to contain MIF (Mizue et al., 2000), although these data could be confounded by leukocyte contamination or membrane-bound MIF.
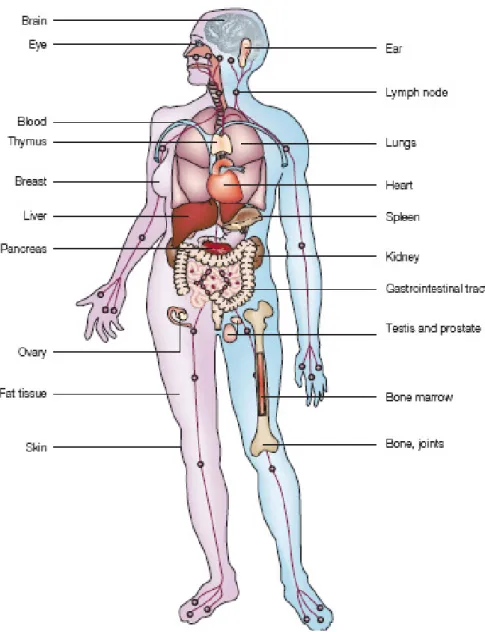
Figure 1: Expression pattern of MIF in humans. MIF is expressed in brain, eye, ear, in the immune system (blood, lymphnode, thymus, spleen, bone marrow), in endothelial cells and epithelial cells, in the skin and in bone and joints (modified from(Calandra and Roger 2003).
Introduction
_________________________________________________________________________
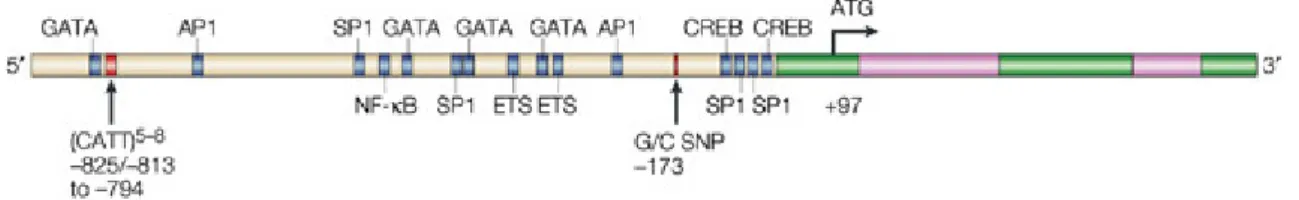
3.1.2 Organization of the MIF gene locus
The gene for murine MIF is located on chromosome 10 (Bozza et al., 1995; Mitchell et al., 1995) and the human gene maps to chromosome 22q11.2 (Budarf et al., 1997). Both genes are very small (approximately 1.7 kb in size) and show a similar intron-exon organization. The gene consists of three exons of 107, 162 and 66 basepairs and two introns of 188 and 94 basepairs. The sequence-identity within MIF RNA transcripts between mouse and human is very high (70.4%, 86.4% and 67.5% for exons 1, 2, and 3).
Consensus sequences which indicate the presence of transcription factor binding sites, have been found in the murine as well as in the human MIF promoter (Mitchell et al., 1995).
The promoter region contains enhancer and regulatory binding domains which are implicated to respond to the proto-oncogene c-fos (Paralkar and Wistow 1994; Maleszka et al., 1998). Other domains are a SP-1 sequence, a cAMP responsive element (CREB) and an AP-1 sequence. Further upstream there are a cytokine-1 (CK-1) site and a nuclear factor-κB site (NF-κB) (Fig. 2).
Two polymorphisms of the MIF gene have been found and are associated with inflammatory diseases: a G to C transition at position -173 is associated to systemic-onset juvenile arthritis (Donn et al., 2004) and a CATT-tetranucleotide repeat of five to eight times at position -794 is linked to rheumatoid arthritis (Baugh et al., 2002; Martinez et al., 2007) (Fig. 2).
Figure 2: Structure of the MIF gene. It is composed of three short exons (green) and two introns (pink).
3.1.3 Structure of the MIF protein
Human and mouse MIF cDNA were cloned from the Jurkat T cell line (Metz and Bucala 1997), the brain (Paralkar and Wistow 1994), the AtT-20 pituitary cell line (Bernhagen et al., 1994) and the recombinant proteins were expressed. In both species the primary protein has a length of 115 amino acids and a molecular mass of 12.5 kDa. The initiating
Introduction
_________________________________________________________________________
methionine is post-translationally removed and the mature protein starts with a proline in position 1.
Determination of the three-dimensional structure of mouse and human MIF was done by X-ray crystallography (Kato et al., 1996; Sugimoto et al., 1996; Sun et al., 1996) and by NMR (nuclear magnet resonance) -spectroscopy (Muhlhahn et al., 1996) and led to the discovery of the protein fold. All X-ray studies showed that MIF is a trimer of identical subunits with the overall dimensions of 35 x 50 x 50 Å. The MIF monomer contains two antiparallel α-helices and six β-strands, four of which form a mixed β-sheet. Three monomers assemble to an α/β structure consisting of six α-helices surrounding three β- sheets that form a barrel with a solvent accessible channel. This orientation is unusual for an eukaryotic protein. Stabilization of the trimer is guaranteed by several hydrogen bonds between the β-sheets and between one of the α-helices and the carboxyl-terminus (C-terminus). One leucine-rich hydrophobic region is also stabilized by hydrophobic bonds.
Figure 3: The active form of MIF as a homotrimer.
Looking at the three-dimensional architecture of MIF and other enzymes, a similarity between bacterial tautomerases and human D-dopachrome tautomerase (DDT) can be found. In the genome of mice and men, the gene for DDT lies only at 80 kb distance from MIF and we know that the MIF/DDT locus had evolved as a duplication event during evolution. DDT shares amino acid sequence homology with MIF to about 30%, whereas the crystal structure, its overall topology and trimeric formation is almost identical to MIF (Sugimoto et al., 1999). The protein GIF (glycosylation inhibition factor) which was investigated in the 1990s by Japanese scientists was found to be identical to MIF since its
Introduction
_________________________________________________________________________
sequence and structure are identical to MIF (Galat et al., 1994; Nishibori et al., 1996;
Watarai et al., 2000).
3.1.4 Extracellular and intracellular MIF
Until today two different ways of signaling have been described for MIF; an extracellular and an intracellular signaling pathway.
The first receptor found to bind extracellular MIF was CD74 (Leng et al. 2003). CD74 is a nonpolymorphic type II integral membrane protein, which was initially considered to function as an MHC class II chaperone only (Stumptner-Cuvelette and Benaroch 2002).
With the discovery of MIF as a ligand for CD74, its additional role as an accessory signaling molecule started to become clearer. In macrophages, MIF binds with a high affinity to the extracellular domain of CD74, activating the mitogen activated protein kinase (MAPK) pathway and cell proliferation (Leng et al. 2003). CD74 involves other receptors for signal transduction and another trans-membrane co-receptor, the adhesion molecule CD44, appears to be required for the phosphorylation of the ERK1/2 kinases by MIF (Shi et al., 2006). The activation of both receptors is also required for MIF-mediated protection of the cell from apoptosis. In B lymphocytes, MIF initiates a signaling cascade activating NF-κB via the Src kinase Syk and Akt. This activation is mediated by translocation of the CD74-intracellular domain which gets released by intramembrane regulated proteolysis (RIP) upon MIF stimulation (Gore et al., 2008)
MIF was also identified to be a non-cognate ligand for the chemokine receptors CXCR2 and CXCR4 (Bernhagen et al., 2007). By interaction with those two receptors, MIF is able to promote the recruitment of monocytes as well as T cells into inflamed tissue. It is also known that CXCR2 co-localizes with CD74 which suggest that MIF may signal via a combined CD74/CD44/CXCR2 complex.
MIF is also abundantly expressed in the cytosol and intracellular MIF involves another pathway by direct binding and inhibitory interaction with Jab-1/CSN5 (Jab = c-jun activating binding protein). One known function of Jab-1/CSN5 is the coactivation of AP-1 transcription (Bernhagen et al., 1993; Rosengren et al., 1996; Bernhagen et al., 1998;
Kleemann et al., 1998). Jab-1/CSN5 is also the subunit 5 of the COP9 signalosome (CSN) which is located in the nucleus and the cytoplasm (Kleemann et al., 2000; Bech-Otschir et al., 2001; Chamovitz and Segal 2001). The CSN consists of eight subunits which are
Introduction
_________________________________________________________________________
1999), which is the major proteolytic system of the cell (Hershko and Ciechanover 1998).
Jab-1 specifically binds to p27Kip1, a cyclin-dependent kinase inhibitor (CDKI), and promotes its degradation via the proteasome (Tomoda et al., 1999). Inhibition of Jab-1 by MIF antagonizes Jab-1-dependent regulation of p27Kip1 and stabilizes this CDKI (Kleemann et al. 2000). Other known targets of Jab-1/CSN5 are the tumor suppressor p53 or hypoxia-inducing factor-1α (HIF-1α) (Bech-Otschir et al., 2001; Bae et al., 2002).
3.1.5 MIF and tumorigenesis
In many different tumor entities, MIF is described to be correlated with the cancer prognosis. Specifically, this correlation was done for hepatocellular carcinomas, colon cancers and prostate cancers (Meyer-Siegler et al., 2002; Legendre et al., 2003; Hira et al., 2005). Interestingly, MIF seems to affect the two ways of the adaptive immune system, namely the Th1 and the Th2 routes. The first route activates macrophages and neutrophils by secretion of IL-2, IL-12m IFNγ and TNFα. The Th2 route, which acts as a counterpart to Th1 activates cytokines including IL-4, IL-5, IL-13 and IL-10. MIF affects these pathways in differently, on the one hand by sustaining the macrophage viability and thereby leading to a sustained inflammatory reaction (Mitchell et al., 2002) and on the other hand MIF activates the ERK-MAPK pathway and increases thereby cell proliferation (Mitchell et al., 2002). MIF is also capable of inducing angiogenesis. In a recent study it was shown that MIF enhances the differentiation of endothelial cells to blood vessels (Chesney et al., 1999; Amin et al., 2003), and there is evidence that MIF is able to modulate VEGF functioning.
Another mechanism for MIF acting as a tumor promoter could be the inhibition of p53- dependent apoptosis. The interaction of MIF with p53 was first shown by Hudson et al. in 1999 (Hudson et al., 1999). They demonstrated the abolishment of p53 activity by treating the cells with MIF: Investigations on the MIF knockout mouse model (Fingerle-Rowson et al., 2003) showed p53-dependent growth alterations in fibroblasts.
Evidence of MIF being involved in cell cycle regulation showed an involvement via the SCF complex. MIF co-regulates the activity of the skip-cullin-F-box protein complex (SCF complex) by inhibition of Jab-1 and might affect proteasomal control of intracellular protein degradation (Fingerle-Rowson and Petrenko 2007; Nemajerova et al., 2007).
Introduction
_________________________________________________________________________
3.1.6 MIF and p53
Regulation of cell proliferation is necessary for normal cell development and prevention of malignant transformation. DNA damage, due to oxidative stress, ionizing or ultraviolet irradiation or mutagenic substances enhances the rate of tumor development (Rich et al., 2000). To ensure efficient DNA repair in the cell before mitosis, the cell has developed p53-dependent and p53-independent checkpoint pathways which delay cell cycle progression if the genome is not intact. The p53 tumor-suppressor has at least two roles in preventing proliferation of the cell: induction of cell cycle arrest and induction of apoptosis (Attardi et al., 1996).
In earlier studies, MIF has been implicated to play a role in the regulation of cell growth and apoptosis (Wistow et al., 1993; Kobayashi et al., 1999). The expression levels of MIF alter during growth arrest (Fingerle-Rowson et al., 2003) and can be correlated with tumor grading and clinical prognosis in several human cancers (Meyer-Siegler and Hudson 1996;
del Vecchio et al., 2000; Meyer-Siegler 2000; Markert et al., 2001; Tomiyasu et al., 2002).
In 1999, MIF was found as a functional inhibitor of p53-dependent transcription in several cell-based genetic screens (Hudson et al., 1999). This proposed interaction was subsequently confirmed by in vivo studies with MIF knockout mice which showed that genetic deletion of MIF enhances p53-dependent activation of the p53 target p21CIP and inhibited malignant transformation in vitro as well as tumor formation in vivo (Fingerle- Rowson et al., 2003).
The proinflammatory action of MIF together with its inhibitory role in the p53 pathway has led to the concept that MIF may act as a molecular link between inflammation and tumorigenesis. MIF at sites of chronic inflammation may impair the normal response to genetic damage, enhances cell proliferation and promotes the accumulation of oncogenic mutations (Cordon-Cardo and Prives 1999).
3.2 Chronic Lymphocytic Leukemia (CLL)
Chronic lymphocytic leukemia (CLL) is a malignant disease of B cells which is characterized by the accumulation of CD5+ B lymphocytes in the peripheral blood, bone marrow and secondary lymphoid organs (Harris et al., 1994; Rozman and Montserrat 1995;
Chiorazzi et al., 2005; Chiorazzi et al., 2005)
CLL is the most frequent leukemia in the western world, representing about 25 to 30 % of
Introduction
_________________________________________________________________________
(Rozman and Montserrat 1995). The occurrence of CLL is not due to any known environmental factors such as ionizing radiation or chemical compounds. Most cases appear sporadically and only 5 % of CLL are known to be familial (Houlston et al., 2003).
3.2.1 Biology and Pathogenesis of CLL
The morphological analysis of CLL blood smears shows an accumulation of small mature lymphocytes. The membrane of these lymphocytes is more fragile than normally and this leads to the typical picture of smudge cells in peripheral blood smears (Matutes and Polliack 2000).
Immunophenotype analysis is necessary to establish the diagnosis of CLL. Its phenotype is very distinctive with leukemic B cells expressing mature B cell markers as CD19, low levels of CD20 and high levels of CD5 together with the expression of CD23 which helps to distinguish it from other CD5+ malignancies. CLL lymphocytes typically express low levels of surface immunoglobulin, most frequently IgM (Matutes et al., 1994; Moreau et al., 1997).
Most of the CLL cells are arrested in the G0 phase of the cell cycle (O'Brien et al., 1995;
Korsmeyer 1999). Only little is known about the control mechanism, but a recent work on lymphocytes suggests that the G0 state represents an active program that requires signals from the outside of the cells (Takeda et al., 1996; Lam et al., 1997; Rooke et al., 1997) phenomenon of the resting B cells needs further investigations for the analysis of the CLL pathogenesis.
CLL cells carry different genomic aberrations which are seen by conventional cytogenetics and fluorescence in situ-hybridization (FISH). Abnormalities can be found in up to 82 % of patients with CLL. In 18 %, no genetic abnormalities are found, but still these cases may carry submicroscopic aberrations (Dohner et al., 2000).The most frequent chromosomal abnormalities are listed in the table 1.
Chromosome Aberration Frequency Genes affected Prognosis
13 del 13q14 55% miR15, miR16 good
11 del 11q22-23 18% ATM, poor
17 del 17p13 7% p53 poor
12 +12 16% CDK2, CDK4, poor
MDM-2
6 del 6q 5 % unknown poor
14 t(14;19)(q32;q13) 10 % unknown
Table 1: Prognostic values of the different chromosomal aberrations.
Introduction
_________________________________________________________________________
Some of those abnormalities can occur alone or in combination, e.g. structural changes on chromosomes 11, 13 and 14 may occur together with deletions and translocations on chromosome 13q14 (Juliusson and Gahrton 1990; Juliusson et al., 1990; Dohner et al., 1999). Using conventional cytogenetic analysis, studies identified trisomy 12, 11q-deletion (11q-) and 17p-deletion (17p-) as markers of poor prognosis, whereas other patients with normal karyotype or 13q-deletion (13q-) had a better survival (Crossen 1997; Garcia- Marco et al., 1997; Dohner et al., 1999).
CLL cells express the B cell receptor (BCR) on the cell surface, as mature B lymphocytes do. The BCR is encoded by the immunoglobulin (Ig) genes which undergo somatic hypermutation during B cell differentiation in the germinal follicle in order to increase BCR affinity for the antigens. Sequencing of the variable genes of the heavy chain locus (IgVH) allows therefore telling whether a B cell has undergone somatic hypermutation. The mutated form of the B-CLL carries in those cases a good prognostic value for the disease while the unmutated form is associated with progressive disease (Damle et al., 1999;
Hamblin et al., 1999).
3.2.2 Staging
Two staging systems are currently used to define disease stage, prognosis and especially whether and when to start treatment, the Rai staging and the Binet staging system. In Europe, the Binet staging system is used which is based on the number of lymphoid sites involved and hematopoietic parameters (hemoglobin (Hgb) and platelet (Plts)) (Binet et al., 1981):
(1) Stage A: includes patients with Hgb > 10 g/dL, Plts > 100.000 mm-3 and up to two lymphatic sites involved
(2) Stage B: includes patients with Hgb > 10 g/dL, Plts > 100.000 mm-3 and more than two lymphatic sites involved
(3) Stage C: includes patients with compromised bone marrow function
(Hgb < 10 g/dL and/or Plts < 100.000 mm-3) regardless the number of lymphatic sites involved.
Introduction
_________________________________________________________________________
3.2.3 Prognosis
From a clinicians perspective, CLL is known to be a very heterogenous disease. The survival of the patients after the first diagnosis ranges from months to decades, with a median of 7.5 years (Dighiero and Binet 2000). Therefore, when the diagnosis is CLL, it is important to determine the patient’s individual risk for progression.
There are three traditional prognostic factors which are easily determined: The clinical stage according to Binet or Rai in which low stage patients have a better prognosis (Cheson et al., 1996). The lymphocyte doubling time indicates disease progression if it is
< 6 months (Montillo et al., 2005). The third parameter is bone marrow infiltration which indicates a poorer prognosis with diffuse infiltration than with nodular infiltration (Molica et al., 1990; Mauro et al., 1994; Montserrat et al., 1996).
On the other hand there are biological prognostic factors which are indicators for the extension of the malignant clone (Melo et al., 1986; Melo et al., 1986; Melo et al., 1986). If the percentage of prolymphocytes in the peripheral blood exceeds 10 %, it implies a worse prognosis for the patient. On the other hand, serum thymidine kinase (TK) levels, a cellular enzyme involved in a salvage pathway for DNA synthesis, correlates with survival (Hallek et al., 1999; Dickinson et al., 2006). Another serum marker is the β2-microtubulin (β2M)- level which inversely correlates with the response to chemotherapy and overall survival (Keating 1999). Soluble CD23 (sCD23) is a powerful predictor of disease activity and progression (Reinisch et al., 1994; Sarfati et al., 1996; Molica et al., 1999; Saka et al., 2006). sCD23 level can be used as predictor for clinical outcome, particularly in early stages (Molica et al., 1996; Schwarzmeier et al., 2002). p53, a transcription factor, known to act as tumor suppressor and regulator of the cell cycle, is another prognostic marker of CLL. Its inactivation (17p-) correlates with the transformation of CLL to an aggressive lymphoma, the so-called Richter’s transformation (Gaidano et al., 1991).
At the end of the last millennium, new biological markers have been identified, that allow a more precise risk-stratification of CLL patients already at the moment of the initial diagnosis.
IgVH mutation is one of those new prognostic markers. Unmutated CLL cases (meaning
≥ 98 % similarity to the corresponding germline sequence) are associated with an aggressive disease and a shorter median survival time (~ 8 years vs. 24 years) as compared to mutated cases (Damle et al., 1999; Hamblin et al., 1999). CD38 expression on CLL cells was first considered to be a surrogate marker for the mutational status, but studies
Introduction
_________________________________________________________________________
confirmed CD38 to have an independent prognostic value (Damle et al., 1999). ZAP-70 was initially considered to be expressed by T and natural killer (NK) cells, but it was also found to correlate with the clinical prognosis. An expansion of the ZAP70-positive cells to more than 20 % of the leukemic cells carries a negative prognosis (Crespo et al., 2003;
Wiestner et al., 2003).
Chromosomal abnormalities are the most important prognostic parameters (Dohner et al., 1999). Single chromosomal aberrations are quite characteristic for CLL, but they also occur in combination expecially during the clonal evolution of the disease (see also table 1). The most frequent aberration is the deletion 13q- which implies the best prognosis for the CLL patients. Deletions of chromosomes 11q and 17p confer much shortened median survival. Some of these abnormalities may already be present at the time of diagnosis, others (e.g. 17p and 11q) may occur during the progression of the disease and especially after chemotherapy.
3.2.4 Current therapy and treatment
Today there are different treatment options ranging from single-agent treatment over combinatorial chemotherapy to the use of monoclonal antibodies in combination with chemotherapy (immunochemotherapy). Until today, unfortunately these therapies do not cure CLL, only the use of hematopoietic stem cell transplantation can result in complete and durable remission of the leukemia.
Prior to the year 2000, single-agent treatment was based on alkylating reagents such as chlorambucil, alone or together with corticosteroids. Most of the patients eventually relapsed, and the complete remission (CR) rate was below 10 %. The use of a combinatorial chemotherapy (e.g CHOP (cyclophosphamide, doxorubicine, vincrisitine, originally known as Oncovine and prednisolone) regimen) resulted in higher response rates, but toxicity also increased and it remained unclear whether patients had a benefit in terms of overall survival.
The advent of purine analogs, such as fludarabine, brought a clear improvement in therapy, reaching at least a CR rate of approximately 15 % with a significant improvement of progression-free survival (Rai et al., 2000). Combination of fludarabine with cyclophosphamide, the FC regimen (Eichhorst et al., 2006) and recently with the anti- CD20 antibody Rituximab, the FCR regimen (Hallek et al. 2008, ASH abstract) achieved
Introduction
_________________________________________________________________________
against CD52, which is expressed on all human lymphocytes, monocytes and macrophages, is another antibody successfully used for the treatment of refractory CLL patients.
The concept of high-dose chemotherapy supported by autologous stem cell transplantation has produced also high remission rates, but given the increased toxicity and risk, the benefit in terms of progression-free survival was too little and the long-term side effects (secondary cancers, compromise of bone marrow function) too frequent to support this concept any longer, especially since no definitive cure can be reached (Pavletic et al., 1998; Sutton et al., 1998).
Therefore, allogenic hematopoietic stem cell transplantation is the only therapy offering a potential cure of the disease (Michallet et al., 1996; Rondon et al., 1996; Doney et al., 2002; Moreno et al., 2005). But this comes at a substantial risk of mortality from infection and relapse.
3.3 T cell leukemia-1 (TCL1)
The T cell leukemia-1 family of oncoproteins was first discovered because of its involvement in characteristic chromosomal rearrangements in mature T-cell tumors. Those translocations and inversions juxtaposed in the coding regions at 14q32 or Xq28. They interact with the T cell receptor (TCR) at 14q11 or 7q35. There are three human members of the family, mature T-cell proliferation 1 (MTCP1), TCL1 (also called TCL1A) and TCL1B (also known as TML1) (Stern et al., 1993; Virgilio et al., 1994; Pekarsky et al., 1999; Sugimoto et al., 1999). In the mouse Mtcp1 and Tcl1 were identified by homology to human TCL1 (Madani et al., 1996; Narducci et al., 1997) and five additional mouse genes (Tcl1b1, Tcl1b2, Tcl1b3, Tcl1b4 and Tcl1b5) were cloned by their homology to the human TCL1B (Hallas et al., 1999).
3.3.1 Expression pattern of TCL1
TCL1-family genes in mice are mainly expressed during early embryogenesis, in fetal and adult tissues and precursor lymphocytes. Tcl1 is also expressed during B-cell development from the pro-B cell through germinal center B cells and also in T-cell development, mainly in CD4-CD8- and CD4+CD8+ thymocytes (Narducci et al., 1997;
Kang et al., 2005).
Introduction
_________________________________________________________________________
During human embryogenesis, the expression of TCL1 family genes has not been evaluated. It is known that TCL1A expression begins in pre-B cells, is downregulated in germinal center B cells and silenced in memory B and plasma cells (Virgilio et al., 1994;
Teitell et al., 1999; Muschen et al., 2002). In T-cell development, TCL1A is only expressed in early T cells before the appearance of the surface T cell receptor (Narducci et al., 1997; Hoyer et al., 2005). Other, non-lymphatic tissues do not express TCL1, with the exception of ovaries (Virgilio et al., 1994).
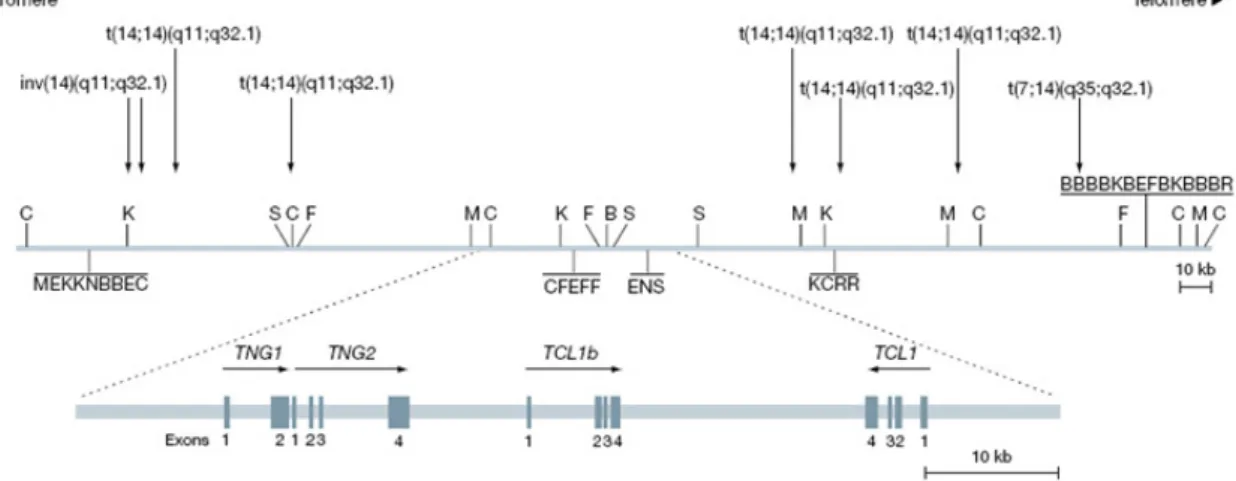
3.3.2 Organization of the TCL1 gene locus
The TCL1 family of genes span between 4 and 8 exons and transcribe mRNAs which have a length of 1.2 to 2.0 kb. They are located on chromosome 14q32 and on Xq28 in humans. In mice, the Tcl1 genes are located on chromosome 12 and the X chromosome.
It is known that rearrangements of the TCL1-gene locus are associated with T-cell leukemias of the mature phenotype, e.g. T-cell prolymphocytic leukemia (T-PLL) (Taylor et al., 1996), adult T-cell leukemia (ATL) (Narducci et al., 1997) and with T-cell leukemias that develop in patients with the Ataxia telangiectasia syndrome (AT) (Brito- Babapulle and Catovsky 1991). In most cases, the TCL1 locus on chromosome 14q32.1 rearranges with the T-cell receptor (TCR) α/δ locus on chromosome 14q11 (Russo et al., 1989; Virgilio et al., 1993). These rearrangements are either reciprocal translocations or inversions. By chromosomal aberrations, the TCL1 oncogene is placed under aberrant enhancer/promoter stimulation which leads to its overexpression.
Introduction of the human TCL1 cDNA under the control of the lck promoter leads to transgenic mice developing premalignant T-cell proliferations (Virgilio et al., 1998).
Pekarsky et al. could show that TCL1 is a real oncogene and that the deregulation of TCL1 initiates the process of malignant transformation (Pekarsky et al., 2001).
Introduction
_________________________________________________________________________
Figure 4: Genomic organization of the human TCL1 gene locus (modified from(Pekarsky et al., 2001).
3.3.3 Structure of the TCL1 protein
The TCL1 family proteins range in size from 13 to 15 kDa with a moderate sequence conservation between the family members (Fu et al., 1994). The proteins are non- enzymatic and their structures, expression patterns and subcellular locations dictate their physiological and tumorigenic properties. Murine Tcl1 and human TCL1A show a tightly packed internal hydrophobic core and share a novel β-barrel structure which includes two four-stranded β-chain sheets connected by a long looping strand (Fu et al., 1998; Hoh et al., 1998; Petock et al., 2001). Purification studies of human TCL1 provide evidence for dimerization (Hoh et al. 1998, structure).
Figure 5: The TCL1 oncoprotein as a homodimer.
Introduction
_________________________________________________________________________
3.3.4 Functional aspects of TCL1
TCL1 interacts with the N-terminal pleckstrin homology (PH) domain of the serine/threonine kinase Akt (Laine et al., 2000; Pekarsky et al., 2000). Like TCL1, Akt belongs to a multiprotein family that includes Akt1, Akt2 and Akt3 (also called PKBα, PKBβ and PKBγ) (Bellacosa et al., 1991; Datta et al., 1999; Brazil and Hemmings 2001).
Akt activation is initiated by the binding of an appropriate growth- or survival-stimulating ligand to the cell surface receptor, e.g. epidermal growth factor (EGF) to EGF receptor or stimulation of the BCR by soluble antigens. The bound cell surface receptor recruits a receptor tyrosine kinase which triggers phosphatidylinositol 3-kinase (PI3K) activation at the membrane which produces the Akt docking phospholipids. Akt is recruited to the inner leaflet of the cytoplasmic membrane, facilitating the assembly of a signaling complex. Akt needs its PH domain for membrane relocalization and direct binding to the docking phospholipids and activation by phosphorylation. (Burgering and Coffer 1995;
Delcommenne et al., 1998; Chan et al., 1999; Auguin et al., 2004; Bayascas and Alessi 2005). Studies showed that Akt is able to cause T-cell lymphoma in mice (Staal et al., 1977).
In yeast-two hybrid screens Laine et al. found that all TCL1 isoforms bind to the PH domain of Akt. Substrate phosphorylation and the kinase activity of Akt are enhanced by the binding of TCL1 which induces conformational changes of Akt within an oligomeric TCL1-Akt protein complex (Laine et al., 2000). Akt plays a central role in cell survival and proliferation. As TCL1 is located in the cytoplasm as well as in the nucleus (Pekarsky et al., 2000) it can promote the nuclear transition of Akt (Pekarsky et al., 2001) which is normally located in the cytoplasm (Chan et al., 1999).
3.3.5 TCL1 in Chronic Lymphocytic Leukemia
As it is known that TCL1 is highly expressed in most B-cell tumors, the TCL1 levels in CLL were analysed by immunohistochemical stainings, western blotting and flow cytometry (Herling et al., 2006). TCL1 is not uniformly expressed, but appears to be only upregulated in a subset of CLL patients. Herling et al. found a correlation between high TCL1 levels and the subset of CLL which is characterized by an unmutated VH gene status as well as high ZAP-70 expression. Low levels of TCL1 were found in actively proliferating centers of the tumor components (Herling et al., 2006).
Introduction
_________________________________________________________________________
3.3.6 The TCL1 mouse model
Research in CLL was limited by the lack of a suitable mouse model for CLL until 2002 when an American group overexpressed human TCL1 in B cells of mice and found that these mice developed a lymphoproliferative disease very reminiscent of CLL. The TCL1 mouse model was further investigated by several independent groups and found to be a valuable model for the analysis of CLL pathogenesis.
In these mice, a 350 bp fragment of the human TCL1 coding region is expressed under the control of a mouse IgVH promoter and the Eµ enhancer whose activity specially targets immature and mature B cells. The animals were bred on a B6C3 background (a cross between a female C57Bl/6NCrl mouse and a male C3H/HeNCrl mouse).
Figure 6: Transgenic construct used to generate the TCL1 transgenic mouse. The human TCL1 gene is expressed under the control of the B cell specific Eµ-enhancer and the IgVH promoter.
These animals spontaneously develop B cell hyperplasia, initially in the peritoneal cavity and then in lymph nodes, spleen, bone marrow and blood, resulting in a massive B cell clonal expansion (Bichi et al., 2002). Accumulation of CD5-positive B cells leads to enlarged spleens, livers and lymph nodes along with high blood lymphocyte counts.
Analysis of the IgVL and IgVH genes show no significant somatic hypermutation, indicating that the molecular features of the B cell receptor of the transgenic mice resemble those from human CLL patients with the unmutated and more aggressive form of CLL (Yan et al., 2006). The model has also been successfully used for the analysis of new therapeutic drugs for the treatment of human CLL (Johnson et al., 2006).
3.4 Aim of the Work
MIF is a potential molecular link between inflammation and tumorigenesis. In the pathogenesis of CLL, the microenvironment plays a prominent role since the disease would not exist without continuous protection of the CLL cells by pro-survival signals from the micromilieu. In this work we would like to analyse the role of MIF in the pathogenesis of CLL.
Introduction
_________________________________________________________________________
To understand the relevance of MIF for the pathogenesis of CLL, we used the above described Eµ-TCL1 mouse model for human CLL (Bichi et al., 2002). We have crossed the Eµ-TCL-1-transgenic mouse model with MIF knockout (MIF-/-) mice. TCL1+/wt MIF-/- and TCL1+/wt MIF+/+ mice were compared with respect to leukemia development, tumor burden, cytogenetic aberrations and survival. Further studies should reveal the mechanism by which MIF affects CLL pathogenesis.
Results
_________________________________________________________________________
4 Results
4.1 Macrophage Migration Inhibitory Factor (MIF) is overexpressed in malignant B cells and human chronic lymphocytic leukemia (CLL)
Macrophage Migration Inhibitory Factor (MIF) is a known mediator in inflammatory diseases. It is known to have an influence in the innate immune system (Denkinger et al., 2004). In infections, like e.g. sepsis or malaria, MIF is rapidly released by the immune cells and has autocrine and paracrine effects promoting cell growth and survival (Calandra and Roger 2003). In contrast to MIF acting as a cytokine, MIF secretion is also induced due to glucocorticoid hormones (Calandra and Bucala 1995). MIF’s role in the adaptive immune system is still under investigation, though it is known that MIF is released by activated lymphocytes. Possibly acting through an autocrine loop, MIF is known to activate T lymphocytes and to support their proliferation (Bacher et al., 1996).
Research into the biological mechanisms of MIF action have resulted in several possibilities how MIF could influence and regulate cellular growth, differentiation, malignant transformation or apoptosis ((Takahashi et al., 1998; Chesney et al., 1999; Yang et al., 2000; Mitchell et al., 2002; White et al., 2003). In different cancer entities like metastatic prostate cancer or breast carcinoma, MIF expression is upregulated. Different studies described its involvement in the development of lymphomas as well as tumor- associated angiogenesis (Chesney et al., 1999; Nishihira 2000). As inflammation is a critical risk factor for tumor development (Karin et al., 2006), MIF is potentially one link between chronic inflammation and tumor formation or tumor progression (Hardman et al., 2005; Bucala and Donnelly 2007). The MIF expression levels seem to correlate with the tumor aggressiveness (here tested in human melanoma) and also with its metastatic potential (Shimizu et al., 1999).
In CLL, inflammatory processes play an important role since the disease has features of one that is driven by antigenic stimuli (Ghia et al., 2008). Also, survival of the leukemic clone crucially depends on environmental stimuli provided by cytokines, chemokines, angiogenic factors or the extracellular matrix since the leukemic cells spontaneously become apoptotic when the micromilieu is taken away (Burger et al., 2000).
To investige whether MIF protein expression is upregulated in human CLL, we selected 10 patients with CLL and a white blood count (WBC) > 50 G/l. The protein content of Ficoll-isolated peripheral blood mononuclear cells (PBMC’s) of these CLL patients was compared with the protein content of sorted CD19+ B cells from the peripheral blood of
Results
_________________________________________________________________________
10 healthy donors. In CLL patients, by densitometric analysis MIF was found to be upregulated approximately four-fold compared to healthy B cells. A representative example of this analysis is given in Fig. 7.
Figure 7: MIF protein is overexpressed in human B-CLL. Representative western blot analysis of MIF protein expression in human CLL PBMC’s in comparison to sorted CD19+ B cells of a healthy control. MIF is 4-fold upregulated in CLL patient samples. 50 µg of protein were loaded onto the gel, membrane was incubated o/n with anti-MIF antibody (dilution 1:1000). β-Actin (1:3000) was used as loading control.
In order to find out whether overexpression of MIF contributes to the development of CLL or has only bystander significance, we took advantage of the Eµ-TCL1 transgenic mouse (Bichi et al., 2002) to analyse the role of MIF in the pathogenesis of CLL in vivo.
4.2 Characterization of the Eµ-TCL1 model for murine CLL
The Eµ-TCL1 mouse model (Bichi et al., 2002) expresses a 350 bp fragment containing the entire coding region of the human TCL1 gene under the Eµ-enhancer and an IgVH promoter. The animals were generated on a B6C3H mixed background. The resulting phenotype of TCL1 overexpression is a lymphoproliferative disease which arises after 8 to 15 months of age and strongly resembles human CLL. Later investigations showed that this CLL is of the unmutated form, thus representing more or less the more aggressive form of human CLL (Yan et al., 2006).
Results
_________________________________________________________________________
Figure 8: Appearance of a TCL1+/+ mouse at the age of 10 months. This mouse shows a distended abdomen due to hepatosplenomegaly and the fur is scrubby. At this stage of disease the animals are still active and agile. When the disease progresses and the general performance of the mice declines and they need to be euthanized.
With increasing age, the animals show clear signs of disease which are manifested by scrubby fur, increase in size of the abdomen due to splenomegaly and a reduction in the general performance. Macroscopic examination of euthanized mice at an advanced disease stage shows enlarged lymphoid organs (spleen, liver and lymph nodes) (Fig. 8). Some animals also developed ascites, an accumulation of fluid in the peritoneal cavity.
Figure 9: Example of a leukemic splenomegaly in a TCL1+/+ mouse in comparison to the normal spleen size in a C57Bl/6 wildtype control mouse. Both animals were sacrificed at the age of 12 months. The spleen of the TCL1+/+ mouse has a weight of 4.25 g whereas the spleen of the wildtype animal only weighs 0.25 g.
To determine whether the disease is really a B cell lymphoma, lymphoid organs such as spleen, lymph nodes, liver and bone marrow were collected and fixed in 4 % formalin solution. After 1 week of fixation, the organs were processed and embedded into paraffin.
Results
_________________________________________________________________________
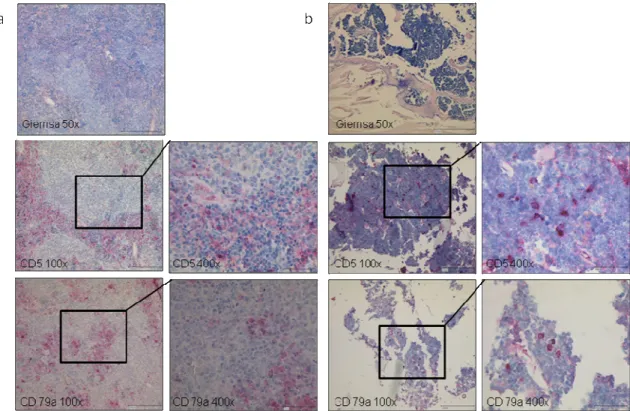
Sections of 3 µm width were cut and stained with Giemsa. Furthermore, staining for the CLL marker CD5 and the B cell marker CD79a were done in cooperation with PD Dr.
H. Kvasnicka at the Institute of Pathology, Cologne University.
Figure 10: TCL1+/+ mice develop a CD5-positive B cell lymphoma. Representative Giemsa stain and immunohistochemical staining for CD5 and CD79a in spleen (a) and bone marrow (b) from a leukemic TCL1+/+ mouse. The leukemic infiltrates are positive for CD5 and CD79a.
Histopathological examination of the affected spleens showed that the splenic architecture was totally destroyed by many small lymphocytes which infiltrated the organ (Fig. 10a).
These small, mature looking lymphocytes are positive stained by IHC for the B cell marker CD79a and CD5. Similar leukemic infiltrates can be found in the liver or in the bone marrow (Fig. 10b).
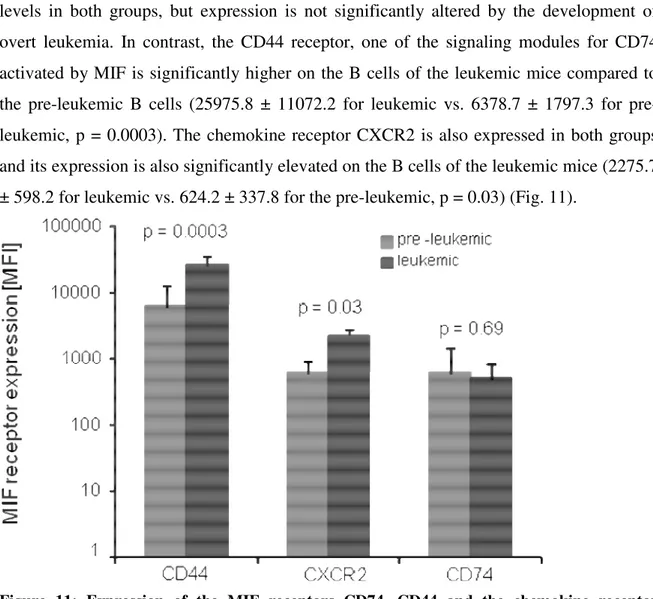
Next we wanted to know whether the known MIF receptors CD74/CD44 and CXCR2 are expressed on B cells in this disease model. Peripheral blood from the tail vein of pre- leukemic (age 3 months) and leukemic TCL1+/+ mice was incubated with specific fluorescence-labelled monoclonal antibodies binding to CD74, CD44 and CXCR2 and the surface expression was measured with the use of a FACS Canto flow cytometer.
As shown in Fig. 11, the MIF receptors are expressed both in pre-leukemic as well as in
Results
_________________________________________________________________________
levels in both groups, but expression is not significantly altered by the development of overt leukemia. In contrast, the CD44 receptor, one of the signaling modules for CD74 activated by MIF is significantly higher on the B cells of the leukemic mice compared to the pre-leukemic B cells (25975.8 ± 11072.2 for leukemic vs. 6378.7 ± 1797.3 for pre- leukemic, p = 0.0003). The chemokine receptor CXCR2 is also expressed in both groups and its expression is also significantly elevated on the B cells of the leukemic mice (2275.7
± 598.2 for leukemic vs. 624.2 ± 337.8 for the pre-leukemic, p = 0.03) (Fig. 11).
Figure 11: Expression of the MIF receptors CD74, CD44 and the chemokine receptor CXCR2 in TCL1+/+ mice. Peripheral blood of pre-leukemic and leukemic animals (n = 5 each) was analysed by FACS. The CD44 signaling complex is significantly higher expressed in the leukemic mice (p = 0.0003) as well as the CXCR2 receptor (p = 0.03). CD74 is expressed to nearly the same extend in both groups.
Taken together, these preliminary insights into the Eµ-TCL1 mouse model suggested to us that it was a suitable model for the analysis of MIF’s role in CLL pathogenesis.
4.3 Analysis of the role of Macrophage Migration Inhibitory Factor (MIF) in the development of murine CLL
In order to obtain a clear picture of what MIF’s role might be in the pathogenesis of CLL we bred the TCL1+/+ transgenic mouse to the MIF-/- mouse which had been generated by deleting the entire mif gene using a loxP-Cre based deletion system (Fingerle-Rowson
Results
_________________________________________________________________________
et al., 2003). The MIF-/- animals do not show any developmental abnormalities, are fertile and produce litters of normal size. Most importantly, their rate of spontaneous tumor or leukemic formation is not elevated compared to normal wildtype littermates (Fingerle- Rowson, personal communication).
Breeding of the MIF-/- mouse to the TCL1+/+ transgenic mouse was done in the animal facility of the experimental surgery, currently run by the Clinic I of Internal Medicine at the University Hospital Cologne. Since a homozygous state of the transgene might cause artificial phenotypes, special care in the breeding strategy was taken to avoid a homozygous state of TCL1 in the F2 generation. The animals of the F2 generation with the genotypes TCL1+/wt MIF-/- and TCL1+/wt MIF+/+where used for the analysis of the leukemic development and survival.
Figure 12: Breeding strategy of the TCL1+/+ mouse to the MIF-/- mouse. Animals of the F1 generation with the genotype TCL1+/wt MIF+/- were bred to animals with the genotype TCL1wt/wt MIF+/- to obtain the animals of the F2 generation. The animals with the desired genotypes TCL1+/wt MIF+/+ and TCL1+/wt MIF-/- where used for the experiments.
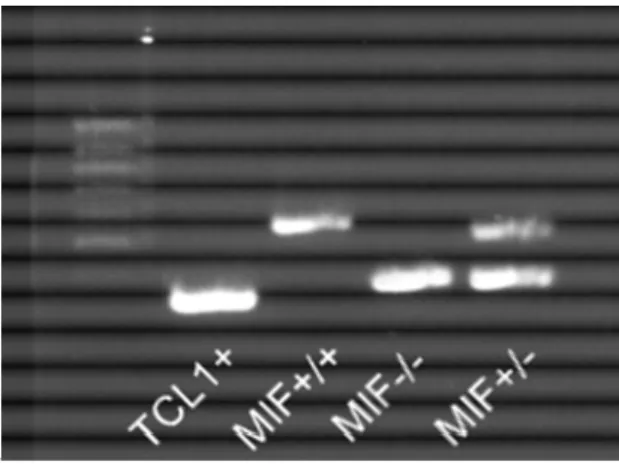
Animals with the genotypes TCL1wt/wt MIF+/+ and TCL1wt/wt MIF-/- from the F2 generation are used as controls. The genotypes of the animals were determined by polymerase chain reaction (PCR). A piece of tail was taken from each mouse while weaning it from the parents. DNA was extracted from the tail tissue and a genomic PCR with mif-gene-specific and tcl1-gene-specific primers was run and analysed on an agarose gel.
Results
_________________________________________________________________________
Figure 13: Genotyping of the TCL and MIF status. Gel of a genotyping PCR. Lane 1 shows the amplification product of TCL1 specific primers (300 bp), lane 2 the product of the MIF wildtype allele (544 bp), and lane 3 the product of the MIF knockout allele (383 bp). In lane 4 the expected bands of a MIF heterozygous mouse is given (544 bp and 383 bp).
Figure 14: Schematic view of genotyping strategy for MIF. The wildtype mif gene is determined with the specific primers B and C, B binds in exon 3 (product 544 bp). In the knockout, the primers A and C bind to the MIF gene, leading to a 383 bp product.
After determination of the correct genotypes, animals were either put into the different experimental groups or used as control animals.
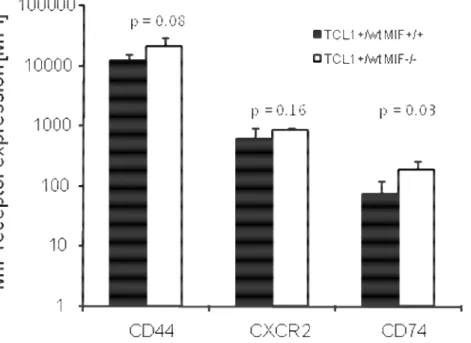
4.4 Macrophage Migration Inhibitory Factor receptors are expressed in murine CLL
As I could show before in the pre-leukemic as well as in the leukemic TCL1+/+ mice, the MIF receptors CD74 and its signaling complex CD44 and the MIF chemokine receptor CXCR2 are expressed. To check whether there is a difference due to the MIF knockout, the analysis was repeated for the TCL1+/wt MIF+/+ and TCL1+/wt MIF-/- mice. Five animals of each group were analysed by FACS for their receptor expression. Peripheral blood from the tail vein of pre-leukemic animals of both groups was taken for the analysis. The animals had the age of 6 months.
Results
_________________________________________________________________________
Figure 15: Expression of the MIF receptors CD74, CD44 and the chemokine receptor CXCR2in TCL1+/wt MIF+/+ and TCL1+/wt MIF-/- mice. Peripheral blood of pre-leukemic animals (n = 5 per genotype) was analysed by FACS. The CD44 signaling complex as well as the CXCR2 receptor are expressed to nearly the same extends in both groups. CD74, the extracellular MIF receptor is also expressed in both groups, but it is significantly higher in the MIF-/- animals (p = 0.03).
Fig. 15 shows the expression of the different receptors in pre-leukemic TCL1+/wt MIF+/+
and TCL1+/wt MIF-/- mice (n = 5 per group). Each receptor is expressed on the surface of the blood cells, all of them higher in the TCL1+/wt MIF-/- mice. CD44, the signaling complex is expressed highest again in both genotypes. CXCR2 is also expressed in both groups, a little bit higher in the TCL1+/wt MIF-/- mice. Only CD74, the MIF receptor is significantly higher expressed on the TCL1+/wt MIF-/- mice (90.5 ± 38.1 for MIF+/+ vs.
286.5 ± 135.2 for the MIF-/- mice, p = 0.03).
4.5 Analysis of the leukemia development
The analysis of the development of the leukemia in the peripheral blood was done from tail vein blood taken in intervals of three months (i.e. months 3, 6, 9 and 12) and analyzed for leukocyte numbers, differential blood stain and the presence of CD5+IgM+ cells. Fig. 16 shows a representative example of a blood smear from a TCL1+/wt MIF+/+
Results
_________________________________________________________________________
strongly increased number of small, mature lymphocytes. Besides those intact cells, many cells with ruptured membranes can be seen. These cells, so called smudge cells or
“Gumprecht’s nuclear shadows” are due to an increased fragility of the cellular membrane, however, the cellular rupture occurs only during the preparation of the slides. These smudge cells are a diagnostic hallmark of human CLL.
Figure 16: Giemsa stain of a peripheral blood smear of a leukemic TCL1+/wt MIF+/+ mouse.
There is an accumulation of small lymphocytes with thin cytoplasm and dense nuclei (thick arrows). Thin arrows point towards smudge cells (also called “Gumprecht’s nuclear shadows”), the characteristic hallmark feature of chronic lymphocytic leukemia.
White blood count (WBC), the red blood cell counts (RBC) and platelet counts (PLT) are measured by laser flow cytometry from the tail vein blood of the mice. These parameters give a global overview on the state of the hematopoietic system and provide a first hint to the potential presence of leukemia.