Research Collection
Presentation
An urban design response to the technological shift in transportation
How to conduct urban design with vehicle automation, sharing and connectivity
Author(s):
Maheshwari, Tanvi Publication Date:
2020-11-18 Permanent Link:
https://doi.org/10.3929/ethz-b-000451973
Rights / License:
In Copyright - Non-Commercial Use Permitted
This page was generated automatically upon download from the ETH Zurich Research Collection. For more information please consult the Terms of use.
ETH Library
AN URBAN DESIGN RESPONSE TO THE TECHNOLOGICAL SHIFT IN TRANSPORTATION
How to conduct urban design with vehicle automation, sharing and connectivity Tanvi Maheshwari | 18 November 2020
Preferred citation style
Maheshwari, Tanvi (2020) An urban design response to the technological shift in transportation, Future Cities
Laboratory Webinar, Singapore, November 2020.
THE DRIVERLESS VEHICLE 02
Winner of the 2004 DARPA Grand Challenge race for driverless vehicles.
Source: cs.cmu.edu
An early driverless car or ‘phantom auto’ from 1921
Source: chroniclingamerica.loc.gov
THE ‘TECHNOLOGICAL SHIFT’ 03
Dominant ride-hailing apps in 171 countries around the world (2016)
Source: similarweb.com
The rise of Electric Vehicles
Source: channelnewsasia.com
Increasing connectivity The convergence of emerging systems and technologies
in transportation have the potential to converge and
fundamentally shift existing mobility patterns.
THE CAR AND THE CITY 04
General Motors’ Futurama exhibit designed by Norman Bel Geddes in 1939
System of Automobility : a path-dependent pattern of development of society and urban form, stemming from the automobile.
(Urry , 2004)
Will the technological shift in transportation further the system of automobility or does it have the potential to dismantle it?
Source: (Right) General Motors (obtained from computerhistory.org) (Left) mot.gov.sg
View of a highway in Singapore
IMPACT OF THE SHIFT 05
General Motors’ Futurama exhibit designed by Norman Bel Geddes in 1939
Pace of technological development Public Acceptance
Operational Policy
Urban Design and Planning
Driving Forces
B. Segregating Street Space
B1: Grade separation
B2: At-grade physical buffer
B3: Shared street
A1: BAU A2: Reducing lane width A2: Reducing no. of lanes
A. Reclaiming Street Space
C. Responsive Streets
METHODOLOGY 06
Four Design Experiments
L2NIC-2B Project: Planning for Autonomous Vehicles
07
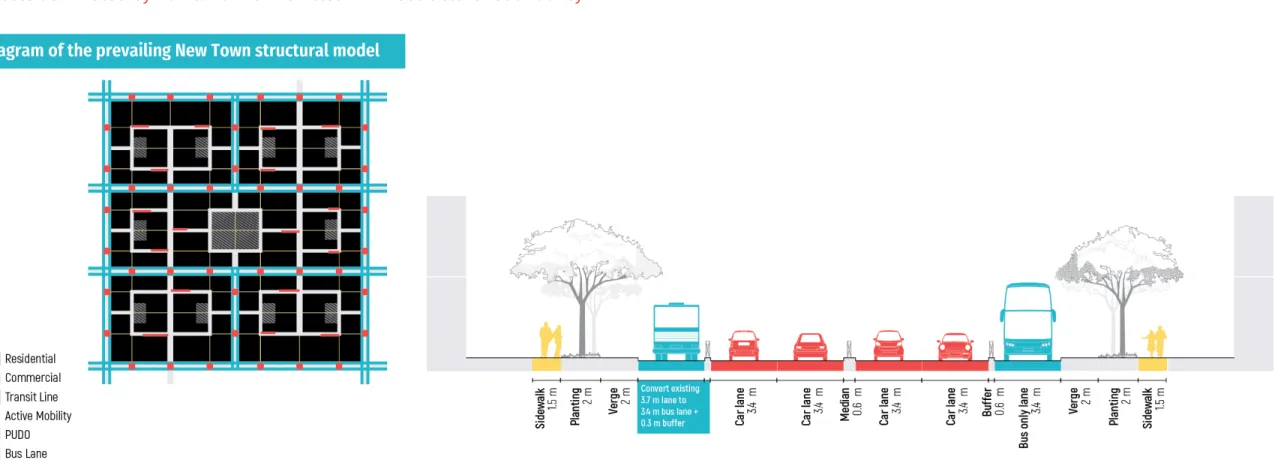
SINGAPORE NEW TOWNS
Source: (Heng, 2015),
“Singapore’s new town development is an experiment in an urban laboratory
Liu Thai Ker (Liu et al., 1983)
How can the prevailing New Town Structural model can be modified in response to the technological shift in transportation?
Fictional New Town Prototype Transport options
Privately owned AVs
Single person automated taxi pods
6-20 seater Demand Responsive Transit or DRT Fixed route scheduled automated buses Mass Rapid Transit
Sketch MATSim User Interface developed by Ordoñez and Fourie
08
NETWORK EXPERIMENT
Loops Grid Superblock
Loops Grid Superblock
Mean distance
travelled/ride (km) 5.67 3.86 3.70
Detour Ratio 2.09 1.85 1.59
- 200,000 400,000 600,000 800,000 1,000,000 1,200,000
Loops Grid Superblock
DRT, Taxi and Car VKT
DRT - Empty VKT DRT - Revenue VKT Taxi - Empty VKT Taxi - Revenue VKT Car VKT
To ta l v eh icle k ilo m et re s t ra ve lle d
Bösch, P.M., Becker, F., Becker, H., Axhausen, K.W., 2018. Cost-based analysis of autonomous mobility services. Transport Policy 64, 76–91.
10
NETWORK EXPERIMENT
Loops Grid Superblock
Mean distance
travelled/ride (km) 5.67 3.86 3.70
Detour Ratio 2.09 1.85 1.59
110,000 115,000 120,000 125,000 130,000 135,000 140,000 145,000
Loops Grid Superblock
DRT Trip Legs
First/last mile connectivity remains an issue in the existing hierarchical and disconnected street network, despite DRT deployment.
In a more connected street network, well-designed active mobility network is a necessary complement.
- 20,000 40,000 60,000 80,000 100,000 120,000 140,000 160,000
Loops Grid Superblock
Taxi Trip Legs
215,000 220,000 225,000 230,000 235,000 240,000 245,000 250,000 255,000 260,000 265,000
Loops Grid Superblock
Car Trip Legs
To ta l n um be r o f t rip le gs
12
NETWORK EXPERIMENT
0 0.5 1 1.5 2 2.5