Zones — A Case Study of the Angola Basin
D. Guinoiseau1,2, S. J. G. Galer1, W. Abouchami3, M. Frank4, E. P. Achterberg4, and G. H. Haug1
1Climate Geochemistry Department, Max Planck Institute for Chemistry, Mainz, Germany,2Now at Institut de Physique du Globe de Paris, Université de Paris, Paris, France,3Institut für Geologie und Mineralogie, Universität zu Köln, Cologne, Germany,4GEOMAR Helmholtz Center for Ocean Research Kiel, Kiel, Germany
Abstract
Understanding oceanic cadmium (Cd) cycling is paramount due to its micronutrient‐like behavior in seawater, which has been inferred from its similarity to phosphate (PO4) cycling. Cadmium concentrations follow a nutrient‐like consumption‐regeneration cycle in the top of the water column and are mainly controlled by water mass mixing and circulation in the deep ocean. However, an additional scavenging mechanism through cadmium sulfide (CdS) precipitates, occurring within sinking biogenic particles in oxygen deficient zones (ODZ), has been proposed. In this study, we report Cd stable isotope and concentration data for seven vertical seawater profiles sampled during GEOTRACES cruise GA08 in the northern Cape and Angola Basins, which feature a significant ODZ along their eastern margins. Outside the ODZ, Cd cycling is similar to that previously reported for the South Atlantic. While water mass mixing largely controls deep ocean Cd isotope signatures, Cd isotope fractionation in surface waters can be modeled as an open system at steady state buffered by organic ligand complexation. In the ODZ, stronger Cd depletion relative to PO4is associated with a shift inδ114Cd toward heavier values, which is indicative of CdS precipitation. Our interpretation is supported by experimental CdS precipitation data and a size‐resolved particle model involving bacterial sulfate reduction as a precursor of CdS. Our estimates of the CdSflux to the seafloor (107to 109mol/yr) indicate that CdS precipitation is a significant process of Cd removal and constitutes a nonnegligible Cd sink that needs to be better quantified by Cd isotope analyses ofmarine sediments.
1. Introduction
The distribution of dissolved oceanic cadmium (Cd) has been extensively studied over the past 40 years due to its nutrient‐like behavior, which mimics that of phosphate (PO4) in the water column reflecting phyto- plankton uptake in the surface ocean and regeneration at depth via sinking particle mineralization (E. A.
Boyle et al., 1976; K. W. Bruland, 1980). Our understanding of the oceanic Cd cycle has significantly improved over the past decade based on work in the frame of the international GEOTRACES program (E.
Mawji et al., 2015) and analytical development of Cd isotope measurements, which, in addition to Cd con- centration data, have provided new insights into the biogeochemical processes controlling its dissolved and particulate distribution (W. Abouchami et al., 2011; W. Abouchami et al., 2014; Conway & John, 2015b; M.
Gault‐Ringold et al., 2012; E. George et al., 2019; D. J. Janssen et al., 2017; D. J. Janssen et al., 2019; D. J.
Janssen et al., 2014; S. G. John et al., 2017; S. Ripperger et al., 2007; M. Sieber et al., 2018; R. C. Xie et al., 2018; R. C. Xie et al., 2019; R. C. Xie et al., 2017; Z. Xue et al., 2013; S. C. Yang, 2015; S.‐C. Yang et al., 2018). The existing literature shows that despite the overall similar behaviors of Cd and PO4, subtle varia- tions with depth in Cd/PO4ratios (W. Abouchami et al., 2014; O. Baars et al., 2014; R. Middag et al., 2018) andδ114Cd signatures can be resolved in the water column (e.g. R. C. Xie et al., 2017).
Preferential Cd assimilation by phytoplankton in the surface ocean (J. T. Cullen et al., 1999; H. J. W. de Baar et al., 1994; M. J. Ellwood, 2008; E. S. Lane et al., 2009), differences in remineralization depth of Cd and PO4
(H. L. Bourne et al., 2018), and/or variable remineralization efficiency of different types of organic particles (D. J. Janssen et al., 2019; Roshan & Wu, 2015; S. Roshan et al., 2017; Wu & Roshan, 2015) have been pro- posed to account for vertical Cd/PO4variabilities. Regarding Cd isotopes, Cd uptake by phytoplankton is accompanied by enrichment in light isotopes in biogenic particles compared to seawater (D. J. Janssen et al., 2019; D. J. Janssen et al., 2014; S.‐C. Yang et al., 2018), in line with laboratory culture experiments
©2019. The Authors.
This is an open access article under the terms of the Creative Commons Attribution‐NonCommercial‐NoDerivs License, which permits use and distri- bution in any medium, provided the original work is properly cited, the use is non‐commercial and no modifica- tions or adaptations are made.
Key Points:
• Cd cycling in the Angola Basin is overall similar to the rest of the South Atlantic
• Sulfide precipitation exerts control on Cd in Angola Basin oxygen deficient zone
• Flux of CdS to seafloor is important to global oceanic Cd budget
Supporting Information:
•Supporting Information S1
Correspondence to:
D. Guinoiseau, d.guinoiseau@mpic.de
Citation:
Guinoiseau, D., Galer, S. J. G., Abouchami, W., Frank, M., Achterberg, E. P., & Haug, G. H. (2019). Importance of cadmium sulfides for biogeochemical cycling of Cd and its isotopes in Oxygen Deficient Zones—A case study of the Angola Basin.Global Biogeochemical Cycles,33,,,, https://doi org/
10.1029/2019GB006323
Received 18 JUN 2019 Accepted 26 NOV 2019
Accepted article online 5 DEC 2019 1746 1763.–
Published online 17 DEC 2019
(John & Conway, 2014; F. Lacan et al., 2006). Early Cd isotope studies reported heavy surface oceanδ114Cd (up to 5‰) values at picomolar dissolved Cd concentrations that were attributed to closed‐system Rayleigh fractionation resulting from biological uptake of light Cd (Conway & John, 2015a, 2015b; S Ripperger et al., 2007). However, recent studies have revealed a homogeneousδ114Cd signature in the ocean surface, particu- larly in Cd‐deficient surface waters from the Atlantic and Pacific Oceans (M. Gault‐Ringold et al., 2012; E.
George et al., 2019; D. J. Janssen et al., 2017; M. Sieber et al., 2018; R. C. Xie et al., 2018; R. C. Xie et al., 2019; R. C. Xie et al., 2017). These variations have been variably interpreted as reflecting (i) a Cd supply‐
limited regime (M. Gault‐Ringold et al., 2012), (ii) Cd complexation by organic ligands acting to buffer δ114Cd (prevent removal), or alternatively (iii) Cd isotope fractionation in a steady‐state open system in sur- face waters (R. C. Xie et al., 2017).
At depth, the relationship between Cd and PO4is“bilinear,”with a“kink”at PO4concentration of 1.3 μmol/L, the origin of which has been extensively debated (J. T. Cullen, 2006; H. J. W. de Baar et al., 1994;
P. Quay et al., 2015). Several recent studies have called upon simple deep‐water mass mixing (W.
Abouchami et al., 2014; O. Baars et al., 2014; P. Quay et al., 2015; R. C. Xie et al., 2015) with Cd remineraliza- tion acting as a secondary controlling factor (R. Middag et al., 2018). A physical control on deep water Cd isotope distribution and its potential use as a conservative water mass tracer wasfirst demonstrated in the Southern Ocean (W. Abouchami et al., 2014) and confirmed by subsequent observations in other oceanic regions (M Sieber et al., 2018; R. C. Xie et al., 2017).
Seawater Cd isotope data in oceanic oxygen deficient zones (ODZs), however, indicate that cadmium sulfide (CdS hereafter) precipitation within sinking biogenic particles may constitute an important mechanism for removal of Cd from the water column (Conway & John, 2015b; D. J. Janssen et al., 2014; R. C. Xie et al., 2019) in agreement with modeling studies (D. Bianchi et al., 2018). The possible occurrence of CdS wasfirst described in the Mauritanian ODZ based on a combination of (1) depletion of dissolved Cd, (2) enrichment of particulate Cd relative to PO4and (3) a shift of dissolvedδ114Cd toward heavier values (Conway & John, 2015b; D. J. Janssen et al., 2014). The Cd isotope fractionation factor determined experimentally during CdS precipitation in synthetic seawater isα114/110Cdsol‐CdS= 1.00032 (D. Guinoiseau et al., 2018) and is in agree- ment withfield observations of a seawater Cd isotope shift, as well as with ab initio models (J. Yang et al., 2015). Furthermore, the size‐resolved particle model recently developed by Bianchi et al. (2018) predicts that microbial sulfate reduction can occur in coarse particle aggregates (>1 mm) at the upper boundary of ODZs (100–200 m depth), thereby releasing H2S into solution and thus promoting local CdS precipitation. The model results of Bianchi et al. (2018) agree well with measured Cd and Cd/PO4profiles in the particulate phase of the Mauritanian ODZ. Such an active cryptic sulfur cycle has also been proposed in the Chilean (D. E. Canfield et al., 2010), Arabian (B. M. Fuchs et al., 2005), North Pacific (Beman & Carolan, 2013; M.
T. Carolan et al., 2015) and Peruvian ODZs (R. C. Xie et al., 2019), based on the identification of sulfide oxi- dizers and sulfate reducing species in picoplankton and bacterial communities. Nevertheless, the absence of strong Cd depletion or Cd isotope shifts in the North Pacific ODZ (Conway & John, 2015a; D. J. Janssen et al., 2017) indicates that the extent of CdS precipitation may be variable among different oceanic ODZs. The asso- ciated particulateδ114Cd data indicate that organic particle mineralization is dominant in the North Pacific ODZ, whereas CdS precipitation, if occurring, was only of minor importance (D. J. Janssen et al., 2019). This is in line with the low particlesflux reaching the low‐oxygen layer in the North Pacific ODZ compared to that in the Mauritanian ODZ, which might prevent any quantitative CdS precipitation (Conway & John, 2015a).
Thus, even if CdS precipitates do indeed form in some oceanic ODZs, the chemical or physical parameters controlling this process still remain uncertain.
The sequestration and export of Cd to marine sediments is mostly associated with burial of particulate non- remineralized organically bound Cd in suboxic (FCd= 0.03–2.3.107mol/yr) and anoxic environments (FCd= 0.09–3.6.107mol/yr) (S. H. Little et al., 2015; Morford & Emerson 1999; Y. Rosenthal et al., 1995; A. van Geen et al., 1995). The effect of sequestration or release of Cd from margin sediments has been discussed in recent Cd isotope studies of the subarctic Pacific and Peru Basin ODZs (D J Janssen et al., 2019; R C Xie et al., 2019).
Additionally, the uncertainties of theflux of preserved CdS to the seafloor—with estimates varying from 0.1
× 107to 1.4 × 10⁹mol/yr (D. Bianchi et al., 2018; D. J. Janssen et al., 2014)—is mainly a result of a lack of constraint on the stability of CdS complexes as they sink out of ODZs into the oxygenated deep water column.
In this study, we examine the seawater distribution of Cd and its isotopes in the northern Cape Basin and Angola Basin. The eastern margin of these basins features major upwelling systems, and we assess whether CdS precipitation occurs in the well‐developed ODZ between 200 and 1,000 m depth. We report seven depth profiles of Cd isotopes and concentrations sampled during GEOTRACES cruise GA08 (Walvis Bay to Walvis Bay, Namibia; 22 November to 27 December 2015). The results show that the Cd isotope characteristics of surface and deep waters, outside the influence of the ODZ, are overall similar to those observed elsewhere in the Southwest Atlantic (R. C. Xie et al., 2017). In particular, our data are consistent with a water mass mix- ing control at depth and surface Cd isotope fractionation in an open ocean steady‐state system buffered by dissolved organic ligands. Importantly, in the top part of the ODZ, the measured Cd depletion associated with a heavierδ114Cd signal is fully consistent with CdS precipitation, in line with previous observations in the Mauritanian or East Tropical South Pacific (ETSP) ODZs (Conway & John, 2015b; S. G. John et al., 2017; R. C. Xie et al., 2019) and the fractionation factor determined experimentally for CdS precipitation (D. Guinoiseau et al., 2018). Altogether, this suggests that CdS precipitation plays a significant role in major ODZs worldwide, with an estimated preservedflux of CdS to the seafloor of 0.87 × 10⁷to 1.04 × 10⁹mol/yr, which may thus represent the major pathway of Cd removal from oxygen deficient waters.
2. Materials and Methods
2.1. Hydrography of the Angola Basin
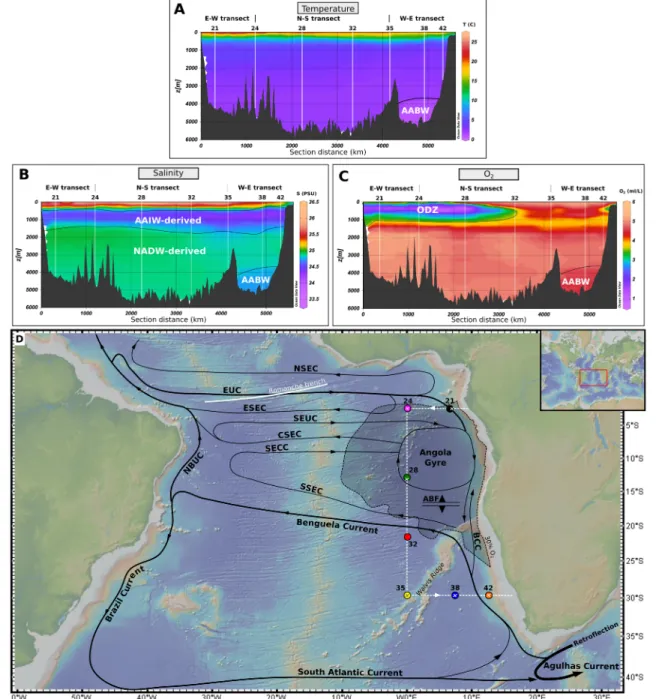
The hydrography of the South Atlantic Ocean, and particularly that of the Angola Basin, has been described in detail in earlier studies (Stramma & England, 1999; Van Bennekom & Berger, 1984). Briefly, the Angola Gyre subsurface circulation is mainly driven by the eastwardflowing Equatorial Undercurrent (EUC), South Equatorial Undercurrent (SEUC), and South Equatorial Countercurrent (SECC) (Figure 1). The southward flow out of the Angola Basin is deviated westward by the northwestern branch of the Benguela Current near 20°S forming the Angola‐Benguela Front (ABF). Export of water across the ABF of up to 7 Sv (H. U. Lass et al., 2000) is counterbalanced by northward inflow of the Benguela Coastal Current (BCC) reaching lati- tudes of 10–20°S. This circulation pattern results in the development of an upwelling system centered in the Angola Dome that is characterized by subsurface nutrient‐rich waters and hypoxic conditions between 200 and 600 m depth. The influence of the Congo River plume that extends up to 800 km offshore (M. Waeles et al., 2013) is negligible for the sampling area of our study.
Below the surface ocean, low salinity Antarctic Intermediate Water (AAIW), found at depths between 500 and 1,300 m, originates from the Indian Ocean and is advected into the southern Atlantic via the Agulhas Current and is transported further northeastward by the Benguela Current (Suga & Talley, 1995).
Between 1,500 and 4,500 m depth, salty and well‐oxygenated North Atlantic Deep Water (NADW) enters the Angola Basin through the Romanche Fracture Zone (RFZ) andflows southward (supporting informa- tion Figure S2). Antarctic Bottom Water (AABW) contributes to deep ocean waters at depths below 4,000 m and also passes through RFZ on itsflow north. A clear distinction between NADW and AABW in the Angola Basin is not possible due to strong vertical mixing that occurs in the RFZ (Stramma & England, 1999). The“unaltered”body of AABW advected from the Southern Ocean characterized by low tempera- tures and salinity and high nutrient and O2concentrations (Figures 1 and S3), as sampled at station TM38 profile (Figure S2), is observed in the northern Cape Basin south of the Walvis Ridge, which acts as a physical barrier to the southwardflowing NADW‐AABW mixture.
2.2. Sampling and Analytical Methods
Seven vertical profiles and six surface water samples (3 m depth) were collected in the Angola Basin during the GA‐08 cruise that took place in the period between 22 November and 27 December 2015 (Figure 2).
Sampling of vertical profiles was carried out using a trace metal clean CTD (Conductivity, temperature, depth) sensor (Seabird) and rosette equipped with GO‐FLO (Ocean Test Equipment) bottles, whereas sur- face samples were collected using a towed FISH system. Immediately after collection, the samples werefil- tered through 0.2 μm Acropack Supor (Pall Corp.) cartridges, transferred into 1 to 10 L high density polyethylene (HDPE, ThermoFisher, Nalgene) bottles and canisters (precleaned in hot acid) and acidified to pH 2 using 12 M ROMIL UpA‐grade HCl onboard the ship.
Temperature, salinity and dissolved O2were obtained with calibrated Seabird sensors. Unfiltered macronu- trient samples (PO4, NO3+ NO2, Si) were collected in acid cleaned polypropylene bottles and analyzed on board by segmentedflow injection analysis using a QUAATRO (Seal Analytical) autoanalyzer. The chroma- tographic separation of Cd was performed in a Class‐100 clean laboratory at Max Planck Institute for Chemistry. Briefly, samples were weighed and spiked with a106Cd‐108Cd double spike (see A.‐D. Schmitt et al., 2009), equilibrated for 24 hr and separated using two steps as detailed in Abouchami et al. (2011).
Figure 1.Cross sections of hydrographic parameters along the track of cruise GA08 and schematic subsurface circulation in the South Atlantic Ocean. The section of temperature (a), salinity (b), and O2(c) in the three top boxes is represented by the white dashed line on the map (d). In D, the thickness of the black lines is proportional to the volumeflow of the currents. The shaded area represents the region where the Angola oxygen deficient zone develops (O2concentration below 30% of saturation at 400 m depth). The vertical profiles and TOW‐FISH surface samples are displayed as colored dots and crosses, respectively. Acronyms refer to the northern (NSEC), equatorial (ESEC), central (CSEC), and southern (SSEC) branches of the South Equatorial Current (SEC); Equatorial Undercurrent (EUC); South Equatorial Undercurrent (SEUC); South Equatorial Countercurrent (SECC); Benguela Coastal Current (BCC); North Brazil Undercurrent (NBUC). The Angola‐Benguela Front (ABF) marks the northern boundary of Benguela Current influence. The schematic circulation pattern is adapted from Stramma and England (1999).
Cadmium isotope ratios were measured by thermal ionization mass spectrometry using a Triton (ThermoFisher) instrument. Raw data were corrected for instrumental mass bias using a double‐spike reduction algorithm and assuming an exponential fractionation law (see A.‐D. Schmitt et al., 2009).
Cadmium concentrations were determined by isotope dilution using the method described in Xie et al.
(2015) with a reproducibility better than 1%. For the FISH samples, the chemical separation of Cd follows the method described by Xie et al. (2017). The 112Cd/110Cd isotopic ratios were measured and are expressed asε112/110Cd relative to NIST SRM‐3108:
ε112110Cd¼
110Cd
112Cd
NIST SRM 3108
110Cd
112Cd
sample
−1
!
×10;000 (1)
The data are listed in Tables S1–S3 and in thefigures in the de facto current conventionalδ114Cd notation (in parts per thousand,‰) using the conversion factor of 0.2000425 reported by Abouchami et al. (2013).
Repeated analyses of the NIST SRM‐3108 international standard yielded a110Cd/112Cd ratio of 0.520120 ± 0.000014 (2σ,n= 66,δ114Cd = 0.00 ± 0.05‰), in agreement with previous studies carried out in the same laboratory (W. Abouchami et al., 2011; D. J. Janssen et al., 2017; R. C. Xie et al., 2017). The long‐term external reproducibility of Cd isotope composition, based onfive replicates of seawater samples previously published (W. Abouchami et al., 2011; W. Abouchami et al., 2014), is ±0.04‰(see Table S2). The procedural blanks performed on 1, 4 and 10 L volumes of de‐ionized water (Milli‐Q, Merck Millipore) were 4.2, 5.8 and 2.3 pg Cd, respectively, and have a negligible impact on Cd isotopic compositions (Table S2).
3. Results
3.1. Distribution of Cadmium Concentrations andδ114Cd in the Angola Basin
Cadmium concentrations and isotope compositions measured on seven vertical profiles and corresponding surface water samples are plotted in Figure 3 and show distribution patterns similar to those observed else- where in the Atlantic Ocean (W. Abouchami et al., 2014; Conway & John, 2015b; R. C. Xie et al., 2018; R. C.
Xie et al., 2017). Depth profiles of Cd and PO4 concentrations exhibit strong similarities (Figure S4).
Interestingly, the Cd/PO4ratio varies slightly between water masses (Figure 4) with lower values (0.225– 0.243 nmol/μmol) for NADW than those of Southern Ocean‐derived water masses (0.244–0.315 Figure 2.Sampling map of GEOTRACES cruises in the South and tropical Atlantic showing stations for which Cd isotope data are available. The O2concentration at 400 m depth is displayed to identify the maximum extent of the Mauritanian and Angola Basin ODZs. Dots refer to vertical profile stations, whereas black crosses denote surface water samples.
The O2distribution is based on World Ocean Atlas 2013 data. The plot was produced with Ocean Data View software (R.
Schlitzer, 2018).
nmol/μmol for AABW and 0.268–0.308 nmol/μmol for AAIW), in agreement with previous observations in the Atlantic (W. Abouchami et al., 2014; O. Baars et al., 2014; R. Middag et al., 2018; P. Quay et al., 2015). The data display an exponential Cd depletion (down to 0.2 pmol/L at TM 32) in the upper 200 m of surface waters, which is stronger in the southern part of the basin (TM 32 to TM 42). The heaviest δ114Cd signatures are measured at around 100–200 m depth in each profile. Lighter and more variable Cd isotope signatures are found at stations (TM 35, 38, and 42) located south of station TM 32, compared with those (TM 21, 24, and 28) inside the perimeter of the Angola ODZ.
As expected, the surface FISH samples are strongly Cd depleted (0.001–0.006 pmol/L) withδ114Cd ranging from−0.04‰to 1.02‰, in line with published data (R. C. Xie et al., 2017, 2018) from the western part of the Figure 3.Depth profiles of Cd concentrations and isotope compositions in the Angola Basin. The FISH samples (diamonds) were not strictly obtained at the same locations as the vertical profiles, but each FISH sample data point was associated in thisfigure to the nearest vertical profile. The color codings of the station locations are shown on the map (left bottom). Error bars for Cd concentrations andδ114Cd are smaller than symbol size, unless visible.
South Atlantic (see Figure 6b). Extremely heavy Cd isotopic compositions withδ114Cd up to 5‰as reported in the North Atlantic transect (Conway & John, 2015b), are not observed in our data set.
The tongue of low salinity and Cd‐enriched AAIW is located between 500 and 1,300 m depth in the northern part of the transect and deepens to 800 to 2,100 m depth in the southern part of the basin (Figure 4) The δ114Cd ranges from 0.32‰and 0.51‰, in agreement with the isotope signature of AAIW (δ114Cd of 0.45 ± 0.08‰) based on literature data compiled by Xie et al. (2017). Below, NADW is characterized by a maximum extent of 2,500 m at stations TM 28 and TM 32 and lower Cd concentrations than those of AAIW, whereby the values increase southward from 0.31 to 0.45 nmol/L, reflecting progressive mixing and dilution with AABW within the RFZ. The associatedδ114Cd ranges from 0.22‰to 0.51‰with heavier values found in the north (TM 21 and TM 24). The slight increase in Cd concentrations at the bottom of TM 21 and TM 24 (Figure 4) can be attributed to a stronger proportion of AABW relative to NADW in this northern part Figure 4.Cross section of interpolated Cd/PO4ratio (4a), Cd concentrations (4b), andδ114Cd (4c) along the section shown in Figure 1. The acronyms AAIW, NADW, and AABW refer to Antarctic Intermediate Water, North Atlantic Deep Water, and Antarctic Bottom Water, respectively. The plot has been realized with the Ocean Data View software (R. Schlitzer, 2018).
of the basin (Figure S2, Stramma & England, 1999). The higher Cd con- centration and lowerδ114Cd measured at depth at the station TM 38 pro- file reflects the presence of“pure”, unaltered AABW corresponding to the southern branch of AABWflow into the south Atlantic (see Figure S2).
4. Discussion
4.1. Cadmium Cycling in Deep Waters: Dominant Control by Water Mass Mixing
The deepwater distributions of Cd concentrations and isotopic composi- tions are mainly controlled by mixing between water masses with pre- formed signals (W. Abouchami et al., 2014; R. C. Xie et al., 2017). The bilinear relationship between Cd and PO4has recently been interpreted as reflecting dominantly water mass mixing whereby only 10–30% of the total Cd can be accounted for by particle regeneration following sinking (R. Middag et al., 2018). Likewise, the Cd isotope distribution in Angola Basin deepwater shown in Figure 4 appears to be largely governed by water mass mixing with superimposed influence from regeneration of sinking organic particles.
Following the methodology of Middag et al. (2018), we use an extended Optimum Multiparameter Model (e‐OMP) (Karstensen & Tomczak, 1998) to,first, infer the relative importance of water mass mixing and remineralization processes in the Angola Basin on Cd concentrations andδ114Cd, and second, determine the respective proportions of the three main water mass components—AABW, NADW, and AAIW. These are defined, according to literature and property‐property plots, by their tem- perature, salinity, and oxygen content as well as silicate, phosphate, and nitrate concentrations (see Table S3). The remineralization of organic par- ticles is also considered in this model and will mostly occur in the depth range of AAIW (500–1,300 m depth). The extent of the remineralization process is expressed as an oxygen deficit (DO2) as in Middag et al.
(2018). Practically, the DO2 deficit value is the difference between the O2concentration determined solely by conservative mixing between two or three water masses and the observed O2 concentrations. Remineralization ratios ΔP:ΔN:ΔO2 of 1:16:170 were chosen following Anderson and Sarmiento (1994), whereasΔSi:ΔO2, even if variable vertically, wasfixed at 1:34 following Middag et al. (2018). The relative weight of each input parameter was calibrated to obtain a minimum data residue after thefit. After model processing, calculated Cd concentrations were determined as
Cdcalc¼fAABWCdAABWþfNADWCdNADWþfAAIWCdAAIWþDO2× Cdð :O2Þremin (2) withfand Cd corresponding to the proportion and Cd concentrations of AABW, AAIW, and NADW in the mixing, respectively. The endmember Cd concentrations used are those reported by Xie et al. (2017) and Middag et al. (2018) (Table S3). The (Cd:O2) remineralization ratio of 1.5:1, obtained after optimization of the calculated versus observed Cdfit (Figure S5a), range between the values reported by Middag et al.
(2018) (Cd:O2of 1.25:1) and those of Roshan and Wu (2015) (Cd:O2of 2:1). Theδ114Cd of regenerated Cd is still poorly constrained in the literature and is expected to be close to that of AAIW (D. J. Janssen et al., 2019; M. Sieber et al., 2018). The calculatedδ114Cd is thus only based on conservative mixing between the water masses in question, namely,
Cdcalcδ114Cdcalc¼fAABWCdAABWδ114CdAABWþfNADWCdNADWδ114CdNADWþfAAIWCdAAIWδ114CdAAIW (3) The Cd concentrations and δ114Cd of the NADW, AABW, and AAIW water mass endmembers were obtained from the literature (W. Abouchami et al., 2014; O. Baars et al., 2014; R. Middag et al., 2018; R. C.
Xie et al., 2017) and are reported in Table S3. The AABW is Cd‐rich (Cd = 0.78 nmol/kg) with light Figure 5.Conservative mixing ofδ114Cd in the deep Angola Basin (>750 m
depth). The proportion of NADW in the mixing is calculated using the e‐ OMP model, whereas the end‐memberδ114Cd was obtained from the lit- erature (W. Abouchami et al., 2014; R. C. Xie et al., 2017; Z. Xue et al., 2013).
The samples controlled by binary mixing between NADW and AABW or between NADW and AAIW are displayed by dots and squares, respectively.
Diamonds represent samples impacted by contributions from all three water masses.
δ114Cd (0.25 ± 0.04‰) as it is formed by subduction of Circumpolar Deep Water (CDW), for which Cd con- sumption is incomplete (W. Abouchami et al., 2014; Z. Xue et al., 2013). A small portion of this Cd‐rich upwelled Circumpolar Deep Water is also delivered to the surface andflows northward contributing to AAIW, which is characterized by comparatively moderate Cd concentration (Cd = 0.53 nmol/kg) and hea- vierδ114Cd (0.45 ± 0.08‰) due to higher biological Cd consumption. Finally, theδ114Cd signature of Cd‐
poor NADW (Cd = 0.215 nmol/kg) is heavy (0.42 ± 0.10‰) and mainly controlled by the mixture of waters of North Atlantic and Arctic origin and Southern Ocean origin (namely, AAIW) (M. Lambelet et al., 2013; S.
Ripperger et al., 2007; R. C. Xie et al., 2017).
The model was applied only for depths below 750 m based upon three lines of argumentation. First, the Angola Basin ODZ lies between 200 and 600 m depth. As CdS precipitation is expected in this zone, the mea- sured Cd concentrations andδ114Cd in the ODZ will be the result of conservative mixing of a regenerated Cd and of a CdS‐sequestered component. Second, the physical and chemical characteristics of subsurface waters in the Angola Basin are poorly constrained since they are strongly affected by biological cycling. Third, the remineralized Cd/PO4ratio was recently shown to vary in the top 700 m of an ETSP transect (SRoshan et al., 2017), making it difficult to quantify the proportion of regenerated Cd in the upper 700 m of the water column.
The proportion of each water mass involved in the mixing and the importance of remineralization along the section defined in Figure 1 are illustrated in Figure S6. The proportion of remineralized Cd accounts for approximately 30% and 10% of the total Cd below 700 and 2,000 m depth, respectively (Figure S5b), support- ing a predominant water mass mixing control on the deepwater Cd isotope signature. The measuredδ114Cd for samples below 700 m depth is fully consistent with mixing (Figures 5 and S7) between AABW and NADW (dots); AAIW and NADW (squares); and NADW, AAIW, and AABW (diamonds). Interestingly, the addition of remineralized Cd in the 700 to 1,300 m depth range does not seem to induce drastic changes in theδ114Cd signature of AAIW. Based on the measured values ofδ114Cd (0.6–0.8‰) in surface waters (Figure 6a), and assuming a Cd isotope fractionation factorα114/110Cd of 1.0005 between seawater and par- ticles (R. C. Xie et al., 2017), the isotope signature of the particulate Cd released by remineralization can be constrained to 0.36‰to 0.56‰. Since remineralized Cd does not represent more than 30% of the total Cd— thus inducing a maximum shift of 0.06–0.08‰—its effects will not be significant for the deepwater Cd iso- tope signature. A similar conclusion was reached in the Southwest Pacific, where the delivered reminera- lized Cd was found to have a Cd isotope signature close to that measured in AAIW thereby accounting for the stability of equatorial AAIWδ114Cd along the transect (M. Sieber et al., 2018).
The relative stability of Cd cycling in subsurface waters is also reflected by the distribution of Cd concentra- tions. Indeed, the bestfit for the e‐OMP model is obtained with a remineralization Cd/PO4ratio of 0.255, which is in the range of measured Cd/PO4ratio in AAIW (Cd/PO4= 0.22–0.32, O Baars et al., 2014; P. A.
Yeats et al., 1995; this study) that can be considered as the main source of Cd and PO4to the surface waters.
This constant remineralized Cd/PO4ratio is also in line with that reported by Roshan and Wu (2015) (Cd/
PO4= 0.262) to model the Cd‐PO4relationship below 300 m depth in the North Atlantic or with the rela- tively stable regenerated Cd/PO4calculated for depth below 700 m in the ETSP ODZ, where regenerated Cd is the main source of dissolved Cd (S. Roshan et al., 2017). Thisfinding contrasts, however, with the varia- bility of Cd/PO4ratio and associatedδ114Cd of regenerated organic material observed in particles in the upper water column, which has been explained by differential remineralization efficiencies of“soft”and
“protected”sinking particles (O. Baars et al., 2014; D. J. Janssen et al., 2019; Wu & Roshan, 2015).
In summary, even if a strong surface Cd and PO4depletion occurs in the Angola Basin (Figure 3), the simi- larity of Cd/PO4ratios of AAIW‐sourced water and remineralized materials below 700 m depth at all stations is consistent with uniform subsurface cycling, as has been assumed in the South Atlantic (R. Middag et al., 2018) and South Pacific (M. Sieber et al., 2018). Nevertheless, studies focusing on the biogeochemical cycling of Cd in the surface layer are needed to evaluate the validity of this hypothesis.
4.2. Cd Cycling in the Surface Waters: What is the Controlling Factor?
The surface water samples from the Angola Basin do not exhibitδ114Cd higher than 1.02‰, which is similar to results of recent Cd isotope studies in the South Atlantic and tropical Atlantic Ocean (R. C. Xie et al., 2017, 2018) as well as the Pacific Ocean (D. J. Janssen et al., 2017; M. Sieber et al., 2018; R. C. Xie et al., 2019). This
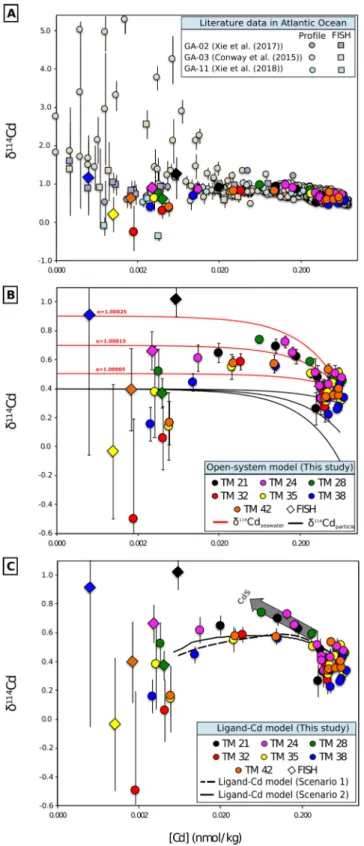
Figure 6.Cadmium isotope systematics in the Atlantic Ocean. (a) Compilation of published Atlantic Ocean Cd isotope data (Conway & John, 2015b; R. C. Xie et al., 2017, 2018; this study). The data from vertical profiles (dots) and surface (FISH, squares for the literature data and diamonds for this study) samples analyzed in this study are included in the threefigures. The color of FISH sample symbol is associated with the color of the closest vertical profile. (b) The red and black lines refer to the evolution of modeled Cd concentrations and isotope signatures in seawater and particles, respectively. Theα114/110values refer to the fractionation operating between seawater and particles. (c) The black straight and dashed lines depict the Cd‐ligand model output for the two tested scenarios. In b and c, the initial conditions are a Cd concentration and aδ114Cd in seawater of 0.6 nmol/L and 0.40‰, respectively, in agreement with the values observed at 900 m depth, the location of the maximum remineralization zone within AAIW.
contrasts with the heavyδ114Cd (up to 5‰) observed in the upper 100 m layer in the North Atlantic (Conway
& John, 2015b) and North Pacific (S. Ripperger et al., 2007) (Figure 6a). The lack of highly fractionated Cd isotope signatures and relatively homogeneous surfaceδ114Cd has been attributed to either diffusion under supply‐limited conditions with respect to phytoplankton uptake (M. Gault‐Ringold et al., 2012; E. George et al., 2019), or to an open steady‐state system or Cd complexation by organic ligands (R. C. Xie et al., 2017). The supply‐limited model can possibly explain the quasi‐constantδ114Cd found in surface waters of the Angola Basin. In the surface ocean, inorganic Cd concentrations will be lower than 1 pmol/L, the defined threshold of a supply‐limited regime (F. M. M. Morel, 2008), as ligand complexed Cd is the dominant species of dissolved Cd.
Our data can also be described in terms of a steady‐state model with anα114=110solution−particlevarying from 1.0001 to 1.0005 (Figure 6b). However, both models cannot account straightforwardly for the low δ114Cd of Cd‐ depleted samples at stations TM32 to TM42. The evolution of Cd concentrations and isotopes in the subsur- face Angola Basin can, however, be reproduced using a combination of an open steady‐state system and a Cd‐ligand complexation model as detailed in the supporting information (Text S1). Briefly, the decrease in total Cd (CdT) concentrations from 900 m to the surface is assumed to affect mostly the available inorganic Cd pool (hereafter Cd′) within an open steady‐state system as described by Xie et al. (2017). In our model, Cd is removed with decreasing depth in a hundred incremental steps over the whole depth profile; 1% of CdT(6 pmol/L) is removed in 1% of the total depth, that is, 9 m. After each incremental removal of Cd′, we calculate the proportion of CdLthat must be transferred to the Cd′pool to satisfy the thermodynamic equilibrium between Cd′and the ligand‐bound Cd (CdLhereafter) species in solution. Cadmium complexation or deso- rption from organic ligands is not expected to induce an isotope fractionation as deduced from data obtained during degradation experiments ofD. tertiolecta(John & Conway, 2014). Thus, at the initial stage at 900 m depth, Cd′and CdLhave a similarδ114Cd of 0.40‰, which corresponds to the average value observed in the range 700–900 m depth in our vertical profiles.
The removal of Cd′in an open system at steady state is associated with an isotope fractionation factor ofα114/
110Cd of 1.0005 between solution and particles, as in Xie et al. (2017), enriching the remaining dissolved Cd in heavy isotopes. This fractionation factor is of a similar magnitude to that observed in the 100–700 m depth range in the northeast and northwest Pacific between particles and seawater where an offset of 0.6‰to 1.0‰ between light Cd in particles and heavy Cd in solution was measured (D. J. Janssen et al., 2019; S.‐C. Yang et al., 2018). Janssen et al. (2019) showed that the Cd isotope fractionation associated with Cd uptake by phy- toplankton in the photic zone is limited and the shallow remineralization of 90% of organic particles with heavy Cd isotope composition results in a downward export of more refractory particles with lighter δ114Cd. Thefinal transfer of dissolved Cd from CdLto the Cd′pool to balance the thermodynamic equili- brium in solution induces a buffering of the heavy dissolvedδ114CdT asδ114CdLof the Cd‐ligand pool remains stable at 0.40‰.
Two different scenarios were tested by varying the concentration and complexation constant of the Cd‐ specific organic ligands on the basis of previous studies (Bruland, 1992; Baars, unpublished data). The results of the open‐system ligand‐bound Cd combined model for both scenarios are illustrated in Figure 6c and agree reasonably well with the evolution of Cd systematics in our study region, especially at low Cd concen- trations. The simulation does not apply for Cd concentrations lower than 4 pmol/L which are typically found in the top 10–20 m surface waters where other processes, such as biological uptake, sorption on organic par- ticles, a supply‐limited regime, or shallow remineralization, may act separately or together to complicate the behavior of the system.
In summary, the Cd isotope systematics in the subsurface ocean can be explained best by combining the open‐system model and the buffering role played by Cd‐ligand complexation. Additionally, this simulation shows that the samples located inside the ODZ are offset from the main trend in Figure 6c, with more ele- vatedδ114Cd signatures than expected, hinting at the involvement of additional processes. We will argue below that this is most likely CdS precipitation.
4.3. Occurrence of Cadmium Sulfide Precipitates in the Angola Basin ODZ
The potential role of cadmium sulfide precipitates in Cd isotope fractionation in ODZs wasfirst proposed by Janssen et al. (2014) based on (1) the observation of a Cd depletion relative to PO4combined with (2) an
enrichment in heavy Cd isotopes in the dissolved pool, alongside (3) an enrichment in particulate Cd relative to PO4. The occurrence of particu- late Ba in the Mauritanian ODZ due to barite precipitation supports the CdS hypothesis given that these two species are known to precipitate in similar microenvironments (S. L. Bates et al., 2017; Conway & John, 2015b; T. J. Horner et al., 2015).
The available Cd‐PO4 data set for the Atlantic Ocean is plotted in Figure 7a and clearly shows a Cd depletion compared to PO4in O2defi- cient waters within the Mauritanian (Conway & John, 2015b) and Angola Basin ODZs (M. Waeles et al., 2013). To assess the degree of Cd depletion, if any, in our samples, the seawater profiles are subdi- vided according to their location within the ODZ (“inside” shown as red squares, TM21, TM24, and TM28) and outside the ODZ (“outside” shown as black dots, TM32, TM35, TM38, and TM42). It can be seen in Figure 7b that most of our samples plot close to the regression line defined by fully oxygenated Atlantic waters. However, all six low‐oxygen samples from within the ODZ between 200 and 600 m depth (Figure 7c) exhibit significant Cd depletions relative to PO4 and plot within the ODZfield area defined in Figure 7b.
The Cd* parameter (O. Baars et al., 2014; D. J. Janssen et al., 2014) has been used as a tracer of relative Cd depletion or excess and is defined as
Cd*¼Cdmeasured−ðCd=PO4Þdeep×PO4measured (4)
However, the Cd* notation, and especially the assumption of a given con- stant (Cd/PO4)deep, can be misleading due to the variability of Cd/PO4
ratios within the same water mass, in particular, in ODZs where CdS pre- cipitation may occur (R. Middag et al., 2018; R. C. Xie et al., 2019). This limits the utility of this tracer alone and requires inclusion of another independent parameter, as discussed by Xie et al. (2019). Following Conway and John (2015b), we combine Cd* values and δ114Cd signa- tures—a quasi‐conservative feature of water masses—which, unlike Cd and PO4concentrations, is unaffected by variable regeneration.
The identification of the occurrence of CdS precipitates is only unambig- uous if there is a significant shift ofδ114Cd toward heavier values asso- ciated with a pronounced negative Cd*, reflecting a strong Cd depletion largely exceeding that expected from the variability in the chosen (Cd/
PO4)deep ratios. To evaluate the effects of the latter on calculated Cd*
values, four different scenarios were considered whereby (Cd/PO4)deep
was inferred from (1) only samples below 700 m depth (n= 36); (2) sam- ples below 1,250 m depth (n = 25); (3) only samples resulting from NADW‐AABW mixing (n= 23), and (4) only mixtures of AAIW and NADW (n= 14). For Cases 1 to 4, (Cd/PO4)deepvaries between 0.264 ± 0.028 and 0.284 ± 0.019 and results in a total Cd* variation of only
±0.03. This variation is by far smaller than the uncertainty (10–11%) of the intrasample variability in the Cd/PO4ratio. This clearly demonstrates that the distinct Cd/PO4ratios of individual water masses cannot be solely responsible for generating the trend inδ114Cd vs Cd* seen in Figure 8.
Furthermore, the area studied is sufficiently far from the coast to not be influenced by inputs of PO4from the continental margin, as argued for the Amazon River plume in the Southwest Atlantic (R. C. Xie et al., 2018). The relationship betweenδ114Cd and Cd* shown in Figure 8 thus Figure 7.Cadmium‐phosphate relationship in the Atlantic Ocean. (a)
Compilation of Cd and PO4concentrations from the North Atlantic GA‐03 and GA‐11 transects within the Mauritanian ODZ area (Conway & John, 2015b; R. C. Xie et al., 2018), from the Congo‐Angola Biozaire 3 transect where the Angola Basin ODZ is located (M. Waeles et al., 2013) and from the GA‐02 transect, not affected by any ODZ (R. C. Xie et al., 2017). (b and c) Cd and PO4concentrations from this study. The samples from the seven profiles are distinguished as inside ODZ profiles (TM21, TM24, and TM28) or out- side ODZ profiles (TM32, TM35, TM38, and TM42). Thezaxis represents the O2concentrations (b) and the sampling depth (c) of the samples. The plot was realized with Ocean Data View software (R. Schlitzer, 2018).
most likely reflects the presence of CdS precipitates in the oxygen defi- cient waters of the Angola Basin.
As seen in Figure 8, samples located in the core of the ODZ show maxi- mum Cd depletion and are associated with the heaviestδ114Cd values—
features that are not observed for the samples outside the ODZ. In order to assess whether there is a causal relationship betweenδ114Cd enrich- ment and the presence of CdS precipitates, we calculate a theoretical δ114Cd value for a maximum Cd depletion in the water. This uses the Cd isotope fractionation factor recently determined experimentally for CdS precipitation in synthetic seawater (α114/110Cdsol‐CdS = 1.00032, D.
Guinoiseau et al., 2018). Theδ114Cd of the Cd‐depleted water is obtained from:
δ114Cd¼δ114Cdiniþ1;000
×ðfð1−α114=110Cdsol−CdSÞÞ−1;000 (5) whereδ114Cdiniis the initial value andfcorresponds to the proportion of dissolved remaining Cd.
Since CdS precipitation is expected to occur in the ODZ at depths occu- pied by AAIW, we adopted the mean Cd isotopic composition of AAIW (δ114Cd = 0.45 ± 0.08‰; Xie et al., 2017) forδ114Cdini, which is slightly heavier than that of local deepwater (δ114Cd = 0.37 ± 0.08‰).
The calculated values are in good agreement with the Cd isotope signa- tures measured within the ODZ (end of the gray arrow in Figure 8) indi- cating that CdS precipitation within sinking particles very likely occurs within the Angola Basin ODZ. Similar calculations performed on data obtained for the Mauritanian (Conway & John, 2015b) and the ETSP ODZ (S. G. John et al., 2017) agree well with the reportedδ114Cd‐Cd* relationship in these studies, suggesting that CdS is formed there as well (details can be found in D. Guinoiseau et al., 2018). We conclude that CdS precipitation may play a signifi- cant role in the biogeochemical cycling of Cd in ODZs worldwide and is thus of global rather than local importance. However, in the North Pacific ODZ, where conditions seema priorifavorable for CdS precipita- tion, there is no Cd isotopic evidence of such a process—namely no shift inδ114Cd has been observed in asso- ciation with more negative Cd* (D. J. Janssen et al., 2017). The analysis of particulateδ114Cd in the North Pacific ODZ indicates that the main process affecting Cd isotope systematics in this region is the mineraliza- tion of organic particulate matter, blurring any Cd*‐δ114Cd effects due to CdS precipitation (D. J. Janssen et al., 2019). Clearly, there are many factors influencing CdS precipitation within sinking particles and it should be a priority of future studies to better constrain the impact of this process on the global oceanic Cd cycling.
4.4. Implications of CdS Precipitation Processes in the Global Oceanic Cd Cycle
As discussed above, CdS precipitation is likely to occur in three distinct ODZs, namely, that off Mauritania, the ETSP, and the Angola Basin. In these systems, the formation of CdS reaches its maximum between 100 and 200 m water depth in the uppermost parts of the low‐oxygen layers (Figure 9a) and not necessarily at the depth of the O2minimum, which is located at 300–500 m water depth in the Mauritanian and Angola Basin ODZ (Figure 9b). Therefore, the O2depletion of seawater below a defined threshold is not the sole factor con- trolling the precipitation of CdS within the microenvironment of sinking biogenic particles but must also be influenced by locally favorable water column conditions.
A particle size‐resolved model developed by Bianchi et al. (2018) indeed shows that bacterial sulfate reduc- tion likely occurs at the transition between the oxycline and the ODZ (100–300 m depth) within >1 mm dia- meter particle aggregates that release H2S leading to the formation of the CdS precipitates. The depth profiles of particulate Cd and Cd/PO4generated by this model are in perfect agreement with observations from the Mauritanian ODZ (Conway & John, 2015b; D. J. Janssen et al., 2014). The model also suggests that the main oceanic ODZs—located in the Arabian Sea, South Pacific, the Angola Basin and ETSP—are locations of Figure 8.Shift of cadmium isotope compositions as a consequence of CdS
precipitation. The calculation of the theoretical Cd isotope shift associated with the Cd depletion induced by CdS precipitation is reported as a gray arrow. The black rectangle represents the samples from within the core of the ODZ. The samples from the seven profiles are subdivided into those inside the ODZ area (TM21, TM24, and TM28) and outside the ODZ area (TM32, TM35, TM38, and TM42). Thezaxis represents the O2concentra- tions of the samples. The plot was realized with this Ocean Data View soft- ware (R. Schlitzer, 2018).
intensive sulfate reduction, in agreement with the systematic evident in the distribution of Cd concentra- tions and its isotopes compiled and discussed by Guinoiseau et al. (2018). In contrast, the lack of evidence for CdS precipitation in the North Pacific ODZ—such as a strong Cd depletion or a shift ofδ114Cd (D. J.
Janssen et al., 2017)—might be explained by the absence of sulfate reduction which, according to the model of Bianchi et al. (2018), is a necessary precursor for CdS precipitation.
The key role played by sulfate reduction in CdS formation is also supported by biological evidence of an active sulfur cycle within the ODZ. A cryptic sulfur cycle has been proposed within the ETSP ODZ based on the identification of sulfide oxidizing and sulfate reducing bacterial strains that can account for one third of the organic carbon remineralization in ODZ environments (D. E. Canfield et al., 2010). Genomic sequen- cing shows maximum diversity near the upper boundary of the South Pacific ODZ where active S‐cycling groups likeChromatialesare observed (Beman & Carolan, 2013; M. T. Carolan et al., 2015). Likewise, sulfate‐reducing (DesulfosarcinaorDesulfofrigus) and sulfide‐oxidizing (RiftiaorCalyptogena) bacteria have been isolated in the Arabian Sea ODZ (B. M. Fuchs et al., 2005). Observations of trace metal enrichments, including Cd, relative to PO4in marine particles from the western part of the ETSP have been linked to the development of a heterotrophic population, in contrast to a mix of autotrophic and heterotrophic popu- lations in its eastern part (D. C. Ohnemus et al., 2017). These authors found (1) a peak of acid‐volatile sulfides that is used to quantity the monosulfides species (FeS, ZnS, NiS, and CdS) in thefirst 50 m of the ODZ, and (2) a Cd:AVS (acid‐volatile sulfides) abundance of 1:1 or less for the samples lying within the ODZ. However, particulate Cd is expected to be present as either organically bound Cd or CdS in the ODZ, and Cd would be the most susceptible trace metal to precipitate as sulphide based on its stability constant (logKCd(HS‐)= 9.13
± 0.02) for CdS precipitation (D. Guinoiseau et al., 2018). Therefore, the particulate Cd enrichment observed in this ODZ is most likely driven by CdS precipitation rather than only changes in ecological communities.
The role and importance of sulfide precipitates in the biogeochemical cycling of trace metals in oceanic ODZ are still not well constrained. The efficiency in sequestering oceanic Cd into oceanic sediments largely Figure 9.Depth of CdS precipitation within oceanic ODZs. (a) Evolution ofδ114Cd and Cd* in the three oceanic ODZ sec- tions where CdS precipitation has been proposed to occur (Conway & John, 2015b; D. J. Janssen et al., 2014; S. G. John et al., 2017). Only data with O2concentration below 150μmol/L and a water depth below 100 m were reported here to remove potential effects of biological uptake in surface waters. Thezaxis reflects the depth of the samples. (b) Vertical oxygen distribution in USGS 10 TM9 and TM10 profiles located in the core of the Mauritanian ODZ (Conway & John, 2015b) and in TM21 and TM24 profiles located in the Angola Basin ODZ. The maximum of CdS precipitation is assumed to occur when Cd* is the lowest andδ114Cd the highest (gray area). A decoupling between the CdS precipitation area and the O2concentration minimum (blue area) is clearly visible. The plot was realized with the Ocean Data View software (R.
Schlitzer, 2018).
depends on the extent of CdS oxidation in more oxygenated waters located between the ODZ and the sea floor. It is still unclear, for example, whether CdS remains“stable”under oxic conditions or“slowly”redis- solves due to oxidation. The Cdflux to the bottom sediment as CdS particles can be estimated assuming that CdS dissolution followsfirst‐order kinetics. The annual amount of CdS precipitated in the global ocean was recently determined by Bianchi et al. (2018) using their size‐resolved particle model (FCd = 1.4.109 molCd/yr). Since the dissolution rate of CdS in seawater (ksin day−1) is not experimentally known, we con- sidered a range ofksvalues based on data from different CdS oxidation experiments and on model parameter optimization reported in the literature (Figure S8). The usedksvalues were obtained from 15 and 24 hr dis- solution experiments of CdS particles in water (D. M. Di Toro et al., 1996; S. L. Simpson et al., 2000), from thermodynamic calculation of CdS particle dissolution in soil (J. P. Gustafsson, 2013) or by calculations based on analogous ZnS dissolution experiments (A. Voegelin et al., 2011, see Figure S8). The optimized ksvalues derived from the Bianchi et al. (2018) model are very high (ksof 0.15 and 0.33 day−1for the two optimized scenarios, respectively) compared to those from other experimental studies (ks from 0.01 to 0.094 day−1, D. M. Di Toro et al., 1996; J. P. Gustafsson, 2013; S. L. Simpson et al., 2000; A. Voegelin et al., 2011) and are disregarded here.
The velocity of sinking particles in seawater is highly variable depending on the shape, density, and size of organic particles (McDonnell & Buesseler, 2010). As CdS is expected to precipitate within coarse organic aggregates (>1 mm, D. Bianchi et al., 2018), we applied a range in sinking rates of 70 to 130 m day−1, based on various studies (Fowler & Knauer, 1986; Iversen & Ploug, 2010; McDonnell & Buesseler, 2010). This yields a settling time for CdS particles from the top of the ODZ to the seafloor of 29 to 54 days.
Combining settling times and dissolution rates, we estimate the annual CdSflux transferred to seafloor sedi- ments (average depth of 3,800 m) to range from 0.87 to 104 × 107mol/yr (Figure S8). The lower estimate is a nonnegligible sink compared to suboxic [0.03–2.3.107mol/yr, Morford & Emerson, 1999; Y. Rosenthal et al., 1995; A. van Geen et al., 1995) or anoxic (0.09–3.6.107mol/yr; S. H. Little et al., 2015; A. van Geen et al., 1995) sequestration Cdfluxes (Figure S8). The maximum estimate of 104 × 107mol/yr would constitute the main Cd removal mechanism for Cd in the oceans. Obviously, refining the dissolution constantksis paramount to better constrain thisflux and will be key to establish the oceanic mass balance of Cd at a global scale.
5. Conclusions
Our understanding of the biogeochemical cycling of Cd in the oceans has significantly improved over the past decade by the measurements of Cd isotopes and elemental data on both seawater and particles. In this study, we present new seawater Cd isotope data from the Angola Basin ODZ, one of the major upwelling sys- tems of the world's ocean. We show that at depth, water mass mixing is the main mechanism controlling deepwater Cd isotope signatures as already shown in other oceanic provinces. Near the surface, we modeled Cd isotope fractionation with an open system at steady state buffered by organic ligand complexation.
However, in the body of the ODZ, our data show the precipitation of CdS within the microenvironment of sinking biogenic particles. This conclusion, along with previous data, strongly supports the formation of CdS in most ODZ systems worldwide. Based on available particle settling times and CdS dissolution rates estimates, we conclude that CdS precipitation and export acts as a major sink for Cd in the ocean, even if the magnitude of thisflux is still very uncertain and worthy of more investigation. In addition to CdS export, the sequestration of Cd within suboxic and anoxic environments and at continental margins are also of importance even if the Cd isotope signatures associated with thesefluxes are still unknown. A quantitative sequestration of light Cd has recently been proposed by Janssen et al. (2019) to explain the shift in the parti- culateδ114Cd toward heavier values at depth. In contrast, it has been argued that Cd enrichment in bottom waters of the Peru Margin is due to oxidation of Cd released from continental margin sediments (R. C. Xie et al., 2019). Future studies will need to constrain the role and importance of margin sediments for the ocea- nic Cd mass balance, as recently shown to be the case for the marine Zn and Cu cycles (S. H. Little et al., 2016, 2017).
References
Abouchami, W., Galer, S. J. G., de Baar, H. J. W., Alderkamp, A. C., Middag, R., Laan, P., et al. (2011). Modulation of the Southern Ocean cadmium isotope signature by ocean circulation and primary productivity.Earth and Planetary Science Letters,305(1–2), 83–91. https://
doi.org/10.1016/j.epsl.2011.02.044 Acknowledgments
The authors deeply thank Christian Schlosser and Jan‐Lukas Menzel for sample collection during GA08 and for providing nutrient data. Reimund Jotter and Siegfried Herrmann are thanked for their technical assistance during the acquisition of the chemical and isotope analyses. The authors thank Oliver Baars for providing his unpublished Cd complexation constants on organic ligands determined in the ETSP ODZ. We are grateful to the Editors, Peter Raymond and Ben Twining, reviewer Tim Conway, and an anonymous reviewer for their helpful comments. All the data reported in this study can be found in the supporting informationfile associated with this manuscript and in the GEOTRACES International Data Assembly Centre (GDAC) (https://
www.bodc.ac.uk/geotraces/data/).