The Theory and Practice of Free Economic Zones:
A Case Study of Tianjin, People’s Republic of China
Submitted to the
Combined Faculties for the Natural Sciences and for Mathematics of the Ruprecht-Karls University of Heidelberg, Germany
for the Degree of Doctor of Natural Sciences
Submitted by Meng Guangwen
Tianjin / People’s Republic of China Oral Examination: 14/02/2003
The Theory and Practice of Free Economic Zones:
A Case Study of Tianjin, People’s Republic of China
Referees: Prof. Dr. Hans Gebhardt (Heidelberg) Prof. Dr. Paul Reuber (Münster)
To my Wife, my Son and my Mother
Preface
For several decades, Free Economic Zones (FEZs) have become a truly global economic phenomenon. As political tools and strategic measures FEZs have a great impact on the economic development and structural reform in both developed and developing countries, especially in China. Since 1986 I have been engaged in or been in charge of several studies on Tianjin’s regional development policy, urban and regional planning as well as FEZ’s planning. FEZ’s theory and practice, especially, the successful development of Tianjin Economic and Technological Development Area (TEDA), was one of my research interests during this period.
As a visiting scholar I began my research work under the guidance of Prof. Dr. Jürgen G.
Holnholz and Dr. Alfred Bittner at the Institute for Scientific Cooperation with Developing Countries / Tuebingen, and Prof. Dr. Hans Gebhardt, Prof. Dr. Gerd Kohlhepp, Prof. Dr.
Dieter Eberle and Dr. Joachim Vogt at the Department of Geography, University of Tuebingen in 1994. I have participated in several seminars about “regional planning” in Germany, and made several field trips for the studies of urban and regional planning, industrial development and free ports in Europe. In 1995, I decided to continue my study on FEZs in Germany because it was easier here to have access to the abundant literature on FEZ’s development and theory, and also to directly observe the development of FEZs in Europe, which would be beneficial for preparing an empirical study in TEDA. I am very glad to have the chance to write this dissertation under the guidance of Prof. Dr. Hans Gebhardt of the Department of Geography at the University of Heidelberg in 1996.
Although there were numerous difficulties, like, for example, the complex topic, no financial support, minding my baby, and the serious illness of my mother, I have finally finished my study at the end of 2002 with a lot of help. I am highly indebted to Prof. Dr. Hans Gebhardt for proposing the topic, for his ample support, guidance, and for his interest in this study. I am also grateful to Dr. Klaus Sachs for his many concrete constructive suggestions and amendments to this dissertation. I would like to acknowledge Dr. Markus Blumenschein for his help to draw four maps, Mr. Richard Szydlak for his amendments of six maps. Many thanks are also to Mr. James Kautt and Mr. Hans-Jörg Läpple for their help to improve the English of this dissertation based on my original stile, and to Dr. Hans-Joachim Rosner, Mr.
Martin Samain (University Tuebingen), Mr. Holger Köppe and Ms. Christina Brueckner (University Heidelberg), Mr. Thomas Mietling for their technological support. Moreover, I would like to thank Prof. Dr. Zhang Junfang, and Prof. Jia Yangjie (Department of Geography, Tianjin Normal University); Dr. Zhang Hongru, Mr. Wei Yunjiu and Mr. Dong Weizhong (Tianjin Port Free Trade Zone); Dr. Ma Mei, Mr. Fang Dahai, Ms. Zhangying and Ms. Sun Xuchung (Tianjin Economic and Development Area - TEDA) as well as the Policy Research Bureau and the German Office of TEDA for their information and material support.
Meng Guangwen, Tübingen, Feb. 2003
TABLE OF CONTENTS
Figures ... III Tables ... V Boxes ... VI Abbreviations ... VII
Introduction
... 1Part A: The Evolution of Free Economic Zones in the World Economy – a Systematic Approach
...5
1. World Economic Integration and Free Economic Zones ... 7
1.1. World Economic Integration ... 7
1.2. FEZs: A Necessary Step and Primary Stage of World Economic Integration ... 13
2. The Various Types of Free Economic Zones ... 17
2.1. Definition of FEZs ... 17
2.2. Typological Classification of Territorial FEZs ... 18
3. The Different Generations and the Structural Evolution of FEZs ... 25
3.1. Criteria of FEZ’s Evolution... 25
3.2. The 1st Generation of FEZs: Trade-Based FEZ from the late 16th Century to the 1940s ... 26
3.3. The 2nd and 3rd Generations of FEZs: Manufacture- and Service-Based FEZs from the late 1940s to the 1970s ... 29
3.4. The 4th and 5th Generations of FEZs: Science-Based FEZ and Comprehensive FEZ from the late 1970s to the late 1980s ... 35
3.5. The 6th Generation of FEZs: Cross-Border FEZ since the 1990s ... 41
3.6. The Structural and Spatial Evolutionary Model of FEZs ... 46
Part B: Free Economic Zones in China – Policy and Practice
... 554. China’s Economic Development in Review ... 57
4.1. China’s Economic Policies from 1949/50 to 1977 ... 58
4.2. China’s Economic Policies since 1978 ... 62
5. Evolution and Characteristics of China’s FEZs ... 75
5.1. Typologies of China’s FEZs ... 75
5.2. Evolution of Varied Types of China’s FEZs ... 81
5.3. Location Patterns of China’s FEZs ... 97
5.4. General Characteristics of Chinese FEZs ... 101
6. Experiences and Prospects after over 20 Years of FEZs in China ... 109
6.1. FEZ’s Roles in Chinese Economic Development and Structural Reform ... 109
6.2. The Environment Changes of Chinese FEZs ... 110
6.3. Transformation of China’s FEZs: Models, Problems and Prospects. ... 112
Part C: Free Economic Zones in Tianjin – Empirical Evidences
... 1217. The Economic and Urban Development of Tianjin and the Setup of TEDA ... 125
7.1. Evolution of Tianjin’s Economic and Urban Structure ... 125
7.2. Tianjin’s Regional Economic Development Strategy ... 132
7.3. The Establishment of Free Economic Zones in Tianjin ... 135
8. Analysis of TEDA’s Development ... 139
8.1. TEDA’s Development Policy and Objectives ... 139
8.2. Planning and Developing TEDA ... 140
8.3. TEDA’s Preferential Policy ... 143
8.4. TEDA’s Administration ... 145
8.5. Foreign Capital–Oriented Development ... 147
8.6. Industry–Oriented Development ... 148
8.7. Foreign Trade Development ... 153
9. Evaluation and Prospect of TEDA’s Development – Achievements, Problems and Conceptions ... 155
9.1. TEDA’s General Economic Development ... 155
9.2. TEDA’s Promoting Role on the National and Regional Level ... 156
9.3. Discussion of TEDA’s Development Policy and Objectives ... 162
9.4. Discussion of TEDA’s Development Model ... 164
9.5. Discussion of TEDA’s Preferential Policy and its Administration Structure ... 169
9.6. Discussion of TEDA’s Investment Promotion ... 172
9.7. Discussion of TEDA’s Industrial Development ... 175
9.8. Discussion of TEDA’s Exports ... 177
10. TEDA’s Evolution in Review and Prospect ... 181
10.1. Factors of TEDA’s Evolution ... 181
10.2. Classification of TEDA’s Evolutionary Stages ... 182
10.3. TEDA’s Evolutionary Stages and Prospects ... 186
11. TEDA’s Empirical Evidences for the Evolutionary Theory of World FEZs ... 193
11.1. TEDA’s Empirical Evidences for the Theory of Manufacture-based FEZs ... 193
11.2. The Factors of the Life-Cycle of FEZs based on the Experiences of Chinese FEZs and TEDA ... 195
11.3. Main Theories Related to the Evolution of FEZs ... 196
11.4. FEZ’s Growth Mechanism, Evolutionary Stages and their Features ... 197
12. References ... 203
13. Appendixes ... 211
13.1. TEDA’s Economic Indicators ... 211
13.2. Several Theories of Industrial Structures ... 212
13.3. Figures of TEDA’s Major Economic Indicators from 1984 to 2000 ... 215
Figures Part A
Fig. 1: Export Processing Zones in Less Developed Countries ...6
Fig. 2: The Types and Logical Relation of World Economic Integration ... 8
Fig. 3: The Mutual Relation between Classic and New Structural Types of Regional Economic and Political Integration ... 13
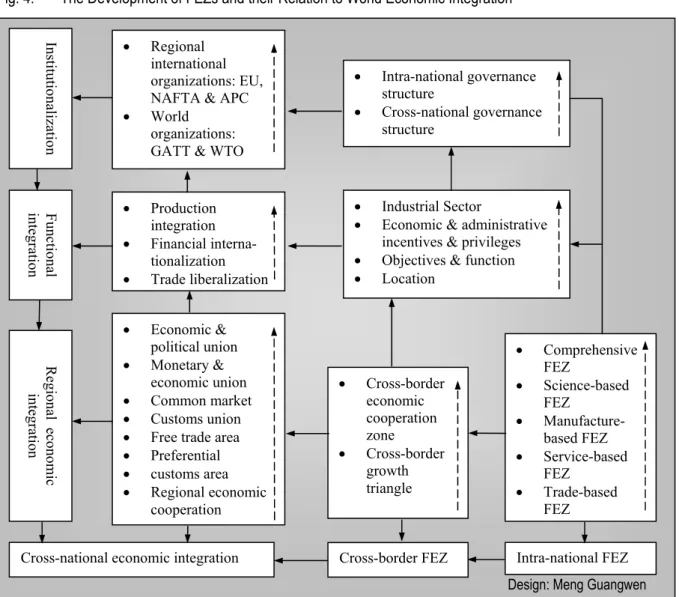
Fig. 4: The Development of FEZs and their Relation to World Economic Integration ... 15
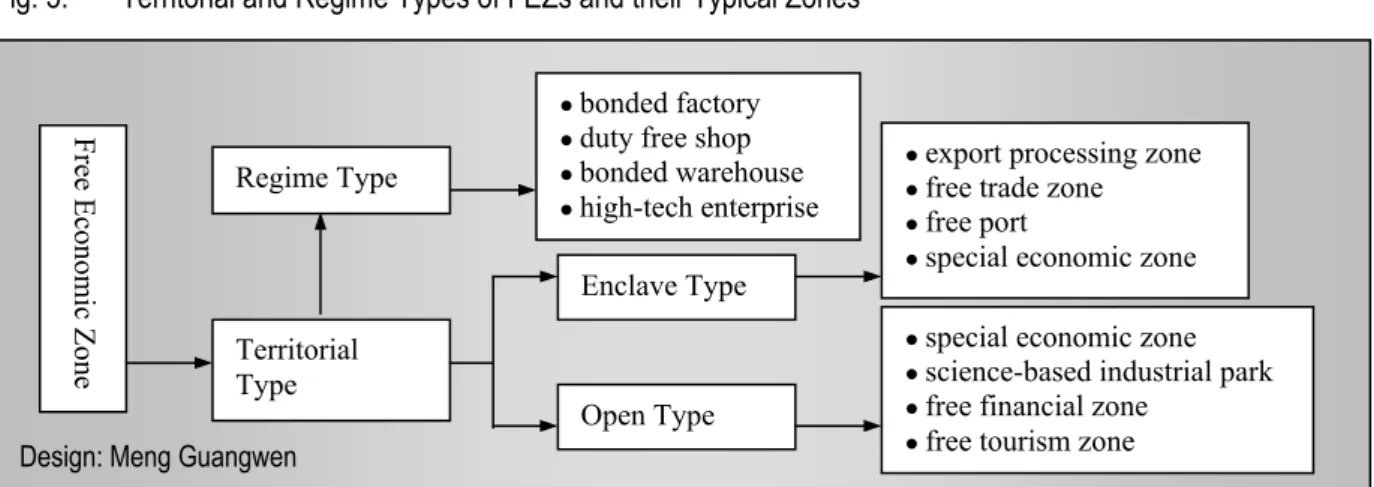
Fig. 5: Territorial and Regime Types of FEZs and their Typical Zones ... 20
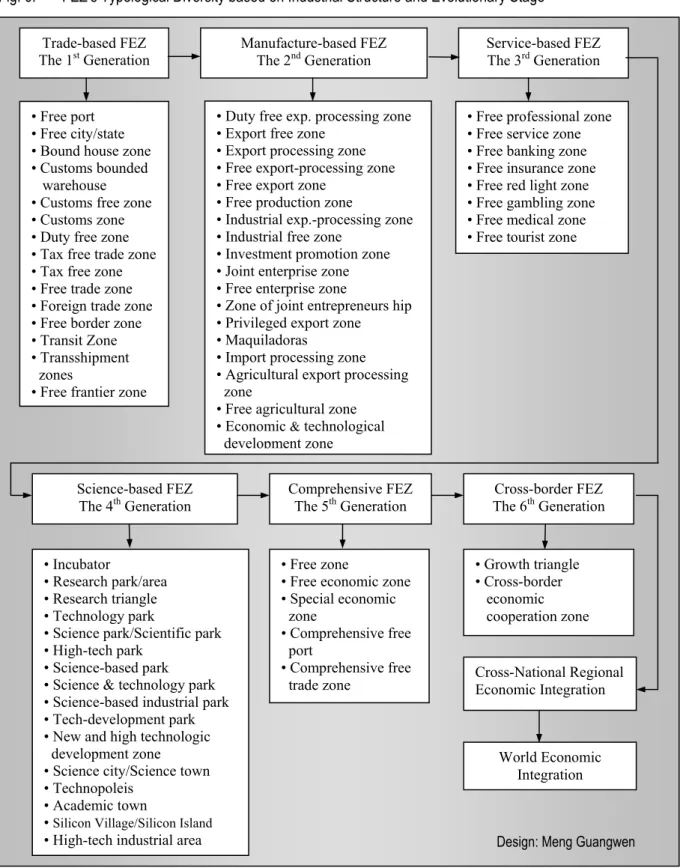
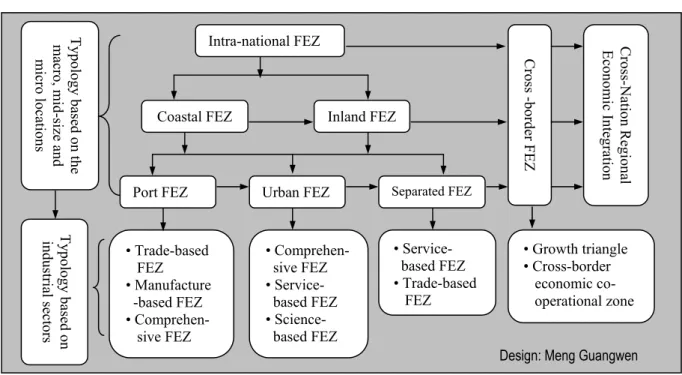
Fig. 6: FEZ’s Typological Diversity based on Industrial Structure and Evolutionary Stage ... 21
Fig. 7: FEZ’s Typological Diversity and Evolution based on Locations and Industrial Structure ... 22
Fig. 8: The General Typologies and Evolution of FEZs ... 23
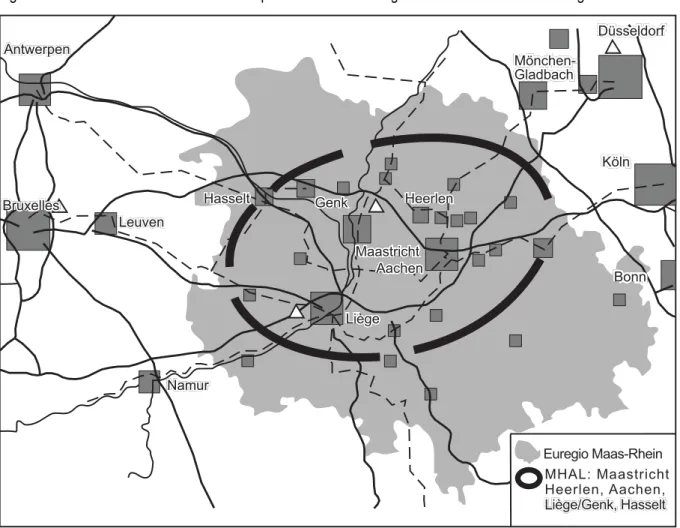
Fig. 9: The Cross-Border Economic Cooperation of Euregio Maas – Rhein and MHAL – Region ... 42
Fig. 10: The Geographical Locations of Several Cross-Border Growth Triangles in the Asia-Pacific Area ... 44
Fig. 11: The Evolutionary Model of FEZ’s Objectives ... 47
Fig. 12: The Evolutionary Model of FEZ’s Preferential Policy ... 48
Fig. 13: The Evolutionary Model of FEZ’s Administration ... 50
Fig. 14: The Evolutionary Model of FEZ’s Industrial Structure ... 51
Fig. 15: The Spatial Evolutionary Model of FEZs by Selected Periods, Geographical Areas and Nations... 52
Fig. 16: The Evolutionary Model of Free Economic Zone since the 1500s ... 54
Part B Fig. 17: Trade and Export Dependence of China (1952–1978) ... 58
Fig. 18: Trade and Export Dependence of China (1978–1998) ... 63
Fig. 19: Three Economic Regions of China (since the 1980s) ... 65
Fig. 20: The Gradient Development Model of China in the 1980s ... 67
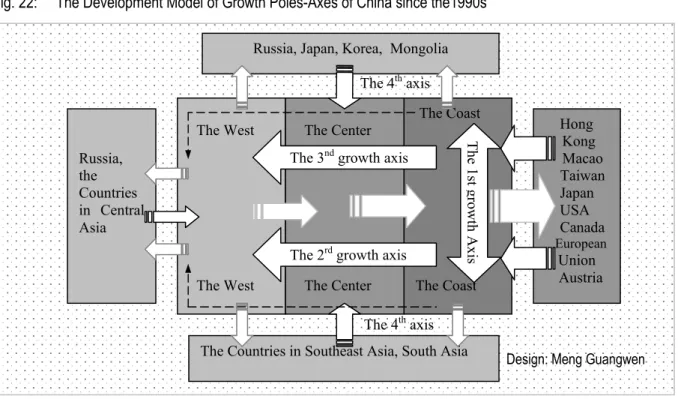
Fig. 21: The Four Growth Poles–Axes of China since the 1990s ... 68
Fig. 22: The Development Model of Growth Poles–Axes of China since the 1990s ... 69
Fig. 23: The Opening of Industrial Sectors of China since the 1980s ... 71
Fig. 24: The Regional Opening Process of China Since 1978 ... 73
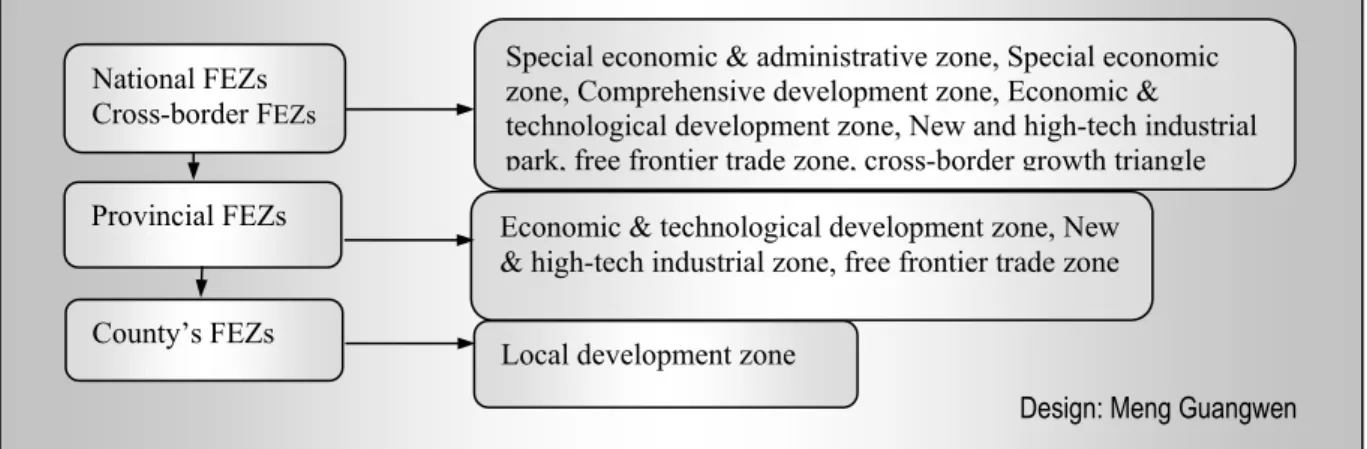
Fig. 25: Typologies of Chinese FEZs based on Governmental Levels and the Position in National Economic Development Strategy and Structural Reform ... 76
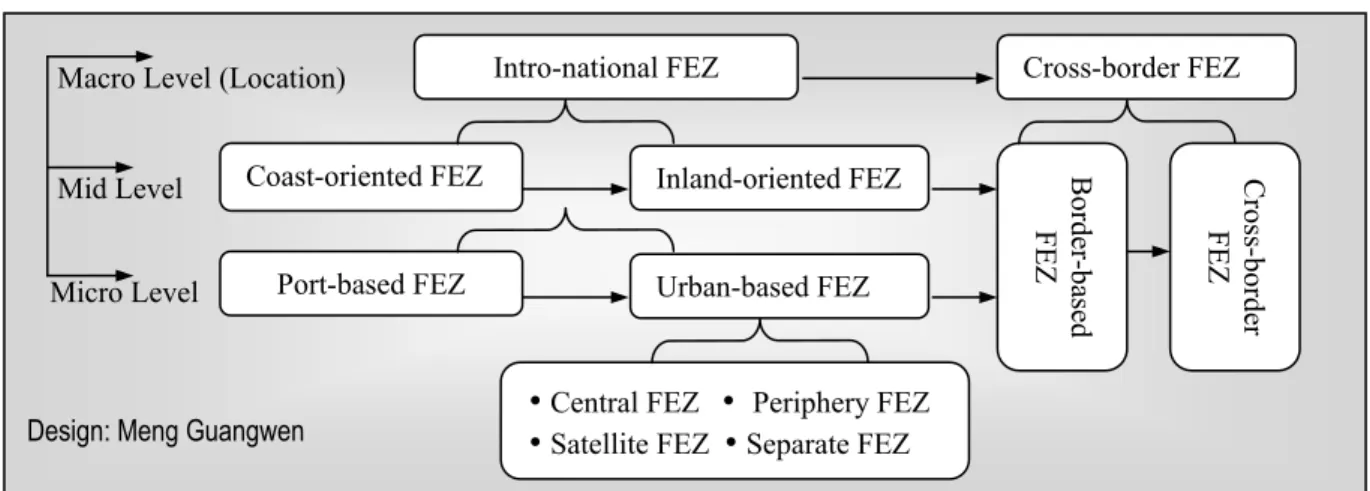
Fig. 26: Chinese FEZs based on Macro-, Mid- and Micro-Location Criteria ... 77
Fig. 27: Chinese FEZs based on Governance Structure ... 80
Fig. 28: Chinese FEZs and the typical Zones based on Industrial Structure and Macro-Location ... 80
Fig. 29: Geographical Location of SEZs, ETDZs and CDZs in China ... 82
Fig: 30: Geographical Location of New and High-Tech Industrial Parks in China ... 87
Fig. 31: Geographical Location of FTZs, CGTs and FFTZs in China ... 91
Fig. 32: The Models of FEZ’s Promotion to the Regional Economic Development ... 113
Fig. 33: The Model of Small-scale Circulatory Land Development of Chinese FEZs ... 115
Fig. 34: The Model of large-scale Land and Industrial Development of Chinese FEZs ... 115
Fig. 35: The Intra-National and Cross-Border Growth Triangles of China since the 1990s ... 118
Fig. 36: Chinese FEZ’s Development in Review and Prospect ... 119
Part C Fig. 37: The Administrative Division of Tianjin Municipality ... 126
Fig. 38: Urban Evolution of Tianjin Proper since Ming-Dynasty (1404) ... 129
Fig. 39: Tianjin Urban Structure and the Overall Planning of Tianjin Binhai New Area ... 131
Fig. 40: The First Development Axis of Beijing–Tianjin–Tanggu and the Second Development Axis of Tanggu–Hangu and Tanggu–Dagang ... 134
Fig. 41: Geographical Locations of Economic and Technological Development Zones and High-tech Industrial Parks in Tianjin ... 137
Fig. 42: Evolution of TEDA’s Development Models since 1984 ... 142
Fig. 43: The Structure of TEDA’s Administration (1984–the early 1990s) ... 145
Fig. 44: The Structure of TEDA’s Administration since the middle 1990s ... 146
Fig. 45: Evolution of TEDA's Secondary and Tertiary Industry (GDP) (1993–2000) ... 148
Fig. 46: The Model of Mutual Economic Links between TEDA and Tianjin since TEDA’s Establishment ... 161
Fig. 47: TEDA’s Model of Demonstration, Transformation and Promotion to Tianjin ... 162
Fig. 48: TEDA’s Development Policy, Objectives and their Evolutions ... 164
Fig. 49: TEDA’s Development Model and its Evolution since 1984 ... 169
Fig. 50: The Features and Transformation of TEDA’s Preferential Policy and Privilege since 1984 ... 170
Fig. 51: A Special Administrative Area as TEDA’s Governance Structure in the early 21st Century ... 172
Fig. 52: The Transformation of TEDA’s Industrial Structure since 1984 ... 177
Fig. 53: TEDA’s Development Based on the Average Value of Major Output Economic Indicators of TEDA (1986–2000) ... 183
Fig. 54: The Changing Curve of Annual Growth Rate of TEDA's Major Economic Output Indicators (1986–2000) ... 184
Fig. 55: The Changing Curve of Average Value and the Growth of Total Investment of TEDA (1985–2000) ... 185
Fig. 56: The Changing Curve of Average Value of 10 Major Economic Indicators of TEDA (1985–2000) and the Standard Curve ... 185
Fig. 57: The Changing Curve of Average Growth Rate of 10 Major Economic Indicators of TEDA (1987–2000) and the standard Curve ... 186
Fig. 58: TEDA’s Development Trend since the early 21st Century and the Spatial and Economic Linkages between TEDA, Binhai New Area, Tianjin Proper and Bohai Bay Rim ... 190
Fig. 59: TEDA’s Evolutionary Model and Mechanism from 1984 to the early 21st Century ... 191
Fig. 60: FEZ’s Economic Linkages with Domestic Economy and Rest of the World at the Starting Stage ... 198
Fig. 61: FEZ’s Economic Linkages with the Domestic Economy and the Rest of the World at the Growing Stage ... 199
Fig. 62: FEZ’s Economic Linkages with the Domestic Economy and the Rest of the World at the Flourishing Stage ... 200
Fig. 63: FEZ’s Evolution and the Three Trends at the Transitional Stage ... 201
Appendix: Fig. 1: General Evolution of Industrial Structures and the Relations between them ... 213
Fig. 2: Model of Pillar Industrial System ... 214
Fig. 3: Evolutionary Stage and the Features of Industrial Group ... 215
Fig. 4: GDP and Annual Growth Rate of TEDA (1986-2 000) ... 215
Fig. 5: TEDA’s Total Import and Export and Growth Rate (1900-2000) ... 216
Fig. 6: Total Export and Growth Rate of TEDA (1985-2000) ... 216
Fig. 7: Gross Industrial Output Value and Annual Growth Rate of TEDA (1986-2000) ... 216
Fig. 8: Per Capital GDP and Annual Growth Rate of TEDA (1986-2000) ... 217
Fig. 9: Employment and Annual Growth Rate of TEDA (1986-2000) ... 217
Fig. 10: Total Investment of Foreign. Hong Kong, Macao, Taiwan-funded Enterprises in TEDA ... 217
Fig. 11: Financial Revenue and Annual Growth Rate of TEDA (1986-2000) ... 218
Fig. 12: TEDA’s Registered Domestic Capital and its Annual Growth Rate (1986-2000) ... 218
Tables Part A
Tab. 1: The Structural Types and Symbols of World Regional Economic Integration ... 11
Tab. 2: Comparison of the Three Regional Economic Integrative Types ... 12
Tab. 3: The Differences and the Inherent Relations between FEZs and World REI ... 14
Tab. 4: The Typologies and Features of Science-Based Free Economic Zones ... 40
Part B Tab. 5: China’s Economic Development and Policies of 1950–1978 ... 61
Tab. 6: Population and Areas of the Three Economic Regions of China in 1990 ... 66
Tab. 7: The Comparative Difference of Per Capita National Income between the Coast and the Interior ... 66
Tab. 8: China’s FEZs based on the Micro Location Criteria and the typical Zones ... 78
Tab. 9: Establishment and Distribution of 35 Chinese National-Level ETDZs ... 85
Tab. 10: Establishment and Distribution of 53 Chinese National-Level NHIPs until 2001 ... 88
Tab. 11: Establishment and Distribution of 15 Chinese National-level FTZs until 2001 ... 90
Tab. 12: Distribution of 13 Chinese Free Frontier Trade Zones in 1992 ... 92
Tab. 13: The Comparison of Major Factors of China’s FEZs ... 96
Tab. 14: Location Factors and Principles of Chinese FEZs ... 98
Tab. 15: Distribution of National-Level FEZs in the “Three Regions” of China ... 98
Tab. 16: The Distance from the Central City of the 1st series of 14 National-Level ETDZs in the 1980s ... 100
Tab. 17: The Characteristics of Chinese FEZs by Comparison with the FEZs in DCs and LDCs ... 108
Part C Tab. 18: The Population and Urban Area of Tianjin Proper since the Min Dynasty (1404) ... 127
Tab. 19: Proportion (in %) of Pillar Industries in Tianjin’s GDP (1947–1978) ... 130
Tab. 20: Land Use Structure of Tianjin (1986) ... 132
Tab. 21: Area of TEDA’s Land Development, Land Charge and Investment in Fixed Assets and Infrastructure Investment (1985–2000) ... 141
Tab. 22: The Development and the Balance of Total Capital from Foreign Countries, Hong Kong, Macao, Taiwan and Total Domestic Registered Capital (1985–2000) ... 147
Tab. 23: TEDA’s Pillar Industries Based on the Gross Output Value of Industry (1987–1994) ... 150
Tab. 24: TEDA’s Pillar Industries Based on the Gross Industrial Output Value (1995–2000) ... 151
Tab. 25: Investment Structure of Enterprises Funded by Foreigners and Investors from Hong Kong, Macao & Taiwan over the Years by Industry (1984–1999) ... 152
Tab. 26: TEDA’s Export and Import (1986–2000) ... 154
Tab. 27: TEDA’s Major Economic Indicators and Their Annual Growth Rates (1986–2000) ... 156
Tab. 28: Proportion of the Major Economic Indicators of all 32 National ETDZs Country-wide and Proportion of TEDA’s Major Economic Indicators in all 32 National ETDZs in 1998 ... 157
Tab. 29: Proportion of TEDA’s Major Economic Indicators in Tianjin and Binhai New Area (1991–2000) ... 159
Tab. 30: TEDA’ Foreign Capital and its Proportion in Tianjin (1991–2000) ... 159
Tab. 31: TEDA’s Employment and Its Proportion in Tianjin (1991–2000) ... 160
Tab. 32: TEDA’s Urban Construction (1991–2001) ... 166
Tab. 33: TEDA’s Foreign and Domestic Investment (1985–2000) ... 173
Tab. 34: Average Investment Level of Foreign-Funded Enterprises in 10 Chinese Major ETDZs over the Years (1985–1994) ... 174
Tab. 35: TEDA’s Average Investment Level (1985–2000) ... 175
Tab. 36: TEDA’s Export Ratios of Industrial Products (1986–2000) ... 178
Tab. 37: TEDA’s Export Market (1987–2000) ... 179
Tab. 38: TEDA’s Total Average Values and Average Growth Rates of 10 Major Economic Indicators (1986–2000) ... 183
Tab. 39: The New Features of TEDA ... 194
Tab. 40: The New Conclusion of TEDA ... 194
Tab. 41: The New Factors of TEDA for Life-Cycle of FEZs ... 196
Tab. 42: FEZ’s Growth Mechanism, Evolutionary Stages and their Features ... 202
Appendix: Tab. 1: Evolution of TEDA’s Industrial Structure based on GDP (1993 – 2000) ... 211
Tab. 2: The Added Investment of Foreign Enterprises in TEDA ... 211
Tab. 2: The First 10 Home Countries and Regions of Investment in TEDA and the Rank Order (1985-2000) over the Years ... 212
Boxes Part A Box 1: The Key Features of Manufacture-based FEZs ... 35
Part B Box 2: Characteristics of Chinese SEZs in Detail ... 84
Box 3: Similarities and Differences between ETDZs and other Types of Chinese FEZs ... 85
Box 4: Similarities and Differences between NHIPs and other Types of Chinese FEZs ... 89
Box 5: Distinctions between SAEAs and SEZs ... 95
Box 6: Comparison between Bonded Warehouse Zones and Free Trade Zones ... 107
Abbreviations
APEC Asia-Pacific Economic Cooperation b billion
BNA Binhai New Area
BWZ bounded warehouse zone
CECZs cross-border economic cooperative zones
CDZs comprehensive development zones
CFEZs cross-border free economic zones
CGTs cross-border growth triangles
CIS company image system
CM common market
CU customs union
DCs developed countries
EC European Community
ECPBs export commodity production bases
ED export dependence
EEC European Economic Community
EFTA European Free Trade Area
EG economic globalization
EO export-orientation
EPZs export processing zones
EPU economic and political union
ETDZs economic and technological development zones ETZ entrepôt trade zone or free transit zone
FCs free cities
FEZs free economic zones
FFZs free financial zones
FFTZ free frontier trade zones
FGZs free gambling zones
FPs free ports
FTA free trade area
FTZs free trade zones
FYP Five Years Plan
GATT General Agreement on Tariffs and Trade
GIOV gross industrial output value
GLF Great Leap Forward
GTs growth triangles
HIDA Tianjin High-Tech Industrial Development Area
IS import substitution
LDCs less developed countries
LRs law and regulations
m million
MEU monetary and economic union
NAFTA North American Free Trade Area
NHIPs new and high-tech industrial parks
NIZHR New Industrial Zone in Lower Reaches of Haihe River
PCA preferential customs area
PEU political and economic union
PNA Pudong New Area
REC regional economic cooperation
RED regional economic development
REI regional economic integration
RI regional integration
SAEAs special administrative and economic zones
SEZs special economic zones
SPs science-based parks
SIPs science-based industrial parks
SNA Suzhou New Area
SOEs state-owned enterprises
TCs transnational corporations
TD trade dependence
TEDA Tianjin Economic and Technological Development Area
TFTZ Tianjin Free Trade Zone
Three Combinations combination of secondary and tertiary industry, national and international market, foreign and domestic capital
Three Orientations industry-, export- and foreign capital-orientations UNIDO United Nations Industrial Development Organization
WTO World Trade Organization
Areas with special economic privileges – like the right to raise lower taxes – have been established in various kinds since the 16th century. Until the 1960s, however, these Free Economic Zones (FEZs) only played a minor role in the world economy. Since then, a variety of new models has developed, and their importance has risen on a global scale. This is especially true for the FEZs in both developing countries, especially in the People’s Republic of China.
The establishment of FEZs is one of China’s most important steps towards liberalization of its economy and is a milestone for China’s integration into the world economy. It marks a deep structural reform because it put an end to the monopoly of planned economy and replaced it by a hybrid system which includes – mainly limited to the FEZs – a capitalist economy and socialist politics. The political system, however, has remained unchanged so far.
China’s closed economic policy, which was based on import substitution (IS), has been replaced by a policy of openness. This transformation included reforms of the macro economic management and of the functions of the government. Large areas and numerous industrial sectors, especially near the coast, were opened to foreign investors. Numerous preferential policies have been formulated in order to attract them. The first four FEZs - in China called Special Economic Zones (SEZ) - were set up in the coastal region of South China as an experiment, and spread from there to the North in the 1980s and from the coast region to the interior in the 1990s. Besides numerous regional and local FEZs, there are about 125 FEZs on the national level today, including five SEZs, 35 Economic and Technological Development Zones (ETDZs), two Comprehensive Development Zones (CDZs), 53 New and High-Tech Industrial Parks (NHIPS), 15 Free Trade Zones (FTZs), 13 Free Frontier Trade Zones (FFTZs), two Cross-Border Growth Triangles (CTGs,) and 13 Export Processing Zones (EPZs).1
As a new generation of Chinese Export Commodity Production Bases (ECPBs) and world FEZs, China’s FEZs have become the engines to promote economic development on a national and regional level. They have also become the base to provide necessary experiences to open policy, and structural reforms. FEZs are the keys to understand and explain China’s rapid and sustained economic growth, outwardly-oriented economic strategy, unbalanced regional policy (i.e. not all Chinese regions are treated the same way) and growing integration into the global economy since the 1980s.
The worldwide development of FEZs is tending towards a general model, although there still is a rich structure of different kinds of FEZs. Chinese FEZs have benefited from this development and from the experiences of other FEZs as well as it has, at least in parts, the other way round, enriched the theory and practices of world FEZs.
There are numerous theoretical and empirical studies on FEZs. The classic studies discussed trade creation and trade transfer in a cross-national “Free Economic Area”.2 However, the most studies focus narrowly on the economic effects and roles of EPZs and SEZs in developing and socialist countries.3 Several studies attempt to provide a theoretical
1 For discussion, see Wolfgang Taubmann (2001), “Wirtschaftliches Wachstum und räumliche Disparitäten in der VR China”, In: <<Geographische Rundschau>>, Heft 10
2 Viner, Jacob (1950), <<Customs Union Issue>>, New York, Carnegie Endowment for International Peace
3 Wall, D. (1976), “Export Processing Zones”, In: <<Journal of World Trade Law>>, No. 10, pp. 478-498
framework to analyze these economic effects, i.e., its benefits and costs, based on the standard
“2 x 2 x 2” Heck-Ohlin trade model for small countries.4 Others present a general theory of FEZs5 or they discuss their structural and spatial evolution.6 Generally speaking, these studies discussed the theory and practice of FEZs from various angles and provide important cornerstones to further studies. However, several questions have not been answered yet.
First, there still remains some notable linguistic and conceptual diffusion about the definition and typology of FEZs since a general typological classification has not advanced yet. Second, an indicators system to describe and analyze FEZs has not been developed. Third, most studies analyze the static economic effects, while only little consideration has been given to when, why, and how FEZs evolve under diverse economic, political, social-cultural and spatial conditions on different scales - international, national, regional and local.7 Fourth, the inherent relation between FEZs and the concept of regional economic integration (REI) has not been wholly discussed so that REI and FEZs look like two separate economic phenomena without any linkages (which is, of course, not the case).
Therefore, this study analyses both the development and the structure of FEZs in China as well as on an international level. In a further step, it evaluates the impact of FEZs in Tianjin, which was chosen as a case study, and tries to propose the future economic development of China on the regional and local level. Furthermore, Chinese FEZs have provided several empirical evidences for the revolution of a FEZ in general. The arguments of this dissertation are based on previous studies and on the recent development of FEZs in China.
In Part A, the world economic integration and its relation with FEZs will be firstly discussed in order to explain FEZ’s dominant role in the world economy and its development trend. A structural and spatial evolutionary model of FEZs on an international level will be developed based on a general definition, a factor system and a systematic typology of FEZs, which will improve the previous studies and provide a useful example for Chinese FEZs.
Besides numerous similarities with world FEZs, China’s FEZs have also special characteristics. Part B, therefore, focuses on the national and regional level. The necessity to
Spinanger, Dean (1984), “Objectives and Impact of Economic Activity Zones – Some Evidence from Asia”, In: <<Weltwirtschafliches Archiv>>, No. 120, pp. 64-89
Rabani, F. A. (et. al) (1983), “Economic and Social Impacts of Export Processing Zones in Asia: an Evolution”, In: <<Asian Productivity Organization>>, Tokyo
Warr, P. G. (1989), “Export Processing Zones: the Economic of Enclaves Manufacturing”, In: <<The International Bank for Reconstruction and Development>>, No. 1, Washington DC, pp. 65-88
UNCTC (1990), <<The Role of Free Economic Zones in the USSR and Eastern Europe>>, United Nations Bolz, Klaus, et al. (1990), <<Freihandels- und Sonderwirtschaftszone in Osteuropa und in der VR China>>, Verlage Weltarchiv GmbH, Hamburg
Busch, Berthold (1992), <<Sonderwirtschaftszonen als Instrument der System-Transformation>>, Deutscher Instituts-Verlage
4 Hamada, Koichi (1974), “An Economic Analysis of the Duty-Free Zone”, In: <<Journal of International Economics>>, No. 4, pp. 225-241
Hamilton, Carl and Svensson, Lars E.O. (1982), “On the Welfare Effects of A Duty-Free Zone”, In: <<Journal of International Economics>>, No. 13, pp. 45-64
5 Grubel, Herbert G. (1982), “Towards a Theory of Free Economic Zones>>, In: <<Review of World Economics>>, No. 118, pp. 39-61
Balasubramanyan, V. N. (1988), “Export Processing Zones in Developing Countries: Theory and Empirical Evidence”, In: <<Economic Development and International Trade>>, London: Macmillan, pp. 157-195
Chen, Xiangming (1995), “ The Evolution of Free Economic Zones and the Recent Development of Cross- National Growth Zones”, In: <<International Journal of Urban and Regional Research>>, Vol. 19, pp. 591-621
6 McCalla, Robert J, (1990), “The Geographical Spread of Free Zones Associated with Ports”, In:
<<Geoforum>>, Vol. 21, No. 1, Pergamon Press., Halifax, Canada
7 Chen, Xiangming (1995), “The Evolution of Free Economic Zones and the Recent Development of Cross- National Growth Zones”, In: <<International Journal of Urban and Regional Research>>, Vol. 19, pp. 591-621
establish FEZs in China can be best visualized by looking back to China’s economic and regional development policies since 1949/50, especially since 1978, when China’s FEZs became the major instrument to open China – or, to be more precise, small parts of China - to the world market. There, the varied types of China’s FEZs, their evolution and the disparities between them will be presented based on their roles in national open policy and structural reform, their dominant industrial sectors, preferential policies, governance structures, and location patterns. The general characteristics of China’s FEZs will be realized by a comparison with world FEZs. As a result, Part B also summarizes and discussed China’s FEZs with 20 years experiences and their development trend in the future.
There are only a few case studies that concentrate on the regional economic effects, problems and prospects of FEZs in China besides the publications that focus on SEZs in South China, which were the earliest FEZs of China. These SEZs have played, of course, a dominant role in China’s economic development since the late 1970s. Here, the first capitalistic structures in a socialistic centrally planned economy could be experienced and tried out. Since 1978, many other types of FEZs have occurred, including a large number of ETDZs and two CDZs, most of them located in the coastal region, only few in the interior. The ETDZs of the coastal regions have increasingly contributed to expand open policy and recover old coastal economic centers. One of the very successfully operating ETDZs is the Tianjin Economic and Technological Development Area – TEDA – located in Tianjin, the third largest city of China.
Until the 1990s, Tianjin’s economic position decreased due to the national balanced regional policy and to the open policy that started in South China. Following the success of TEDA and the comprehensive economic advantage, however, Tianjin has slowly grown out of the shadow of the close-by capital Beijing and gradually recovered its position as the third largest metropolis and economic center in North China since the 1990s. TEDA itself has become one of the leading ETDZs of China. There has been, however, no comprehensive empirical study so far, which has analyzed the successful model of TEDA, its economic and political impacts on Tianjin area and the national economy, and its theoretical significance for the evolution of FEZs in general. This shortcoming will be ended with the case study of TEDA presented in Part C of this dissertation. To do so, I will give a brief historical overview over Tianjin’s urban and economic development as well as over the development of the coastal region of the last hundred years. This will provide a background to understand the economic and political situation of TEDA’s establishment and evolution since 1984. Here TEDA’s achievement and problems until 2000 will be evaluated. Some proposals will follow this evaluation - for one thing to outline the further prospects of the TEDA, Tianjin and the coastal area, for another to endorse the model of the evolution of FEZs, which might not only be helpful to improve or adjust the structure of FEZs in China, but also around the whole world.
In order to realize these objectives, previous studies and investigations were carried out and published by the author between 1986 and 1993, when he was in charge of and engaged in several projects concerning the coastal economic development, Tianjin port and FTZ as well as social and economic investigation in TEDA, Tianjin port, Tanggu, Dongli and Jinnan districts.8 As a cornerstone, these studies provide basic information and an intimate
8 Meng Guangwen (1989), “The Evolution and Characteristics of Tianjin’s Town System and the Construction of Industrial Town at the Harbor on the Lower Reaches of the Haihe-River”, In: <<Human Geographical Studies>>, No. 4, Xi’ an, pp. 33-36
Meng Guangwen (1989), “Comprehensive Study on the Establishment of Tianjin Free Port” In: <<Tianjin Economy>>, Supplement, Tianjin, pp. 45-47 Meng Guangwen (1989), “Comprehensive Study on the Establishment of Tianjin Free Port” In: <<Tianjin Economy>>, Supplement, Tianjin, pp. 45-47
Meng Guangwen(1990), “Comprehensive Analysis of the present Situation of the Development in the Area of the lower Reaches of Tianjin Haihe-River”, In: <<City>>, No. 2, Tianjin, pp. 45-48
understanding of the social and economic issues in Tianjin coastal region and TEDA as well as useful connections to various experts. Due to these contacts, substantial face-to-face interviews could be realized in 1999/2000, e.g. with several officers of the administrative committee of TEDA (such as the assistant director of TEDA’s economic development bureau, the section chief of TEDA’s policy research office, the chief engineering department), with senior staff members of foreign enterprises (e.g. Motorola) in TEDA, with the management of a German company in TEDA’s sub-zone, with the chief of FTZ’s trade development bureau in Tianjin FTZ and others more.
This first hand information was embedded in the analysis of a) officially published literature in English, German and Chinese about FEZs including solid and comprehensive theoretical and empirical studies as well as b) officially published information of statistical data concerning TEDA, Tianjin and China from 1984 to 2000 to analyze the structures and evolutionary stages of TEDA. Another main source of information used for this study are restricted publications, especially of TEDA (1995–2000), including numerous discussion papers and investigation results about TEDA’s development and problems – information, which were especially useful to evaluate TEDA’s achievement and problems.
Meng Guangwen (1990), “Study of the Effects of Human Activity on the Evolution of Tianjin’s Regional Environment”, In: <<Regional Conference on Asian Pacific Countries, International Geographical Union (IGU)>>, Beijin, Section 3-39
Meng Guangwen (1990), “Development of the Port Industrial Zone on the lower Reaches of Tianjin Haihe- River – a new Model of Development for the Port Industrial Zone”, In: <<Urban Historical Studies>>, No. 2, Tianjin, pp. 125-140
Meng Guangwen (1992), “Grading of Land in Tianjin Municipality’s Tanggu District – Calculation of the Proportional Effects of the Town’s Basic Facilities”, Manuscript, Tianjin Normal University
Sun Kaiyuan, Meng Guangwen (1990), “Review of China’s Open Policy and Analysis of Future Prospects”, In: <<Theory and Modernization>>, No. 7, Tianjin, 1990, pp. 8-11, and In: <<Regional Conference on Asian Pacific Countries, International Geographical Union (IGU)>>, Beijing, Section 14-54
The Evolution of Free Economic Zones in the World Economy – a Systematic Approach
In the last decades, world economic integration, including trade liberation, financial internationalization and production integration, has made a great progress. An increasing number of countries have become involved in the international division of labor. For many less developed countries (LDCs), this seems to be a possibility to develop and expand their national economy. The relocation of aging industries from developed countries (DCs) to LDCs is very often explained by theories like production life cycle and similar. The shift of labor-intensive industry (textiles, shoes etc.) at first, and capital-intensive industry (steel, ships, petrochemicals, electronics) later to LDCs let to the theory of “New Spatial Division of Labor”.9 The enormous growth of the industrial sector in many LDCs is based on their attractiveness for foreign capital and their export oriented industrial policies focusing on the world market.
But industrialization is much more than this view reflects. It is a comprehensive process of learning and adjusting to a given national business system. This, of course, is not possible without extensive changes in the political administrative system. Therefore, the national political features as well as the global conditions must be taken into consideration in order to explain the local processes of industrialization. The remodeling of internal social structures was and is an important precondition for successful industrialization in East and Southeast Asia as well as in other LDCs worldwide. But, still, industrialization in LDCs remains local, concentrating on a few regions only. This again results in a (strong) polarization of economic weak and strong regions in a country. They can be urban industrial poles and industrial districts as well as free economic zones (FEZs) that are found in LDCs all over the world.
FEZs have a long history and appear in various types. They are the results of free trade policy, export-oriented industrial policy and deregulation. The first export processing zones (EPZs) were established in Ireland and Taiwan in the 1960s as a result of the relocation of industrial production between DCs and from DCs into LDCs. Since then, EPZs can be found in many LDCs, especially in those countries that have focused on exports (see Fig. 1).
In general, EPZs can be defined as export enclaves, where a national (or local) government provides foreign industries an international accessibility (e.g. harbor, airport, etc.), gives up
“ostensible” repressive national regulations (e.g. ban of trade unions) and offers economic incentives (financial and tax). The main advantage for the enterprises in EPZs is the low wages for the unskilled labor force. However, unless a country succeeds in establishing some sort of higher, i.e. more qualified forms of industrial production, its economy is threatened by other low wage countries.
Since the 1960's a broad variety of FEZs and aligned policies have originated worldwide. In order to estimate the significance of FEZs in the People’s Republic of China – here first established in the late 1970's as so-called “special economic zones” (SEZs) – different generations of economic areas offering preferential policies throughout the world and
9 Fröbel, P. Heinrich, J. Kreye, O. (1977), “Die neue Internationale Arbeitsteilung”, In: <<Strukturelle Arbeitslosigkeit in den Industrieländern und die Industrialisierung der Entwicklungsländer>>, Reinbek bei Hamburg
throughout history will be presented. The variation and evolution of the function and structure of world FEZs will be analyzed in a systematic approach. Robert J. McCalla (1990)10 focused his study on the structural and spatial evolution, and several examples of FEZs until 1986, such as FPs, FTZs, EPZs and free tourism zones. Xiangming Chen offered a model of the historical and contemporary evolution of FEZs in the mid 1990s, including EPZs, SEZs and eventual SIPs and cross-border GTs.11 In part A, McCalla’s and Chen’s model will be extended and concretized offering a closer look at the interior structural revolution of FEZs. For this analysis, the consideration will be given not only to economic, but also to diverse political, social-cultural and spatial conditions that influence the evolution of FEZs. The close relation between world economic integration and FEZs, a general definition, a general typological classification and a structural and spatial evolutionary model of FEZs will be discussed.
Fig. 1: Export Processing Zones in Less Developed Countries
Source: Dicken, P. (1998): “Global Shift”, In: <<Transforming the World Economy>>, London, p. 131; cited by Schamp, E.
W. (2000) : <<Vernetzte Production: Industriegeographie aus Institutioneller Perspective>>, Damstadt, S. 175
10 McCalla, Reobert J. (1990), “The Geographical Spread of Free Zones Associated with Ports”, In:
<<Geoforum>>, Vol. 21, No. 1, Pergamon Press Plc.
11 Xiangming Chen (1995), “The Evolution of the Free Economic Zones and the Recent Development of Cross- National Growth Zones”, In: <<International Journal of Urban and Regional Research>>, Vol. 19
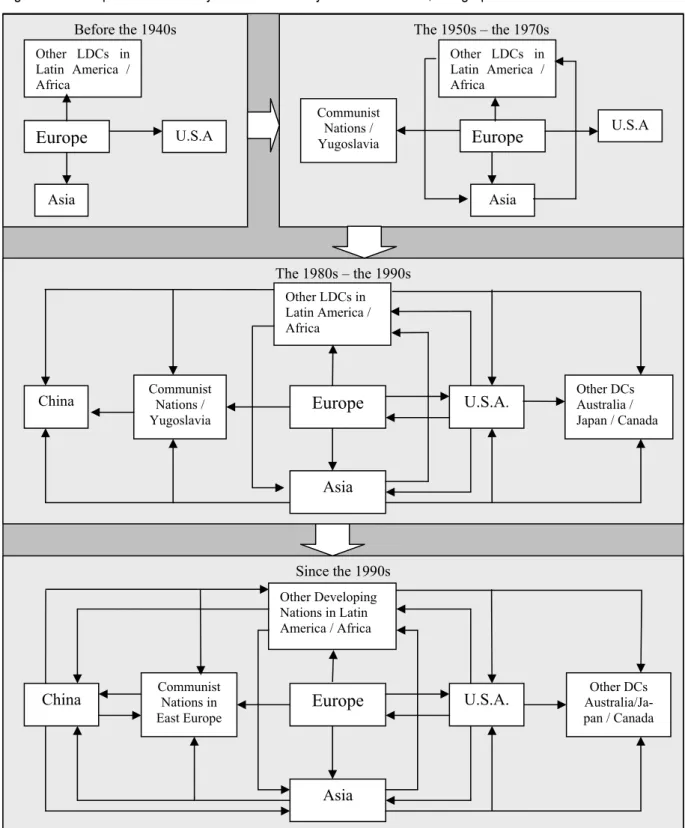
In the development of the world economy, there has been a tendency towards world economic integration (WEI) and economic globalization (EG). Today, this means that most countries are the part of the global economic network, contrary to the time before World War II, when the so-called “world economy” included only some DCs. Even in the 1950s, it was limited to the market-oriented economy. Since then, some LDCs have become newly industrialized countries with market economic systems. Former socialist courtiers have also been included.
The world economy established more close relations and is now spatially globalized.
As a part of WEI and EG, FEZs have played a mayor role in world economic development, especially in LDCs. Most prior studies, however, have separately discussed these two world economic phenomena, so that the relation between them has more or less been ignored. In this chapter, WEI and its relation with FEZs will be discussed in order to realize the FEZ’s development background and the trend.
1.1. World Economic Integration
Up to now, there has not been a generally recognized definition because so-called WEI is just at its beginning stage. It has been defined and explained, though, according to some features of the integrative stage at this time. The typical definitions are: the complete elimination of man-made barriers to the worldwide free flow of capital and labor forces;12 trade liberalization between all countries;13 the elimination of barriers to the worldwide free flow of the essential factors of production and price equalization of the factors;14 the elimination of barriers to the worldwide free flow of economic factors at all stages of reproduction.15 The above-mentioned definitions describe the features of different integrative stages, but regional economic integration (REI) and institutionalization have not been paid enough attention.
Based on these statements, WEI can be understood as an increasingly integrating process and the objective of world economic development. In other words, the various economic sectors worldwide and inside the designated regions increasingly merge into an economic system, and the various economic areas are increasingly integrated into an economic entirety. This progress is not only characterized by functional integration and REI, but also guaranteed by institutionalization.
Functional integration includes trade liberalization (TL), financial internationalization (FI) and production integration (PI). TL in commodity exchange, FI in distribution of essential factors of production, PI in production fields indicate separately the integration of the world economy from the grass roots to the higher levels. Institutionalization includes various international treaties and agreements, which is the organizational guarantee to realize the above-mentioned three integrative phases. REI has the different spatial dimensions and levels,16 and is the spatial form or the regionalization of functional integration and
12 Balassa, B. (1961), <<The Theory of Economic Integration>>, London
13 Tinbergen, J. (1965), <<International Economic Integration>>, 2. Aufl. Amsterdam
14 Kindelberg, C. P. (1973), <<Die Weltwirtschaftskrise>>, Bd. 4 der Reihe Geschichte der Weltwirtschaft im 20. Jahrhundert, Fischer, W., München
15 Zhang Youwen (1997), “Some Theoretical Problems of World Economic Integration”, (Guanyu Shijiejingji Yitihua De Jigewenti), In: <<Xinhuawenzhai>>, No. 12, Beijing, pp. 56
16 For discussion, see: Pan Xiaomin (1997), “The Theoretical Evolution of Regional Integration”, (Qiuyuyitihua De Lilungainian Jiqi Yianbian), In: <<Land and Regional Economy>>, (Guotu Yu Qiuyujingji), No. 2, Beijing, p. 23
institutionalization. The growing number of integrative regions can promote the worldwide development of functional integration and institutionalization, and expand WEI spatially.
Today, world REI can be observed at varying development stages in different regions, following different regional models.
Fig. 2: Types and Logical Relation of World Economic Integration
Functional Integration and Institutionalization
Essentially, the development of functional integration is spontaneously furthered by the inherent demand of a market-oriented economy and guaranteed by institutionalization. Both interact as both cause and effect. When functional integration reaches a certain stage, it certainly requires legal, political, and institutional support, namely institutionalization. In return, the development of institutionalization can also promote and guarantee functional integration, and, furthermore, creates the motivation for its own evolution to a higher developmental stage. These are the two different parts of integration.
Trade liberalization (TL)
Just like international trade as the initial stage and the basic form of the world economy, TL is the primary stage and the basic characteristic of WEI. Trade development promotes the establishment of world markets so that most countries wish to eliminate trade barriers and gradually set up a global common market, which is developed from the regional reciprocity in trade to free trade agreements, customs unions, and a multi-trade system.
Since the establishment of the capitalist commodity economy, several powerful nations have gradually opened the world market through trade, military, and colonial expansion. After the postwar years, DCs promoted the development of global free trade and the establishment of a world market. Following the development of trade and the gradual integration of world markets, each individual country’s dependence on foreign trade has being increased. Today, trade is still one of the key motives to advance world economic development. Besides, various trade groups have continually been established globally and have thus promoted worldwide and regional TL. In addition, worldwide TL calls for an organizational and an institutional guarantee. GATT (in 1947) and WTO (in 1995) marked the establishment of a standardized and legal world market. GATT desired to realize a global TL throughout multilateral trade negotiations. After eight rounds of negotiations, the reduction of tariff, anti- dumping, the elimination of tariff and non-tariff barriers, the liberalization of agricultural products trade and the protection of intellectual property rights were realized. WTO is to look after multilateral trade agreements and negotiations, resolve trade disputes, control national trade policies and cooperate with other organizations. Besides the functional extension, WTO also established the permanent organization, including “Council for Trade in Goods”,
“Council for Trade-Related Aspects of Intellectual Property Rights” and “Council for Service Trade”. FEZs, especially trade-based and comprehensive FEZs, promoted TL between FEZs and world economy or in return.
Design: Meng Guangwen Functional Integration
Institutionalization Regional Integration
World Economic Integration Free Economic Zone
Financial Internationalization (FI)
FI or capital internationalization is the process of eliminating barriers to capital free flow on a large-scale and of establishing international institutions.17 The international monetary system underwent the “Gold Standard Time” (1870–1914), the “Chaos Time” of the 1st and 2nd World War (1915–1943) to the “Bretton Woods Time” (1944–1971) and the “Jamaica Time”
(since 1976). Bretton Woods Time marked the setup of a world monetary system. Until today, the US dollar is still the leading international currency, covering 48% of international trade settlement, 42% of foreign exchange transaction and 66% of official foreign exchange reserve.
Following the establishment of the European Dollar Market in the 1950s, a lot of countries have gradually relaxed their financial control. Since the 1990s, the “Financial Service Agreement” of WTO has fixed financial opening as a main condition for new members. In 1995, all industrial countries eliminated their respective restrictions to capital flow. Until 1996, 57 countries eliminated restrictions to capital transaction. This step promoted the establishment and the rapid development of international financial markets and cross-national financial institutions. The volume of foreign exchange transaction in one day averaged 590b US$ in 1989, but reached 1500b US$ in 1998. The volume of stock exchange transaction increased from 150b US$ in 1992 to 3542b US$ in 1997. Recently, many big cross-national commercial and investment banks have been established. As financial globalization calls for global financial coordination and supervision, the corresponding international financial institutions have emerged as needed. The main international institutions include the
“International Monetary Fund,” “World Bank,” and “International Settlement Bank.” In addition, regional FI has made tremendous progress in Europe. The European Union (EU) has achieved monetary and economic union. Along with the launch of the Euro, financial market integration has been picking up the speed. The European Central Bank was established in 1999 in Frankfurt/Main, Germany. Recently, an integration of the European stock market has become noticeable. The establishment and development of service-, trade- based and comprehensive FEZs promoted FI between FEZs and world economy or in return.
Production Integration (PI)
TL, especially FI, have fostered foreign direct investment since the 1960s. Production distribution depends to a large degree on the efficient and optimized global use of essential factors of production. In order to reduce production costs and break down national trade barriers, transnational corporations (TCs) plan their worldwide production and remodel the use of world resources according to the world market. TCs also revise and optimize their industrial structures by transferring labor- and capital-intensive industries to LDCs. The industrial sector of a country or a FEZ becomes more and more a result of the global strategy of TCs instead of a result of national industrial policy. In East Asia, the “brother’s model” of international division of industrial structure, led by Japan, has been established since the 1980s, namely, that Japan transfers labor-intensive industry to Asian LDCs. The emergence and development of manufacture-based and comprehensive FEZ in DCs, especially in LDCs, is the reflection of PI worldwide.
17 Yang Zaiping (1999), “Financial Globalization: Advantages, Disadvantages and Management”, (Jinrun Quanqiuhua: Libi Yu Guanli), In: << World Affairs>>, No. 6, Beijing, pp. 16-17
Regional Economic Integration 18
WEI and REI are related entirely and in part, to the development objective and stages. Both promote, supplement and complement each other. First, WEI is the developmental motivation and background of REI because the evolution of the capitalist economy inherently necessitated breaking down the barriers and the restrictions to TL, FI, and PI, and furthering the responding institutional guarantee on the basis of market mechanisms. At the same time, WEI also enhances the opening of some established integrative regions to other areas, e.g.
when regional integrative organizations enlarge the integrative and cooperative contingents or win members and cooperate with other regional integrative organizations. Second, REI can promote the development of WEI. Since there are huge regional divergences in economy, politics, culture, and religion, it is only possible to first develop REI in some economic areas and sectors offering favorable conditions. REI will promote the realization of WEI throughout its integrative degree, spatial expansion, and cooperation with other integrative regions. Thus, REI is a necessary step towards WEI and its regional reflection. Only when economic integration in several regions and at different stages was achieved first, WEI could finally be obtained.
According to the substantial evidence of integration in the “European Community” (EC), a general conception of REI was advanced from the 1950s to the 1960s. REI means an integration process of national economies of several member states into a great economic area, including the harmonization and the unification of economic policies and market regulation, the establishment of a common market and cross-national organizations (concluding and signing treaties and agreements).19 REI calls for the elimination of all kinds of trade barriers between partner countries and other discriminative economic policies, so that the economic rights of member states will be partly transferred to the cross-national organization or the regional cooperation organization with a legally binding power and fulfilling administrative functions.
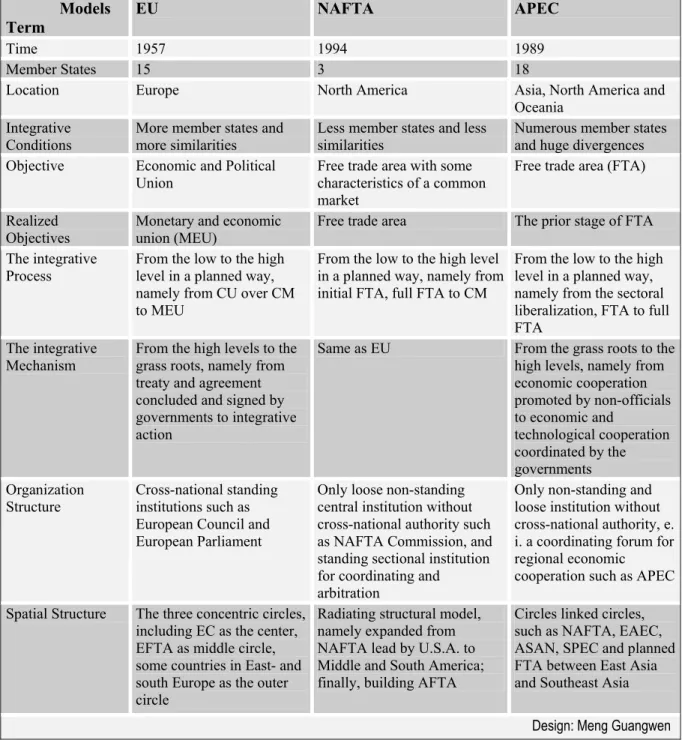
According to the degree of integration, natural conditions, geographical locations, economic power, political systems, cultures, and religions, REI can be differentiated from the “Model of EC”, the “Model of NAFTA (North American Free Trade Zone)”, and the “Model of APEC (Asia and Pacific Economic Cooperation) on a global level. The experience of EC shows that REI would evolve from preferential customs area (PCA), cross-national free trade area (FTA), customs union (CU), common market (CM), monetary and economic union (MEU), economic and political union (EPU), and eventually to political and economic union (PEU). Following this evolution, economic integration is transformed from reduction of customs duty, common customs duty, common market, and common economic and social policy to common diplomatic and military policy, and finally to the establishment of the standing cross-national political organizations (see Table 1).20
18 Note: regional integration (RI) is used to describe the regional and cross-national political and economic cooperation and fusion. It includes regional political integration (RPI) and REI. According to the classic theory, RI is usually understood as REI because REI is the core and the basis of the RI. REI stresses the economic integrative process, whereas RPI focuses on building the respective institutions and the form of regional integrative process. REI plays a fundamental role in the initial integrative phase, but it will lead to RPI when it develops to a higher integrative phase
19 For discussion, see: Balassa, B.(1961), <<The Theory of Economic Integration>>, London
Qiu Yuanlun (1998), “The Eight Contradictions of Economic Globalization”, (Jinji Quanqiuhua Nehan Badui Maodung), In: <<World Affairs>>, No. 6, Beijing, p. 22
20 For discussion, see: 1) Blank/Clausen/Wacker (1998), <<Internationale Ökonomische Integration>>, Verlag Franz Vahlen München, S. 31-42; 2) Schrott, Jeffrey. J. (1989), <<More Free Trade Areas?>>, Institute for International Economics, Washington, DC, pp. 16-17; 3) Fu Meibing (1993), <<The World Regional Economic Cooperation>>, (Guoji Quyujingji Hezuo), People’s Republic House, Beijing
Until today, REI has realized PCA, FTA, CU, CM and MEU. Further development of MEU demands corresponding political integration, which is more difficult and complicated than the economic integration. At stages of FTA, CU, and CM, the free flow of commodity, capital, service and personnel, harmonization, and formulation of common economic policy have been realized and the corresponding cross-national organization has been established in some regions such as EU, but trade protectionism against non-member states are perpetuated and even harmonized. This means that free trade is not yet a reality worldwide, but, amongst other forms of economic integration, it can be gradually realized between some countries and regions, and conceivably finally leads to WEI.
Tab. 1: The Structural Types and Symbols of World Regional Economic Integration
Symbol Types
Preferential trade between member states
Free trade between member states
Common customs against third countries
Free flow of
production factors
Harmoniza- tion & inte- gration of economic &
social policy
Economic integration
& political cooperation
Economic integration
& political integration PCA
z { { { { { {
REC FTA
z z { { { { {
CU
z z z { { { {
CM
z z z z { { {
REI EU
z z z z z { {
REI-
RPC EPU
z z z z z z {
REI- RPI
PEU
z z z z z z {
Design: Meng Guangwen Note: The black points show the types of REI including the different integrative continents, and the circles mean the
types of REI excluding relevant integration;
REC: regional economic cooperation; REI: regional economic integration; RPC: regional political cooperation;
RPI: regional political integration; PCA: preferential customs area; EPU: economic and political union; PEU:
political and economic union; FTA: free trade area; CU: customs union, CM: common market, EU: European Union
Besides EC, NAFTA (the United States, Canada and Mexico) was set up in 1994 based on the FTA between the United States and Canada. It will evolve from a FTA to a CM. APEC was established in 1984, and includes several types of REI, such as NAFTA, EAEC (East Asia Economic Cooperation), ASAN (Association of Southeast Asian Nations), planned FTAs between the East Asian Countries and between East Asia and Southeast Asia. APEC will evolve from an forum of REC to a FTA. The similarity and the disparity between them are presented in Table 2.