Differential effects of nitrate, ammonium, and urea as N sources for microbial communities in the North Pacific Ocean
I. N. Shilova ,
1,aM. M. Mills,
2J. C. Robidart,
3K. A. Turk-Kubo,
1K. M. Bj orkman, €
4Z. Kolber,
1I. Rapp,
5G. L. van Dijken,
2M. J. Church,
4,bK. R. Arrigo,
2E. P. Achterberg,
5J. P. Zehr
1*
1University of California Santa Cruz, Santa Cruz, California
2Stanford University, Stanford, California
3National Oceanography Centre, Southampton, United Kingdom
4University of Hawaii at Manoa, Honolulu, Hawaii
5GEOMAR Helmholtz Centre for Ocean Research, Kiel, Germany
Abstract
Nitrogen (N) is the major limiting nutrient for phytoplankton growth and productivity in large parts of the world’s oceans. Differential preferences for specific N substrates may be important in controlling phyto- plankton community composition. To date, there is limited information on how specific N substrates influ- ence the composition of naturally occurring microbial communities. We investigated the effect of nitrate (NO23), ammonium (NH14), and urea on microbial and phytoplankton community composition (cell abun- dances and 16S rRNA gene profiling) and functioning (photosynthetic activity, carbon fixation rates) in the oligotrophic waters of the North Pacific Ocean. All N substrates tested significantly stimulated phytoplank- ton growth and productivity. Urea resulted in the greatest (>300%) increases in chlorophyll a(<0.06lg L21 and0.19lg L21in the control and urea addition, respectively) and productivity (<0.4lmol C L21d21and 1.4 lmol C L21 d21 in the control and urea addition, respectively) at two experimental stations, largely due to increased abundances of Prochlorococcus (Cyanobacteria). Two abundant clades of Prochlorococcus, High Light I and II, demonstrated similar responses to urea, suggesting this substrate is likely an important N source for natural Prochlorococcus populations. In contrast, the heterotrophic community composition changed most in response to NH14. Finally, the time and magnitude of response to N amendments varied with geographic location, likely due to differences in microbial community composition and their nutrient status. Our results provide support for the hypothesis that changes in N supply would likely favor specific populations of phytoplankton in different oceanic regions and thus, affect both biogeochemical cycles and ecological processes.
Nitrogen (N) is a major component of cell constituents, including proteins and nucleic acids, and is considered the primary limiting element for phytoplankton growth and photosynthetic carbon fixation in oligotrophic oceans (Epp- ley et al. 1977; Graziano et al. 1996; Mills et al. 2004; Moore et al. 2013). While there is an intricate balance among iron
(Fe), phosphorus (P), and N in shaping microbial communi- ties in the marine environment, nutrient enrichment experi- ments have demonstrated that the availability of N alone can stimulate growth of phytoplankton and affect heterotro- phic communities in the oligotrophic ocean (Mills et al.
2004, 2008; Bonnet et al. 2008; Davey et al. 2008; Moore et al. 2008; Ortega-Retuerta et al. 2012).
N actively cycles in the upper ocean where sunlight pro- vides energy that rapidly fuels production and consumption of N compounds. The major forms of N in the surface ocean include dinitrogen gas (N2), ammonium (NH14), nitrate (NO–3), nitrite (NO–2), and dissolved organic N (DON). N2fixa- tion can account for 40–50% of net community production in the North Pacific Subtropical Gyre (NPSG) (Bottjer et al.€ 2016), however, net community production in this ecosys- tem is less than 10% of gross primary production (Quay
*Correspondence: zehrj@ucsc.edu
aPresent address: Second Genome, Inc, South San Francisco, CA
bPresent address: Flathead Lake Biological Station, University of Montana, Polson, Montana
I. S. and M. M. have contributed equally to this work.
Additional Supporting Information may be found in the online version of this article.
1
LIMNOLOGY
and
OCEANOGRAPHY
Limnol. Oceanogr.00, 2017, 00–00 VC2017 Association for the Sciences of Limnology and Oceanography doi: 10.1002/lno.10590et al. 2010). Although abundant, the bulk of the DON pool, except urea, amino acids, and nucleotides, generally does not appear readily bioavailable and is believed to be minor source of N for most phytoplankton (Aluwihare and Meador 2008; Mulholland and Lomas 2008). The major fixed N pools (NH14, NO–3, NO–2, urea) have different sources and rates of production and turnover. Regeneration by heterotrophic bacteria, and excretion and release by zooplankton, are the major natural sources of NH14 and urea in the upper ocean (Corner and Newell 1967; Mayzaud 1973; Mitamura and Saijo 1981; Bidigare 1983; Hansell and Goering 1989; Bronk et al. 1998). Regenerated production supported by this rap- idly recycled N accounts for over 90% of gross primary pro- duction in the oligotrophic oceans (Eppley and Peterson 1979). NO23 is supplied to the euphotic zone predominately via mixing or upwelling of sub-euphotic zone waters with additional contributions derived from nitrification within the euphotic zone (Dore and Karl 1996; Yool et al. 2007) and atmospheric deposition (Duce et al. 2008). N from sour- ces external to the surface ocean supports “new” production, which balances N export losses due to sinking to the deep ocean (Dugdale and Goering 1967). New N is also introduced through N2fixation carried out by diazotrophs, a small sub- set of the marine microbial community (Dugdale and Goe- ring 1967; Zehr and Kudela 2011). Recycling of diazotroph organic matter transfers this new N to the dissolved pool as DON (e.g., amino acids and urea) and/or NH14 where it can be used to fuel primary production (Montoya et al. 2002;
Zehr and Kudela 2011). Thus, the chemical form of N is an important factor in the functioning of ocean ecosystems.
Microbial communities that utilize dissolved N in oligo- trophic oceans are diverse, but are comprised largely of cya- nobacteria (Prochlorococcus and Synechococcus), diatoms, eukaryotic picoplankton (for example, prymnesiophytes and pelagophytes) and a variety of heterotrophic bacteria (including Pelagibacter ubique) and Archaea (Waterbury et al.
1979; Chisholm et al. 1988; DuRand et al. 2001; Karner et al.
2001; Morris et al. 2002; Worden et al. 2004). These microor- ganisms have a variety of N assimilation strategies that differ in the rates of N uptake and assimilation, regulation of N metabolism, and their abilities to use different N forms. For example, N-limited Low Light (LL) Prochlorococcus strains appear unable to grow on NO–3 (Moore et al. 2002), while some strains of the High Light (HL) ecotypes are able to assimilate NO–3, although at reduced rates of growth relative to other substrates (e.g., NH14, Martiny et al. 2009; Berube et al. 2015). Many marine microorganisms use NO23 as a source of N, including diatoms and Synechococcus, as well as some heterotrophic bacteria (Allen et al. 2001, 2006; Casey et al. 2007; Collier et al. 2012). Isotopic analyses suggest that eukaryotic phytoplankton smaller than 30 lm in the Sargasso Sea acquire a major fraction of their N demand from NO23 (Fawcett et al. 2011). The assimilation of urea by phototrophic and heterotrophic marine microorganisms is
common across numerous phylogenetic groups and ecologi- cal niches (McCarthy 1972a,b; Hallam et al. 2006; Baker et al. 2009; Collier et al. 2009; review by Solomon et al.
2010). ManyProchlorococcusstrains and all testedSynechococcus strains can utilize urea, yet this N substrate supports different growth rates within each genus (Moore et al. 2002). Moreover, rates of urea uptake and assimilation in natural microbial pop- ulations appear comparable to those of NH14 (Sahlsten 1987;
Price and Harrison 1988), although rates differ among phyto- plankton taxa (Lomas and Glibert 2000; Moore et al. 2002;
Fan et al. 2003). Despite the accumulated knowledge about N utilization by marine microorganisms, taxon-specific preferen- ces and utilization efficiencies for different N species are still ambiguous, especially in the oligotrophic open ocean.
The form and supply of different N substrates are impor- tant controls on microbial community composition. Under- standing the effect of different N forms is critical because N supply to the surface oceans will likely change due to greater stratification caused by climate change (Gruber and Gallo- way 2008; Capotondi et al. 2012; Kim et al. 2014), and the projected increase in atmospheric anthropogenic N deposi- tion (Duce et al. 2008). We performed nutrient enrichment experiments to determine the functional and taxonomic responses in microbial communities to different N forms and whether the responses vary depending on the nutrient status (mesotrophic vs. oligotrophic) in the North Pacific Ocean.
The measured functional responses included CO2 fixation rates and changes in chlorophyll a (Chl a) and photosyn- thetic parameters. The taxonomic responses were assessed by quantifying the abundance of major phytoplankton groups and heterotrophic bacteria as well as assessing relative shifts in cyanobacterial and heterotrophic community composi- tion based on 16S rRNA gene sequencing.
Materials and methods
Nutrient amendments experiments
Experiments were conducted in August of 2014 during the Nitrogen Effects on Marine microOrganisms cruise (NEMO, R/V New Horizon) at two sites in the North Pacific Ocean: one within the western part of the transitional zone of the California Current System (CCS; Station 38, hereafter referred to as TZ), and one in the oligotrophic NPSG (Station 52, hereafter referred to as GY: Fig. 1). The TZ site was in an anticyclonic eddy, based on the sea surface height anomaly (Fig. 1b). The two sites were chosen based on a priori assumptions of nutrient limitation of primary productivity at each site. The availability of Fe can play an important role in controlling phytoplankton growth in the CCS (Biller and Bruland 2014). In contrast, N was assumed to be limiting pri- mary productivity in the NPSG. All experiments were under- taken using strict trace-metal clean techniques (Mills et al.
2004) during the preparation and sampling of the experi- ments. Water at each station was collected from 25 m depth
Shilova et al. N effects on microbial communities
2
using a towed fish with Teflon diaphragm pump. The water was pumped gently into a 40 L carboy in a trace-metal clean laboratory van. This allowed mixing of the seawater before it was distributed into incubation bottles. Seawater was sub- sampled into 4 L polycarbonate bottles (Thermo ScientificTM NalgeneTM) that had been acid-washed and, prior to the experiment, rinsed thoroughly with seawater at the site of each experiment. The bottles used in the first experiment
were acid-rinsed and reused for the same treatments in the second experiment. In the TZ site experiment, triplicate incubation bottles were amended with either NO23 (final concentration 5.0 lmol L21), NH14 (final concentration 5.0 lmol L21), urea (final concentration 5.0lmol N L21), 0.2lm pre-filtered deep (600 m) seawater (FDW) (12.5% of total vol- ume, equivalent to 5 lmol L21 NO23 addition), Fe31(final concentration 2 nmol L21) or a combined treatment Fig. 1.Geographic locations in the North Pacific (a), sea surface height anomaly (b), and potential density profiles (c) of the two stations where nutrient addition experiments were conducted in August of 2014. Station 38 was in the western part of the transition zone of the California Current System (station TZ), and Station 52 was in the oligotrophic North Pacific Subtropical Gyre (station GY).
Shilova et al. N effects on microbial communities
3
containing NO23 and Fe31 (final concentrations of 5 lmol L21 and 2 nmol L21, respectively). The Fe and Fe1NO23 treatments were used to test for Fe and Fe1NO23 co- limitation. The GY experiment was similar in design with the exception that all N compounds were added to achieve a final concentration of 2.5 lmol N L21, and 6% of total vol- ume of FDW was added (an approximately 2.5 lmol L21 NO23 addition). The N additions in the TZ experiment were higher than in the GY experiment based on previous work in the CCS by Biller and Bruland (2014) who measured resid- ual NO23 concentrations in the transitional zone of CCS ranging from 5 lmol L21 to 15 lmol L21, while residual NO23 at the GY was negligible (<10 nmol L21). In both experiments, the Controls consisted of triplicate bottles filled with unamended seawater from the respective station and depth. The Controls were incubated and processed in the same manner as the experimental treatments. All nutrient additions were undertaken in a laminar flow hood. The nutrient solutions, except the Fe solution, were passed through Chelex100 to minimize trace metal contamination.
Purity controls were measured for all stocks to ensure the absence of contamination (i.e., Fe stocks did not contain dis- solved N, N stocks did not contain Fe, and individual N stocks were not contaminated with other N species). Incuba- tion bottles were placed in a flow-through surface seawater incubator, to achieve surface ocean temperatures during the experiment, with neutral screening to attenuate incident light to approximately 35% of the surface solar irradiance.
The setup and samplings of the setup (T0), and at 24 (T24) and 48 (T48) h after the start of the incubation were under- taken before dawn. Rates of primary productivity and con- centrations of Chlaand nutrients were measured in samples immediately after the nutrient amendments (T0) and at T48.
Samples for photophysiological parameters, cell abundance, and microbial community composition were collected prior to the nutrient amendments (T0), at T24, and T48.
Nutrient analysis
Samples for subsequent analyses of nutrient concentra- tions were collected in acid-washed, sample rinsed polyethyl- ene bottles and stored frozen at2208C until analyzed (Dore et al. 1996). NO23 1NO22, soluble reactive phosphorus (SRP) and Si(OH)4 concentrations (lmol L21) were determined using a segmented flow continuous flow automated nutrient analyzer (SEAL Analytical - AA3) using standard colorimetric techniques (Strickland and Parsons 1972). Accuracy of each analysis was checked using WAKO the International Cooper- ative Study of the Kuroshio and Adjacent Regions (CSK) and Ocean Scientific International Ltd. (OSIL) reference materi- als. NO231NO22 concentrations<500 nmol L21 were deter- mined using the high-sensitivity chemiluminescence technique (Garside 1982; Dore and Karl 1996) with a detec- tion limit of 1 nmol L21. NH14 samples were measured using the SEAL AA3 coupled with a 2 m liquid waveguide capillary
cell, employing indophenol blue chemistry (Li et al. 2005;
Zhu et al. 2014). The limit of detection for this method is 4 nmol L21.
Samples for subsequent analyses of trace metal concentra- tions were collected using an acid-cleaned hose (polyvinyl chloride, PVC) attached to a plastic-coated steel cable and lowered to the desired collection depth (25 m). Water was pumped to the surface using a Teflon bellows pump (Alma- tec A15) and transferred, entirely enclosed, into a trace- metal clean sampling container located in an on-deck trace- metal clean lab. Samples for the determination of dissolved Fe concentrations were filtered through a 0.2 lm Sartobran 300 capsule filter (Sartobran 300, Sartorius), collected in acid-cleaned 125 mL low density polyethylene (LDPE, Nal- gene) bottles, and immediately acidified with 150lL hydro- chloric acid (11 mol L21 HCl, OPTIMA grade, Fisher Scientific) to a final pH of 1.9. Dissolved Fe samples from the incubation experiments were collected at T0 and T48. The samples were filtered using 0.45 lm polycarbonate mem- brane filters (Millipore) mounted in an acid cleaned filter holder (Swinnex, Millipore), acidified to pH 1.9. and ana- lyzed on-board ship using flow injection analysis (FIA). Dis- solved Fe was determined on-board the ship using luminol chemiluminescence by flow injection analysis (FIA) follow- ing Obata et al. (1993). The FIA system was equipped with a Toyopearl AF Chelate 650M resin. Sample concentrations were determined by standard addition and were verified by analyzing “Sampling and Analysis of Fe (SAFe)” reference seawater with each analytical run. Our results for the refer- ence seawater were in good agreement with the consensus values for SAFe S: 0.09060.008 nmol L21 (n52) and SAFe D2: 1.04360.004 nmol L21 (n52). The precision of the method varied between 4% and 8% (1 SD) and was deter- mined by analyzing internal reference seawater after every 10 samples. The blank of the FIA method was 0.02860.010 nmol L21 (n512) and the limit of detection (LOD) deter- mined by the product of the blank and three times standard deviation of the blank was 0.058 nmol L21.
Chlorophylla
Subsamples (300 mL or 400 mL) were collected from each of the triplicate bottles and filtered through 25 mm diameter glass fiber filters (GF/F, Whatman). Filters were placed in 5 mL of 90% acetone and extracted in the dark at 28C for 24 h. Samples were equilibrated to room temperature before measurement. Fluorescence at 685 nm was measured using a Turner Designs TD-700 Field Fluorometer, calibrated with a Chlastandard (Sigma-Aldrich, C6144) dissolved in 90% ace- tone using the Welschmeyer (1994) filter setup.
14C-based primary productivity
Primary productivity (PP) was determined using 14C- labelled bicarbonate as a tracer for net inorganic carbon fixa- tion (Steeman-Nielsen 1952). A subsample from each treat- ment bottle was collected into acid-cleaned, sample-rinsed
Shilova et al. N effects on microbial communities
4
75 mL polycarbonate bottles and spiked with 14C-bicarbon- ate to achieve a final activity of approximately 250 lCi L21 (or 9.3 MBq L21, MP Biomedical #017441H). The bottles were incubated from dawn to dusk in the same on-deck incubator previously described. At the end of the daylight period, the entire sample volume was filtered through a 25 mm GF/F. The filters were placed into 20 mL borosilicate scintillation vials, acidified (1 mL, 2 mol L21 hydrochloric acid) and vented for 24 h prior to the addition of scintilla- tion cocktail (Ultima Gold LLT, Perkin-Elmer). Radioactivity was determined by liquid scintillation counting. Subsamples (250lL) for total14C-radioactivity were collected from each incubation bottle and fixed in phenethylamine (Sigma- Aldrich #407267). Rates of carbon fixation are expressed as lmol C L21d21.
Active fluorescence
Fast Repetition Rate Fluorometry (FRRF) was utilized to evaluate possible changes in photophysiology in response to the availability of different N and Fe substrates, as described in Kolber et al. (1998). The FRRF instrument was operated with multiple excitation wavelengths (450 nm, 470 nm, 505 nm, and 530 nm) that allowed for the rapid assessment of photosystem II (PSII) physiology in different groups of phytoplankton. Samples (500 mL) were first dark adapted (20 min) before conducting fluorescence measurements.
Fluorescence transients were acquired in samples that were continuously recirculated through the instrument sample chamber. The sample chamber was exposed to FRRF excita- tion protocol composed of a series of microsecond-long flashlets of controlled excitation power. The saturation phase of the excitation was comprised of 100 flashlets at 2.5 micro- second intervals. With the pulse excitation power of 30,000–
50,000lmol quanta m22s21, the rate of excitation delivery to PSII centers far exceeded the capacity of photosynthetic electron transport between PSII and PSI. This resulted in a progressive saturation of the observed fluorescence transients within the first 40–60 flashlets, with a rate proportional to the functional absorption cross section at particular wave- length. The saturation phase was followed by 90 flashlets applied at exponentially increasing time interval starting at 20 ls, over a period of 250 ms. As the average excitation power decreased, the fluorescence signal relaxed with a kinetics mostly defined by the rates of electron transport between PSII and PSI. Each sample measurement consisted of an average of 32 transients, and each sample was mea- sured three times at each wavelength. Blanks were obtained by gently filtering sample water through a 0.2lm syringe fil- ter and processing it in the same manner as the samples.
Recorded fluorescence transients were processed with FRRF software (http://soliense.com/) to estimate PSII maximum in vivo fluorescence (Fm), maximum photochemical efficiency (Fv/Fm), the functional absorption cross section (rPSII) for all Chl a-containing cells (excitation wavelength of 470 nm)
and phycoerythrin-containing plankton (e.g., Synechococcus, excitation wavelength of 505 nm), and the kinetics of the PSII-PSI electron transport.
Flow cytometry
Samples (2 mL of seawater) for subsequent flow cytometric enumeration of picoplankton were immediately fixed with glu- taraldehyde (0.25% v/v final concentration) upon collection, kept at room temperature in the dark for 15 min, then flash fro- zen and kept at 2808C until processing. Abundances ofPro- chlorococcus, Synechococcus, photosynthetic picoeukaryotes (PPEs), and heterotrophs were enumerated using a BD Biosci- ences Influx Cell Sorter (BD Biosciences, San Jose, California, U.S.A.) equipped with a 488 nm Sapphire laser (Coherent, Santa Clara, California, U.S.A.) using a 70lm nozzle. All fixed seawater samples were pre-filtered using a CellTricsVRfilter with 30lm mesh (Partec, Swedesboro, New Jersey, U.S.A.).Synecho- coccus populations were identified based on the presence of phycoerythrin (orange fluorescence; 572–27 photomultiplier tube, PMT) and all other non-phycoerythrin populations were identified using forward scatter (FSC) as a proxy for cell size and Chlacontent (red fluorescence; 692–20 PMT). To enumer- ate non-pigmented cells (heterotrophs), samples were stained with SYBRVR Green I nucleic acid stain (Lonza, Allendale, New Jersey, U.S.A.) according to the protocol described in Marie et al. (1999). To determine the abundances of non-pigmented heterotrophs with High Nucleic Acid content (HNA cells), the abundance ofProchlorococcusandSynechococcuscells were sub- tracted from all HNA cells. Data collection was triggered in the forward scatter (FSC) channel for photosynthetic cells and in the green channel (531-40 PMT) for SYBR-stained cells. Photo- synthetic cells were counted for 10 min; SYBR-positive cells were counted for 1.5 min. Cell counts were processed in FlowJo v10.0.7 (Tree Star, Ashland, Oregon, U.S.A.).
DNA extraction
One to two liters of seawater from each incubation bottle was filtered onto 0.2 lm Supor membrane filters (Pall Corp., Ann Arbor, Michigan, U.S.A.) using peristaltic pumps. The filters were placed in sterile 2.0 mL microcentrifuge tubes containing 0.5 mm and 1 mm diameter glass beads (Biospec, Bartlesville, Oklahoma, U.S.A.), flash frozen in liquid N2, and stored at 2808C until DNA extraction. DNA was extracted using the Qiagen DNeasy Plant kit (Valencia, California, U.S.A.), with modifications outlined in Moisander et al.
(2008) to improve recovery of high quality DNA. The final wash steps and DNA elution were automated using a QIA- cube robotic workstation (Qiagen). DNA quantity and qual- ity was measured using a NanoDrop (Thermo Scientific, Waltham, Massachusetts, U.S.A.) with an average DNA yield 11006900 ng L21seawater.
16S rRNA gene sequencing and sequence read processing Community composition was analyzed based on sequen- ces of the V3-V4 hypervariable region of the 16S rRNA gene
Shilova et al. N effects on microbial communities
5
using universal primers targeting Bacteria, Bakt_341F, and Bakt_805R (Herlemann et al. 2011). Primers were modified with common sequence linkers (Moonsamy et al. 2013) to facilitate library preparation. PCR amplifications were carried out in triplicate 25 lL reactions for each sample, with the following reaction conditions: 1X Platinum Taq PCR buffer – Mg (Invitrogen, Carlsbad, California), 2.5 mmol L21 MgCl2, 200lmol L21dNTP mix, 0.25lmol L21of both forward and reverse primers, 3 U Platinum Taq DNA Polymerase (Invitro- gen), and 1 mL of the DNA template. DNA was amplified using the following thermocycling conditions: initial dena- turation at 958C for 5 min, 25 cycles of denaturation at 958C for 40 s, annealing at 538C for 40 s, elongation at 728C for 60 s, and a final elongation at 728C for 7 min. Pooled ampli- cons underwent 10 more amplification cycles to add sequencing adaptors and sample-specific barcodes at the DNA Services Facility at the University of Illinois, Chicago, using the targeted amplicons sequencing approach described in Green et al. (2015). After the second round of PCR ampli- fication performed by DNA Services at UIC, library concentra- tions were equalized using SequalPrep purification plates (ThermoFisher Scientific). Paired-end reads were sequenced at the W.M. Keck Center for Comparative and Functional Geno- mics at the University of Illinois at Urbana-Champaign using Illumina MiSeq technology. Sequences of the 16S rRNA gene amplicons were obtained from a total of 91 samples that included samples in three replicates from T0, T24, and T48 for both experiments. There were on average 9986 reads per sample (median59990, minimum59664, and maximum5 10,340 reads per sample). De-multiplexed raw paired-end reads were merged using PEAR (Zhang et al. 2014). Assembled sequences were then quality filtered (split_libraries_fasta.py;
phred score of 20) and chimeras were removed using a de novo approach (identify_chimeric_seqs.py) in QIIME (Capor- aso et al. 2010). Operational taxonomic units (OTU) were defined at 99% nucleotide similarity using the usearch6.1 clus- tering method (Edgar 2010; pick_otus.py) and representative sequences were retrieved (pick_rep_set.py) in QIIME. The tax- onomy of representative sequences was assigned using a Greengenes reference database (http://greengenes.secondge- nome.com/downloads/database/13_5; DeSantis et al. 2006), and the assign_taxonomy.py QIIME script. We used the default parameters for the uclust consensus taxonomy assigner through QIIME (the minimum percent similarity for a taxo- nomic assignment was 0.9). The 16S rRNA gene sequences were deposited in Sequence Read Archive at National Center for Biotechnology Information (NCBI, http://www.ncbi.nlm.
nih.gov/sra) under BioProject accession number PRJNA358607.
Oligotyping
The oligotyping approach separates individual taxa,
“oligotypes,” within closely related organisms based on high entropy nucleotide positions in the 16S rRNA gene sequence
(Eren et al. 2013). In order to define oligotypes forProchloro- coccus and Synechococcus, we used the oligotyping pipeline version 2.0 (27 May 2015) and followed the instructions available at http://oligotyping.org (Eren et al. 2013). The oli- gotyping analysis was performed separately for bothProchlor- ococcus and Synechococcus. A total of 395,666 and 10,271 reads were obtained for Prochlorococcus and Synechococcus, respectively, from samples taken at T0 and T48 in the two experiments. Before the oligotyping analysis, the sequences were aligned using PyNAST (Caporaso et al. 2010) and Greengenes 16S rRNA gene reference database (gg_13_5 ver- sion available at http://greengenes.secondgenome.com/).
Shannon entropy calculations were followed by the oligotyp- ing analysis, which was run until each oligotype had con- verged (as described in Eren et al. 2013). The following parameters were chosen for bothProchlorococcusandSynecho- coccus oligotyping analyses: a50.1 and s52, where “a” is the minimum percent abundance of an oligotype in at least one sample and “s” is the minimum number of samples where an oligotype is expected to be present (Eren et al.
2013). The minimum substantial abundance criterion, M, determines the minimum abundance of the most abundant unique sequence in an oligotype and helps to reduce noise (Eren et al. 2013). ForProchlorococcusandSynechococcusoligo- typing analyses, M was 100 and 20, respectively. To assign taxonomy, the representative sequences of the oligotypes were searched against the reference genome database at NCBI using blastn version 2.3.01(Altschul et al. 1990). The BLAST search was done with the default parameters, and all best hits were saved. Because some strains within the genera Prochlorococcus and Synechococcus have identical 16S rRNA V3-V4 region sequences, a representative sequence of an oli- gotype often was equally identical to several strains. We called a group of such identical strains an eStrain, and the strains within each eStrain are reported in Supporting Infor- mation Table S1. Note that the sequences belonging to one oligotype are identical at the selected nucleotide positions within the amplified 441 nt region, but may vary at other positions within the 16S rRNA gene. Next, the relative abun- dance of oligotypes was used to calculate the absolute abun- dance using the cell counts for Prochlorococcus and Synechococcus, and the absolute numbers were used in further analyses.
Shifts in community composition
The changes in composition of the heterotrophic microbial communities andProchlorococcusandSynechococcuscommuni- ties, were analyzed using thePhyloseqpackage (McMurdie and Holmes 2013) within R (The R Core Team 2013, http://www.r- project.org). For heterotrophic community analysis, phylum
“Cyanobacteria” (that includes sequences from chloroplasts) were excluded, and the selected taxa were required to have a minimum of 50 reads total, resulting in 676,090 sequences total in all samples (minimum of 6195, median of 7040, and
Shilova et al. N effects on microbial communities
6
maximum of 9493 sequences per sample). Ecological distances among the samples were estimated with the Bray–Curtis and Jaccard indices. To compare the community shifts, resulting from different treatments, Principal Coordinate Analysis (PCoA) was applied to the distance matrices. In addition, the relative read abundances for heterotrophic microbial commu- nities were standardized to the median sequence depths (rare- fied). There was little difference in the depth of sequencing among the samples (maximum difference<600 reads with a mean of10K reads per sample) and the PCoA results for stan- dardized data were similar to the results from the non- standardized data.
Software
All statistical analyses were done in R (The R Core Team 2013, http://www.r-project.org): two-sample t-test for com- parisons of means for Chl a, PP, abundances, and FRRF measurements between treatments and controls and between treatments. To test for the observed differences in commu- nity composition among treatments, analysis of similarities was done on the Bray–Curtis dissimilarity distance matrix (anosimfunction within the “vegan” package in R, Oksanen
et al. 2016). The statisticRin analysis of similarities is based on the difference of mean ranks between the groups and within groups, ranges from 21 to 1, and R value of 0 indi- cates random groupings. In addition to analysis of similari- ties, analysis of variance (adonis function in “vegan”) was done on the Bray–Curtis dissimilarity matrix. Data were visu- alized using the ggplot2 package (Wickham 2009) in R, and all final figures were prepared for publication using Adobe Illustrator.
Results
Initial conditions
The physical and chemical conditions at the two experi- mental sites differed substantially. TZ (Station 38) was located in the transition zone between the California Cur- rent and the NPSG along the eastern margin of an anticy- clonic eddy (Fig. 1a,b). GY (Station 52) was located in the oligotrophic waters of the central gyre and further west in the NPSG in an area of relatively low eddy activity (Fig. 1b).
Both salinity and seawater temperature were higher at GY Table 1. Initial conditions at the two hydrographic stations where N amendment experiments were conducted.
GY station TZ station
Date 29 Aug 14 24 Aug 14
Location Latitude (ddm) 27.281 33.502
Longitude (ddm) 2140.382 2129.37
Physics Temperature,8C 23.8460.01 19.5060.04
Salinity 35.4160.01 33.4760.01
Nutrients NO231NO22, nmol L21 2.460.7 2.560.4
NH14, nmol L21* 36610 5863
SRP,lmol L21*** 0.09460.005 0.27260.005
Si(OH)4,lmol L21*** 1.3560.02 2.1460.01
Fe, nmol L21 Below LOD‡ Below LOD‡
Phytoplankton activity Chla,lg L21 0.05860.001 0.05760.003
14C-PP,lmol C L21d21 0.3360.02 0.3460.01
Fm470 3.460.2 3.660.3
Fv/Fm470** 0.3460.02 0.5160.01
rPSII-470310220m22quanta21 850640 900640
Cell abundances Phytoplankton total, mL21 1.660.53105 1.160.53105
Prochlorococcus, mL21 1.660.53105(30.8%) 1.060.53105(20.3%) Synechococcus, mL21* 1.260.83103(0.2%) 3.960.73103(0.8%) Photosynthetic picoeukaryotes, mL21* 1.1460.033103(0.2%) 2.560.23103(0.5%) HNA cells, mL21 1.260.13105(23.1%) 1.360.23105(25.3%) LNA cells, mL21 2.460.23105(46.2%) 2.660.33105(53.1%)
Total cells†, mL21 5.260.53105 5.060.63105
Concentrations of nutrients are shown as an average (6standard deviation) of three replicates. Chla, chlorophylla concentration;14C-PP, primary productivity rates; HNA, high nucleic acid cells; LNA, low nucleic acid cells; Fm470, maximum fluorescence at 470 nm; Fv/Fm470, maximum photo- chemical efficiency of PSII measured at 470 nm; rPSII-470, functional absorption cross-section of PSII measured at 470 nm. Significant difference in means is shown with *** forp<0.001, ** forp<0.01 and * forp<0.05 (two-samplet-test).
†Total cells:Prochlorococcus1Synechococcus1Photosynthetic picoeukaryotes1HNA1LNA cells.
‡Fe limit of detection (LOD) was 0.058 nmol L21.
Shilova et al. N effects on microbial communities
7
than at TZ (Table 1). The mixed layer depth was twice as deep at GY (48 m) in comparison to TZ (24 m) (Fig. 1c).
Concentrations of NO23 1NO22 in near-surface waters were low (<3 nmol L21) at both experimental sites (Table 1) while concentrations of NH14 were higher at TZ (5863 nmol L21vs.
36610 nmol L21 at GY). Soluble reactive phosphorus (SRP) concentrations were approximately 3-fold higher and concen- trations of Si(OH)4were 1.5-fold higher at TZ compared to GY.
Finally, surface concentrations of dissolved Fe were below detection (LOD50.058 nmol L21) at both sites.
The abundance of total picoplankton cells was approxi- mately equal at the two experimental stations (Table 1, 4.760.83105and 5.060.63105cells mL21at GY and TZ, respectively) but the composition of the communities was somewhat different. Phytoplankton cells were 1.5-fold more abundant at GY relative to TZ (Table 1) mainly due toProchlor- ococcus; however, the difference was not significant (1.660.5 3105cells mL21and 1.060.53105cells mL21at GY and TZ, respectively).Synechococcuswas approximately 100-times less abundant thanProchlorococcus at both sites (1.260.8 3 103 and 3.960.7 3 103cells mL21at GY and TZ, respectively).
Synechococcusabundance was 3-times higher at TZ compared to GY, accounting for 0.8% and 0.2% of total cells at each site, respectively. Likewise, the abundance of photosynthetic picoeukaryotes (PPE) was low at both sites (1.1460.033103 and 2.560.2 3 103cells mL21at GY and TZ, respectively), with TZ having 2.3-times more PPE cells than GY. PPE accounted for0.5% of the total cell population at both sites.
Finally, heterotrophic bacteria were enumerated as either high nucleic acid (HNA)- or low nucleic acid (LNA)-containing pop- ulations, the latter of which was more abundant (Table 1). The abundances of HNA and LNA cells were similar between the two sites (1.260.2 3 105 and 2.560.3 3 105 for HNA and LNA cells, respectively).
Despite the differences in physicochemical conditions and the composition of the microbial communities, the ini- tial concentrations of Chl a and rates of PP were similar at the two stations (Table 1). In contrast, maximum photo- chemical efficiency of PSII measured at excitation wave- length of 470 nm (Fv/Fm470) was higher at TZ (0.5160.01) than at GY (0.3460.02), while no significant difference was detected between stations with respect to functional absorp- tion cross-section of PSII (rPSII-470).
Phytoplankton Chlaconcentrations and PP rates
All tested N forms and Fe alone resulted in significant increases in Chla concentrations and rates of PP after 48 h of incubation at both locations, and the response at GY was in general larger than at TZ (Fig. 2). Additional nutrients (for example through the addition of Fe or filtered deep water, FDW) did not enhance the response observed for the N forms further.
The largest increases in concentrations of Chlaat TZ after 48 h of incubation were observed in response to urea and
NH14 additions (0.1960.01 lg L21), >3.5-times higher in comparison to the Control (no nutrient addition, Chlcnt, 0.05260.002 lg L21) (Fig. 2a). Addition of NO23 increased Chl a concentrations by 1.4-fold relative to Chlcnt at TZ. At GY, the urea addition resulted in the largest responses in Chl a concentration (0.1860.01lg L21) compared to the Chlcnt
(0.03460.003lg L21), followed by the NH14 and NO23 addi- tions (3-times higher relative to Chlcnt)).
Changes in PP were similar to the Chlaresponses in both experiments, with 4-times higher carbon fixation rates observed in response to additions of urea and NH14 at TZ (1.4060.07 lmol C L21 d21) and 8-times higher rates in response to urea at GY (1.360.1lmol C L21d21) in compar- ison to the Controls at 48 h (PPcnt; Fig. 2b). The NO23 addi- tion at TZ resulted in 2.5-times higher PP rates relative to the PPcnt. Both NH14 and NO23 yielded>5-times higher PP relative to the PPcntafter 48 h of incubation at GY.
In addition to stimulation by N substrates, the Fe addition alone produced a significant increase in Chlaconcentrations (40% increase over Chlcnt) and rates of PP (>20% increase over PPcnt) at both locations after 48 h of incubation (Fig. 2;
Supporting Information Table S2). However, the additions of NO231Fe (N1Fe) and FDW stimulated Chlaconcentrations and PP rates to the same degree as the NO23 addition alone at both stations (Fig. 2; Supporting Information Table S2).
Photophysiology
Use of FRRF to interrogate phytoplankton photophysiologi- cal responses (Fm, Fv/Fm, andrPSII) to nutrient amendments demonstrated that the phytoplankton community at both sites was affected by the addition of the individual N com- pounds, and the response was stronger and more variable at GY than at TZ (Fig. 3). Addition of Fe alone also had a stimu- lating effect on PSII activity; however, N1Fe did not have an additional stimulating effect compared to NO23 alone.
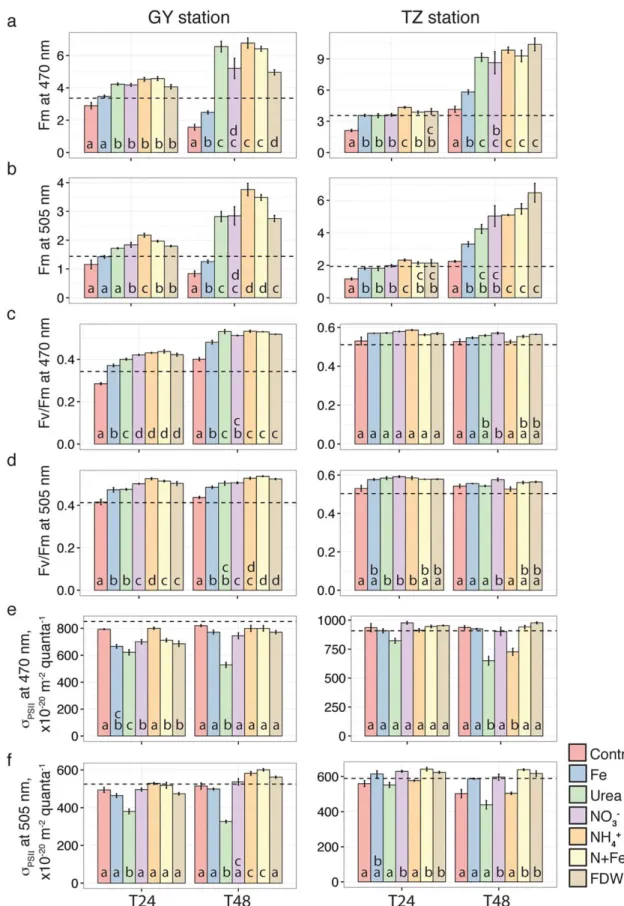
Fm at 470 nm (Fm470; inclusive of all Chl-containing plankton) increased significantly after 24 h of incubation in response to all N substrates in both experiments (Fig. 3). At TZ, all N sources resulted in a similar increase in Fm470rela- tive to the Control by 48 h. At GY, urea, NH14 and N1Fe all resulted in large increases in Fm470 (300%) compared with the Control by 48 h, while the increase in the NO23 and FDW treatments was slightly less (200%). Finally, Fe addition yielded a lower but significant (Supporting Information Table S3) increase in Fm470 (50% relative to the Control) by 48 h at both locations.
The addition of the various N substrates also stimulated phycoerythrin-containing phytoplankton (Fm505), but the responses to different N forms at the two locations varied (Fig. 3). Fm505 was significantly stimulated in the NO23 and NH14 treatments by 24 h at both stations while Fm505 increased in response to urea only at TZ. By 48 h at TZ, NH14, NO23, N1Fe, and FDW additions all increased the Fm505 response (>130%) relative to the Control (Fig. 3b). At
Shilova et al. N effects on microbial communities
8
GY, additions of NH14 and N1Fe resulted in a larger Fm505 response (>300% increase relative to the Control; Fig. 3b), while the responses to urea, NO23 and FDW were slightly less (>200% increase relative to the Control). Fe had a significant but weak effect on Fm505 by 48 h at both stations (Fig. 3b;
Supporting Information Table S3).
Fv/Fm was significantly influenced by all N forms and by Fe largely at GY. The initial Fv/Fm470 was higher at the TZ station (0.5160.01 and 0.3460.02 at TZ and GY, respec- tively). At GY, all N additions resulted in a significant increase in Fv/Fm470 in comparison to the Control by 24 h, with the highest (145%) increase in response to NO23 and NH14 (Fig. 3c). At TZ, only the NO23 addition resulted in a significant increase in Fv/Fm470 and only after 48 h (Fig. 3c;
Supporting Information Table S3). Similar to Fv/Fm470, the initial Fv/Fm505 at GY (0.4160.03) was lower than at TZ (0.5060.02). At GY, all N and Fe additions resulted in an increase in Fv/Fm505 similar to that of Fv/Fm470 (Fig. 3d).
However, in contrast to responses in Fv/Fm470, Fv/Fm505was weakly affected by the three N forms by 24 h at TZ.
The response observed for rPSII to the additions of urea and NH14 was anti-correlated with the responses observed for Chlaconcentrations and PP.rPSIIobserved at 470 nm signif- icantly decreased at TZ in response to the addition of both urea and NH14 relative to the Control (Fig. 3e); in contrast, rPSII decreased only in response to urea at the GY station.
Likewise, a significant decrease in response to urea was also observed forrPSIIat 505 nm but only at GY (Fig. 3f; Support- ing Information Table S3). A weak stimulating effect (<30%
of the Control) on rPSII was observed for phytoplankton with 505 nm excitation wavelength in response to N1Fe and FDW additions at GY and in response to N1Fe and NH14 at TZ (Fig. 3e,f; Supporting Information Table S3).
Responses of the phytoplankton and bacterial groups Phytoplankton and non-photosynthetic bacteria had dif- ferent qualitative and quantitative responses to N and Fe substrates, with variations depending on location.
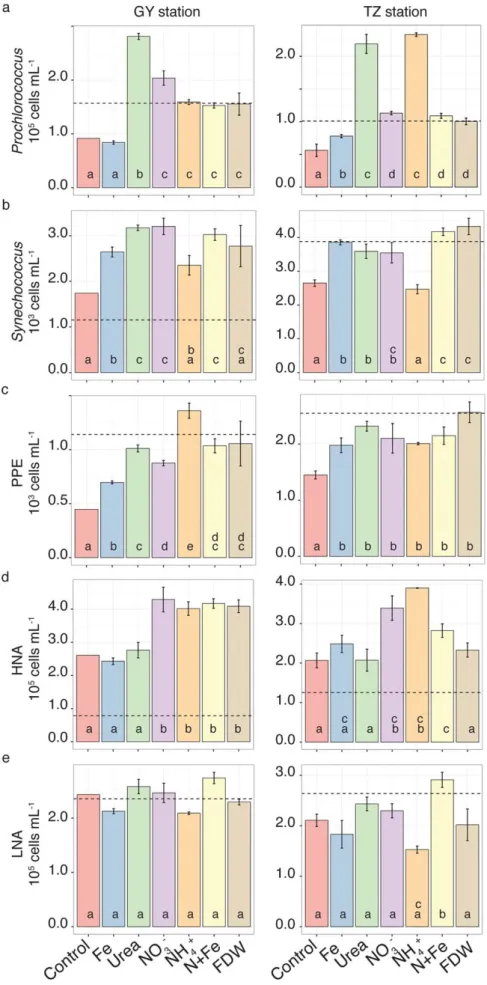
All N forms resulted in increases in Prochlorococcus abun- dance at TZ and GY (Fig. 4a). The largest response at TZ was Fig. 2.Phytoplankton community responses to N compounds and Fe additions at two stations in the NPSG. (a) Chlaconcentrations, (b) rates of
14C-PP measured after 48 h of incubation at the GY and TZ stations. The significantly different means (t-test, n53, p<0.05) are indicated with unique small letters where letter “a” indicates values not-significantly different from the control. FDW: 0.2lm filtered 600 m deep water. The dashed lines show measurements at T0 in the control (no amendments). The dotted and dotdash lines in (b) show measurements at T0 in the N1Fe and FDW additions, respectively.
Shilova et al. N effects on microbial communities
9
Fig. 3.Phytoplankton photosystem II physiology responses to N compounds and Fe additions in the NPSG. (a, b) Maximum in vivo fluorescence yield (Fm); (c,d) maximum photochemical efficiency of PSII (Fv/Fm); (e,f) functional absorption cross-section of PSII (rPII) measured at 470 nm (a,c, e) and 505 nm (b,d,f) excitation wavelength in response to nutrient additions at the GY and TZ stations. The dashed lines show measurements at T0. The significantly different means (t-test,n53,p<0.05) are indicated with unique small letters where letter “a” indicates values not-significantly different from the control. FDW: 0.2lm filtered 600 m deep water.
Fig. 4.Intergroup and spatial variability among phytoplankton and bacteria in responses to N compounds and Fe additions. Cell counts for (a)Syne- chococcus, (b)Prochlorococcus, (c) photosynthetic picoeukaryotes (PPE), (d) high nucleic acid containing bacteria (HNA) and (e) low nucleic acid con- taining bacteria (LNA) for all treatments measured 48 h after nutrient additions at the GY and TZ stations. The significantly different means (t-test, n53,p<0.05) are indicated with unique small letters where letter “a” indicates values not-significantly different from the control. FDW: 0.2lm fil- tered 600 m deep sea water.
observed in the NH14 and urea treatments (2.260.3 105cells mL21), where Prochlorococcus abundance was 4-times higher than in the Control after 48 h. In the NO23, N1Fe, and FDW treatments, Prochlorococcus abundance was 2-times higher than in the Control. At GY, urea produced the largest increase in Prochlorococcus abundance by 48 h (2.860.13105 cells mL21, 3-times higher than the Control) followed by NO23 with 2-times higher Prochlorococcus abundance compared to the Control. The effects of NH14, N1Fe, and FDW onProchlorococ- cusabundances were less (50% increase over the Control) at GY. Fe stimulated Prochlorococcus abundance at TZ (40%
increase over the Control) but not at GY.
Synechococcus abundance also increased significantly in response to the addition of urea, NO23, N1Fe, and Fe at both stations, and the response to N was greatest at GY (Fig. 4b).
Synechococcusabundances following the urea or NO23 additions were 3.560.5 and 3.260.3 3 103 cells mL21 (>1.3-times higher than in the Controls) at TZ and GY, respectively. Addi- tion of NH14 resulted in a decrease inSynechococcusabundance at TZ and only a small increase at GY; however, the effect was not significantly different from the Control by 48 h at either station (Supporting Information Table S4). Synechococcus abundance at both locations responded to Fe additions. While not significantly different from the effect of N at TZ, the Fe effect was significantly lower than the effects of urea and NO23 at GY (Supporting Information Table S4). Notably, addition of N1Fe resulted in a significantly higherSynechococcusresponse in comparison to Fe alone at both stations (Fig. 4b; Supporting Information Table S4).
PPE abundance increased significantly in response to all N forms and to Fe at both stations. Overall larger increases in PPE abundance were observed at GY (Fig. 4c) than at TZ.
NO23 resulted in a high degree of variability between the rep- licates at TZ, which contributed to a lower statistical signifi- cance (t(2)52.4,p50.06). PPE abundances in response to all N at TZ were 1.5-times higher than in the Control and were similar for all nutrients including Fe (average PPE abun- dance in all N and Fe additions was 2.160.4 3 103 cells mL21). At GY by 48 h, additions of NH14, urea, NO23, N1Fe, and FDW resulted in>100% increases in PPE abundance rel- ative to the Control and Fe-alone treatment (average 1.160.23103cells mL21in the N additions; Fig. 4c).
HNA abundance responded to additions of NH14, NO23, and N1Fe at both stations (up to 125% increase over the Control by 48 h, Fig. 4d). At GY, the HNA cells also increased to 1.5-times the Control in response to the FDW addition. The increase in HNA abundance at GY, but not at TZ, was significant by 24 h (Supporting Information Table S4). In contrast to the HNA cells, only the N1Fe addition at TZ station resulted in a significant increase (38% relative to the Control) in the abundance of LNA cells by 48 h (Fig. 4e).
No significant increase in the LNA cell abundance was observed at GY (Fig. 4e; Supporting Information Table S4).
Shift in microbial community composition
To further evaluate the effect of N on the microbial com- munities at these two sites, and to assess whether differences in microbial community composition accompanied the observed changes in PP, Chla, FRRF, and cell abundance, we amplified and sequenced the V3-V4 hypervariable region of the 16S rRNA gene. Based on the 16S rRNA gene relative abundances, the initial microbial community composition (Control T0) at the genus level was similar at both locations and was dominated by Cyanobacteria (genusProchlorococcus, 31–34% of total 16S rRNA gene sequences) and Alphaproteo- bacteria (family Pelagibacteraceae, 30–33% of total 16S rRNA gene sequences), followed by other Alphaproteobacteria (no taxonomic assignment, 7–8% of total 16S rRNA gene sequen- ces),Gammaproteobacteria(Halomonadaceae:C. Portiera, 5–7%
of total 16S rRNA gene sequences), andActinobacteria (Acidi- microbiales: OCS155, 2–3% of total 16S rRNA gene sequences) (Fig. 5a).Synechococcuswas a minor component of the micro- bial community at both locations (0.7% of total 16S rRNA sequences). Relative abundances of chloroplast 16S rRNA sequences varied between the two locations. At TZ, abundan- ces ofHaptophyceaeandStramenopileseach were 1.9% of total 16S rRNA gene sequences. At GY, relative abundances of Haptophyceae and Stramenopiles in the initial community were 1.1% and 0.8%, respectively.
A shift in microbial community composition at the genus level in response to all N additions was detected within 48 h in both experiments with the strongest response to NH14 (Fig.
5). Both Jaccard and Bray–Curtis ecological indices produced similar results (Fig. 5b, Supporting Information Fig. S1a). Dif- ferences in the Bray–Curtis dissimilarities between treatments were significant (difference of mean ranks between the groups R>0.77, p<0.001 in both experiments). At both locations, the response to all N forms was characterized by the increase in relative abundance of representatives from theGammapro- teobacteria families Alteromonadaceae and Oceanospirillaceae (Fig. 5a). At TZ, the relative abundance of Alteromonadaceae (unassigned genus) increased from 0.2% in the Control to 41%, 55%, and 57% of all reads in the urea, NH14, and NO23 additions at T48, respectively. At GY, the relative abundance ofAlteromonadaceae (unassigned genus) increased from 0.3%
in the Control to 15%, 34%, and 36% of all reads in the urea, NO23, and NH14 additions at T48, respectively. Relative abun- dance ofOleispira(familyOceanospirillaceae) increased signifi- cantly in the N additions, but only at GY: from 0.1% in the Control to 9%, 10%, and 20% of all reads in NH14, urea, and NO23 additions at T48, respectively. The relative abundance of another Oceanospirillaceae genus (Oleibacter) increased from undetectable in the Control to as much as 5% of all reads in the N additions at TZ. Addition of NH14 resulted in the most distinct microbial community, with the shift observed within 24 h at both stations (Fig. 5a,b). Relative abundance of 16S rRNA gene sequences from representatives of the genusPhaeo- bacter(Alphaproteobacteria:Rhodobacteraceae) were associated
Shilova et al. N effects on microbial communities
12
with the NH14 additions and increased from undetectable in the Control to 5% and 19% of all reads in the NH14 addition in both GY and TZ at T48, respectively (Supporting Information Fig. S1c). Addition of urea resulted in a less pronounced change in microbial community composition, especially at TZ. Finally, Fe addition did not significantly influence com- munity composition at both locations.
The shift in microbial community composition in response to all N forms at GY was faster than at TZ and detected by 24 h after the addition of nutrients (Fig. 5a,b). Samples taken 24 h after the start of the incubation experiment at TZ were most similar to the Controls and T0 samples. In contrast, T48 sam- ples from treatments with any N addition at TZ clustered sepa- rately from the T0 and T24 samples, Controls, and Fe addition treatment. At GY, all of the N addition treatments clustered separately from the Controls, T0, and Fe addition within 24 h.
Response of picocyanobacteria to N
Given the great genetic diversity within marine microbial genera (e.g., Kashtan et al. 2014), we examined changes in
abundance of individual taxa withinProchlorococcusandSyn- echococcus populations at high resolution by using an oligo- typing approach (Eren et al. 2013). The responses to different N forms and Fe varied between and withinProchlor- ococcusandSynechococcusgenera.
Prochlorococcuspopulations differed between the two loca- tions (Fig. 6a). A total of 31 oligotypes were identified inPro- chlorococcus communities across both experiments based on seven nucleotide positions with high entropy (as described in the Methods). The Prochlorococcuscommunities at TZ and GY were dominated by strains from the High Light I (HLI) and High Light II (HLII) clades, respectively. The oligotypes MED4-oligo1 (100% identical to Prochlorococcus MED4, HLI) and MIT9515-oligo1 (100% identical to Prochlorococcus MIT9515, HLI) were on average 74% and 10%, respectively, of all of theProchlorococcussequences in the Control T0 sam- ple at TZ (Table 2). At GY, these oligotypes comprised 1% of total Prochlorococcus sequences in the Control T0 (Table 2).
The most abundant oligotype at GY, MIT9301-oligo1 (100%
identical to Prochlorococcus MIT9301, HLII, and strains with Fig. 5.Nitrogen additions resulted in a shift in microbial composition by 48 h in the NPSG. (a) Microbial community composition based on the relative abundance of the 16S rRNA gene copy at the genus level in the experiments at the GY and TZ stations. Only top 30 abundant genera are listed. Each sam- ple represents a mean of 16S rRNA gene copy relative abundance from three replicates.uaindicates unassigned taxa. (b) PCoA on Bray–Curtis distance measures among the samples for heterotrophic microbial community composition at the GY and TZ stations.
Shilova et al. N effects on microbial communities
13
similar sequence of the 16S rRNA gene region, Supporting Information Table S1), comprised on average 66% of thePro- chlorococcus sequences. The next most abundant, the MIT9312-oligo1 oligotype (100% identical to Prochlorococcus MIT9312, HLII, and related strains, Supporting Information Table S1), was on average 22% of theProchlorococcussequen- ces at GY station. Both of the most abundant oligotypes at GY were<1% of the sequences in the Control T0 from TZ (Table 2). Representatives of the Low Light I (LLI) clade were present at both locations, although only as minor portions of the community (Table 2).
The addition of different N forms had differential effects on the Prochlorococcus populations in both experiments by 48 h (Fig. 6b–d). While urea addition resulted in a consistent increase in abundance of all Prochlorococcus oligotypes and
clades, NH14 and NO23 resulted in variable responses within the Prochlorococcus communities and between the two loca- tions. Differences in the Bray–Curtis dissimilarities for Pro- chlorococcus communities between treatments were higher than within treatments (analysis of similarities for TZ:
R50.36, p50.007, and GY: R50.51, p50.002, see Meth- ods). The Bray–Curtis dissimilarity index showed that urea and NH14 additions resulted in a shift in the Prochlorococcus community composition that was most distinct from the effects of the rest of the treatments and Controls at TZ, while the urea and NO23 additions resulted in the strongest shift in comparison to the effects of the rest of the treatments (and Controls) at GY (Fig. 6b). These patterns paralleled the gen- eral response of total Prochlorococcus abundance (measured by flow cytometry) and were observed for the most abundant Fig. 6.Differential responses of Prochlorococcusoligotypes to N compounds. (a) DistinctProchlorococcuscommunities were present at the GY (left panel) and TZ stations (right panel). Abundances ofProchlorococcusoligotypes, cells mL21(Y axis), were estimated based on 16S rRNA gene amplicon sequencing, oligotyping analysis, and cell counts. Oligotypes were assigned to Clade (X axis) and eStrain (legend) based on the highest nucleotide identity, where each eStrain represents a group ofProchlorococcusstrains with 100% nucleotide identity in the V3-V4 region of the 16S rRNA gene sequence. (b) PCoA analysis on Bray–Curtis distance indices forProchlorococcuscommunity composition at T48 as a function of nutrient addition at the GY and TZ stations. (c,d) Responses in abundance of the selectedProchlorococcusoligotypes to nutrients at T48 at GY (c) and TZ (d). The dashed line shows abundances of each oligotype at T0.
Shilova et al. N effects on microbial communities
14