Linked sediment and water-column methanotrophy at a man-made gas blowout in the North Sea: Implications for methane budgeting in seasonally stratified shallow seas
Lea Steinle,
1,2*Mark Schmidt,
2Lee Bryant,
2,aMatthias Haeckel,
2Peter Linke,
2Stefan Sommer,
2Jakob Zopfi,
1Moritz F. Lehmann,
1Tina Treude,
2,bHelge Niemannn
1,3*1Department of Environmental Sciences, University of Basel, Basel, Switzerland
2GEOMAR, Helmholtz Centre for Ocean Research, Kiel, Germany
3CAGE – Centre for Arctic Gas Hydrate, Environment and Climate, Department of Geology, UIT The Arctic University of Norway, Tromsø, Norway
Abstract
Large quantities of the greenhouse gas methane (CH4) are stored in the seafloor. The flux of CH4from the sediments into the water column and finally to the atmosphere is mitigated by a series of microbial methano- trophic filter systems of unknown efficiency at highly active CH4-release sites in shallow marine settings. Here, we studied CH4-oxidation and the methanotrophic community at a high-CH4-flux site in the northern North Sea (well 22/4b), where CH4 is continuously released since a blowout in 1990. Vigorous bubble emanation from the seafloor and strongly elevated CH4concentrations in the water column (up to 42mM) indicated that a substantial fraction of CH4bypassed the highly active (up to2920 nmol cm23d21) zone of anaerobic CH4- oxidation in sediments. In the water column, we measured rates of aerobic CH4-oxidation (up to 498 nM d21) that were among the highest ever measured in a marine environment and, under stratified conditions, have the potential to remove a significant part of the uprising CH4prior to evasion to the atmosphere. An unusual dominance of the water-column methanotrophs by Type II methane-oxidizing bacteria (MOB) is partially sup- ported by recruitment of sedimentary MOB, which are entrained together with sediment particles in the CH4
bubble plume. Our study thus provides evidence that bubble emission can be an important vector for the transport of sediment-borne microbial inocula, aiding in the rapid colonization of the water column by metha- notrophic communities and promoting their persistence close to highly active CH4point sources.
Even though large quantities of methane (CH4) are stored in the ocean seafloor as shallow and deep gaseous reservoirs, bound in CH4 hydrates or dissolved in pore water (Wall- mann et al. 2012), most recent estimates suggest that oceans account for only a minor fraction of natural CH4 emissions to the atmosphere (Kirschke et al., 2013; IPCC 2013). The
fact that the marine contribution is rather small can largely be attributed to a series of microbial CH4-oxidation filter sys- tems preventing large-scale CH4evasion into the atmosphere (Reeburgh 2007; Knittel and Boetius 2009; Kessler et al.
2011; Boetius and Wenzh€ofer 2013; Graves et al. 2015;
Steinle et al. 2015). In sediments, a large fraction (80% on average, Knittel and Boetius 2009) of uprising CH4 is oxi- dized through the sulfate-dependent anaerobic oxidation of methane (AOM, Eq. 1).
CH41SO224 !HCO231HS21H2O: (1) AOM is typically mediated by consortia of anaerobic metha- notrophic archaea (ANME) and sulfate-reducing bacteria (SRB; Boetius et al. 2000; Orphan et al. 2001; Niemann et al.
2006) though ANME may possibly mediate AOM without partner bacteria (Milucka et al. 2012). Furthermore, aerobic methane-oxidizing bacteria (MOB) consume part of the CH4
flux in oxygenated surface sediments (aerobic oxidation of
*Correspondence: lea.steinle@unibas.ch, helge.niemann@unibas.ch Present address:aDepartment of Architecture and Civil Engineering, University of Bath, Bath, UK
bDepartment of Earth, Planetary & Space Sciences and Atmospheric &
Oceanic Sciences, University of Los Angeles, Los Angeles, California
Additional Supporting Information may be found in the online version of this article.
Special Issue:Methane Emissions from Oceans, Wetlands, and Freshwater Habitats: New Perspectives and Feedbacks on Climate
Edited by: Kimberly Wickland and Leila Hamdan
and
OCEANOGRAPHY
Limnol. Oceanogr.00, 2016, 00–00 VC2016 Association for the Sciences of Limnology and Oceanography doi: 10.1002/lno.10388CH4– MOx; Eq. 2) and represent a second sedimentary filter (Niemann et al. 2006; Boetius and Wenzhofer 2013).€
CH412O2!CO212H2O: (2) These sedimentary filters, however, are less effective in sys- tems characterized by elevated advective fluxes of CH4 (Treude et al. 2003; Niemann et al. 2006; Knittel and Boetius 2009; Steeb et al. 2014). Globally, 0.02 Gt yr21 (3–3.5% of the atmospheric budget; Kirschke et al. 2013) of CH4is esti- mated to bypass the benthic filter systems and to be released into the ocean water column (Boetius and Wenzh€ofer 2013).
Within the water column, CH4 can be oxidized aerobically, or anaerobically in the rare case of ocean water column anoxia (Reeburgh 2007).
MOx is performed by MOB, generally belonging to the Gamma-(Type I) or Alphaproteobacteria (Type II) (Hanson and Hanson 1996; Murrell 2010). In oceanic waters, MOB typically belong to the Type I group (Elsaied et al. 2004;
Tavormina et al. 2013, 2010; Reed et al. 2009; Ha˚velsrud et al. 2011; Kessler et al. 2011; Steinle et al. 2015). The first step of MOx is catalyzed by the enzyme particulate or solu- ble methane mono-oxygenase (pMMO or sMMO, respective- ly; Semrau et al. 2010, and references therein).
Water-column MOx is the final sink for CH4 before its release to the atmosphere, where it acts as a potent
greenhouse gas; however, relatively little is known about the mechanisms and environmental factors controlling the spa- tiotemporal distribution and activity of pelagic MOB (Tavor- mina et al. 2010; Kessler et al. 2011; Mau et al. 2013;
Crespo-Medina et al. 2014; Steinle et al. 2015). Previous stud- ies showed that MOx and the distribution of Type I and Type II MOB in the oceans are controlled by CH4 and O2
concentrations (Kessler et al. 2011; Mau et al. 2013; Crespo- Medina et al. 2014) and trace metal availability (Semrau et al. 2010; Crespo-Medina et al. 2014). Furthermore, advec- tion of water masses harboring distinct microbial communi- ties can constrain prokaryote-biogeographic patterns (Wilkins et al. 2013). Current-induced water mass exchange at CH4 seeps, for example, has been shown to control the distribution of water-column MOx communities, thereby modulating the microbial CH4 filter capacity in the water column (Steinle et al. 2015).
Knowledge of the physical and biogeochemical controls on the activity and distribution of MOB is particularly important for our understanding of the role of shallow water environ- ments (e.g., shelf and coastal seas) in the global marine CH4
budget. In contrast to deep-sea environments, the distance between the seafloor and the atmosphere is short in shallow- water settings, leaving limited time/space for quantitative CH4 consumption to occur prior to its release to the atmo- sphere (Graves et al. 2015). This effect is amplified when ben- thic CH4flux rates are particularly high. Accidents during oil and gas exploration, for example, can lead to the release of excessive amounts of CH4 (and other hydrocarbons) to the ocean water column (Kessler et al. 2011; Sommer et al. 2015).
Elevated CH4evasion is also expected as a result of intensified CH4 hydrate destabilization and permafrost degradation in Arctic shelf environments in the future (Shakhova et al. 2010;
Biastoch et al. 2011; Ferre et al. 2012; Berndt et al. 2014); yet it is unknown to which extent the sediment- and water- column methanotrophic filter systems will be able to adapt to high CH4 fluxes, and hence to hinder excessive CH4 libera- tion to the atmosphere (James et al. 2016). In support of eval- uating future CH4 seepage scenarios at high-latitude shelf environments, present-day CH4 release sites in other shelf seas, such as those initiated or enhanced by drilling activities, provide a “natural” laboratory for studying the distribution and activity of methanotrophs, and thus the efficiency of the microbial CH4 filter in sediment and the water column in high CH4flux settings.
Extensive shallow gas accumulations occur in North Sea sediments (Judd and Hovland 2007), and one of the gas pockets at well 22/4b (hereafter referred to as the “Blowout,”
Fig. 1) was accidentally tapped during drilling operations in November 1990 (Leifer and Judd 2015). This caused a mas- sive blowout (Fox 1995), which left a 60-m wide crater behind (see below), with extensive amounts of CH4 being released from its center until today (Schneider Von Deimling et al. 2015). In this study, we assessed the impact of the
55°N
50°N 60°N
0° 5°E 10°E
5°W
Longitude
Latitude
57’
55’
56’
39’
38’
37’
reference CTD
Lat (57°N)
Lon (1°E)
2.2 km
50 m blowout
background sediment/BO2
a
b
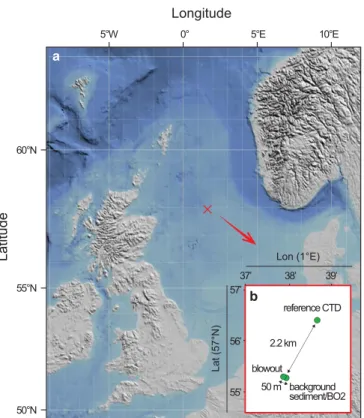
Fig. 1. (a) Location of the Blowout area (red cross) in the northern North Sea (sources: Esri, GEBCO, NOAA, and other contributors). (b) Sectional enlargement showing the relative location and distance (in km) of the different sampling sites. [Color figure can be viewed at wileyonlinelibrary.com]
persistent and vigorous seabed CH4release from the Blowout on the methanotrophic community in sediments and the water column. In an interdisciplinary approach combining biogeochemical and molecular tools, we confirm that a sta- ble and highly active AOM community may establish in ocean sediments within 20 years after seepage onset (Wil- fert et al. 2015). We further demonstrate that the aerobic methanotrophic communities in sediments and in the water column are linked. High water-column MOx rates are sup- ported by the bubble-plume–associated entrainment of sediment-borne MOB, which restock the water-column methanotrophic community and thus help to maintain a highly efficient aerobic water-column CH4filter.
Material and methods
Site description
The Blowout (57855.41’N and 1837.95’E, Fig. 1) is located in the northern North Sea at a water depth of 98 m (Fig. 2a) and consists of a 60 m wide and 20 m deep crater (for
details see, e.g., Schneider Von Deimling et al. 2007).
Although the vigorousness of the gas release has declined since the accident, the Blowout still releases more CH4
(mostly as bubbles, building spiral vortexes, Fig. 2b, Schneider Von Deimling et al. 2015) than any other natural seep in the North Sea (Rehder et al. 1998; Judd 2015). Based on stable carbon isotope analyses, the Blowout emits CH4of biogenic origin (d13C-CH4, ca. 275&; Sommer et al. 2015).
The water column above the Blowout is seasonally stratified, with a well-developed thermocline lasting from approxi- mately April until October/November when deep mixing is induced by the first fall storms (Nauw et al. 2015).
Throughout the duration of our study (July/August 2012), the water column above the Blowout was stratified with a well-developed thermocline at about 30 m water depth (Fig.
3b). In this area, hydrographic processes are highly dynamic with strong tidal currents changing direction approximately every 6 h (Nauw et al. 2015, and references therein).
Sediment sampling
Undisturbed surface sediments were recovered by push- coring with the remotely operated vehicle (ROV) KIEL 6000 (GEOMAR). Biogeochemical and microbiological investiga- tions were conducted at three different sites on parallel push cores sampled in close proximity (10 cm) to each other (Table 1). At the Blowout, we sampled sediments in the cen- ter of the crater (Fig. 2a,b; BOC), in close vicinity (0.5 m) to the emanation point of one of the two main bubble jets, and sediments from the Blowout crater wall (Fig. 2a; BOW).
Finally, we retrieved push cores at a background site 50 m to the southeast of the Blowout crater at a water depth of 99 m. Parameters measured at each sampling site are summa- rized in Table 1.
Water-column sampling
Water samples were recovered with a video-guided rosette sampler equipped with twelve 10-liter Niskin bottles and probes for continuous measurements of conductivity, temper- ature and pressure/depth (CTD rosette sampler; Linke et al.
2015; Table 2). Sampling casts with the CTD rosette sampler will be simply referred to as CTD casts in the following. Both the water within the crater and close to the seafloor was sam- pled with a 5-liter Niskin bottle mounted to the ROV since sampling with the CTD rosette was not possible. At the Blow- out, samples were collected along three surfaces with a grid size of about 2003200 m (Fig. 2): (i) bottom waters at 85 m below sea level (mbsl), (ii) the lower part of the thermocline at 42 mbsl, and (iii) the upper mixed layer at 11 mbsl above the thermocline. In the following, the different grids will be referred to as (i) bottom water (BW), (ii) thermocline (TC), and (iii) mixed layer grid (ML). We recovered 11 (ML grid) to 12 (BW and TC grid) discrete water samples from each iso- pycnal surface. Within the Blowout crater, we sampled crater waters1 m away from the bubble stream at 110 mbsl with the ROV (bottle 15BO1). One additional water sample atmosphere
bottom water (BW) CTD cast 0
70 60 50 40 30 20 10
80 90 98
120 115 105
110
thermocline (TC) CTD cast mixed layer (ML) CTD cast
N 5 m
)lsbm( htpeD
thermocline
net flux CH4
b a
BO1
BOC BOW
Fig. 2. (a) Schematic representation of the Blowout crater. Isopycnal surfaces for water-column sampling with the CTD are indicated at 11 mbsl (mixed layer, ML), 42 mbsl (thermocline, TC), and 85 mbsl (bot- tom water grid, BW), respectively. Sediment sampling locations in the center of the crater (BOC) and the crater wall (BOW) are indicated with a red cross. Crater water sampling location with the ROV (BO1) is indi- cated with a red circle. (b) Photograph of sediment sampling in the cen- ter of the crater next to a bubble jet. [Color figure can be viewed at wileyonlinelibrary.com]
(bottle 25BO2, 50 cm above the seafloor; 98 mbsl) was recovered with the ROV 50 m away from the crater (i.e., above the sediment background site). A reference CTD cast with Niskin bottle samples recovered from 11, 41, and 85 mbsl was conducted 2.2 km NNE of the Blowout crater. CH4 concentrations,d13C-CH4signatures and MOx rates (in quad- ruplicates) were measured in all samples. For CAtalyzed Reporter Deposition-Fluorescence In Situ Hybridization (CARD-FISH) analyses, we fixed four discrete samples from each CTD grid (Table 2; Fig. 6g–i). Additional CARD-FISH analyses were performed on aliquots from the BO1 and BO2 samples, and each depth of the reference CTD. For DNA anal- ysis, we combined 10–20 liter of water from two to four dif- ferent Niskin bottles (5 liter from each bottle) from each grid (Table 2; Fig. 6g–i). From the reference CTD, 20 liter of water from the thermocline was collected for DNA analysis. We could not subsample BO1 and BO2 for DNA analyses because of the limited amount of water in the ROV Niskin bottles.
The collected water was filtered through a single Whatman GF/F Glass Microfiber filter (4.7 cm ø, pore size 0.7 mm), and the filters were wrapped in aluminum foil and stored at 2208C until further analyses.
Sediment biogeochemistry
Sediments were subsampled for concentration measure- ments of dissolved CH4, sulfate (SO224 ), sulfide (H2S), and porosity. Immediately after recovery, 2 cm slices of push- core sediments were extruded with a plunger, and 3 mL were subsampled with a cut-off syringe and fixed in a saturated NaCl solution for headspace CH4 concentration measure- ments by gas chromatography with flame ionization detec- tion (GC-FID) according to Sommer et al. (2009). Five milliliter of wet sediment was sampled for porosity determi- nation by weight difference before and after freeze-drying and the remaining sediment slice (50 mL) was transferred to a low pressure-squeezer for pore water extraction. Pore
Temperature (°C)
6 8 10 12 14 16
r
MOx(nM d
-1)
200 400 600 100
60 40 20
0 80
Depth (mbsl)
8040 20
100 60 0
120
a b
BO1 ML
TC
BW
BO2
Fig. 3.(a) Sonar image of the Blowout gas flare (Simrad ER60, 38 kHz). (b) Temperature profile from the ROV-CTD and average water-column MOx rates, calculated from all replicates recovered from a specific depth. Niskin bottle or CTD cast grids are indicated (mixed layer (ML):n540, thermo- cline (TC):n543, bottom water grid (BW):n548, BO2:n54, BO1:n54). Error bars represent standard errors. [Color figure can be viewed at wileyonlinelibrary.com]
Table 1. List of sediment sampling locations and parameters measured during cruise CE12010.
Location IDs Position #PC
Length
(cm) Geochemistry
Rates/
microbiology
Sediment characteristics Blowout center BOC 57855.293’N 1837.859’E 3(2) 12–16 CH4, SO224 , H2S, por. AOM, SRR,
CARD-FISH, DNA
Clay,
layer of shells at ca. 8 cm Blowout wall BOW 57855.291’N 1837.856’E 4(3) 17–18 CH4, SO224 ,H2S, por. AOM, SRR,
CARD-FISH, DNA
Clay,
black layer between 4–9 cm Background site — 57855.270’N 1837.888’E 3(2) 18–20 CH4, SO224 , H2S, por. AOM, SRR,
CARD-FISH
Clay, no color change
#PCs denotes the number of total push cores taken at a sampling location. The number of push cores used for rate measurements or microbiological analyses are given in brackets. por.5porosity.
water samples were filtered through 0.45lm regenerated cel- lulose filters (Whatman) and aliquots were used for onboard analyses of sulfide (photometry of methylene blue; Grasshoff 1999). Dissolved SO224 concentrations were determined by ion chromatography onshore. Analytical details are described in Wallmann et al. (2006) and Haffert et al. (2013).
Water-column CH4concentrations and isotopic composition
Immediately after CTD/ROV recovery, water samples for CH4 concentration measurements were transferred into 100 mL serum vials and closed bubble-free with butyl rubber septa. Dissolved CH4 concentrations were determined using headspace extraction (Linke 2012). Briefly, we replaced 10 mL of water sample with argon and fixed the remaining water sample with 50 mL of saturated HgCl2-solution. CH4 concentrations were determined by GC-FID measurements onboard (Vielst€adte et al. 2015). Serum vials were then stored at 48C for subsequent stable carbon isotope measure- ments at GEOMAR by using continuous flow GC combustion-Isotope Ratio Mass Spectrometry (Thermo, MAT253; Vielst€adte et al. 2015). All isotope ratios presented here are reported in the conventional d-notation (i.e.,d13C- CH4) and normalized against the Vienna Pee Dee Belemnite (VPDB) standard. Analytical precision of the reported con- centrations and isotopic composition is63% and60.3&, respectively.
Methane-oxidation and sulfate-reduction rate measurements
Anaerobic CH4-oxidation (AOM) and sulfate-reduction (SR) rates in sediments were measured by ex situ whole-core incubation (Jørgensen 1977): small push cores were sub- sampled from the push cores amended with trace amounts of 14C-labelled aqueous CH4 solution (10 mL, 4 kBq, 150 nmol CH4, American Radiolabeled Chemicals) and 35S- labelled sulfate (25 mL, 20 kBq, American Radiolabeled Chemicals, USA), respectively. All incubations were con- ducted in triplicates for 24 h at in situ temperature (7–98C) in the dark. Incubations were either stopped by fixing extruded sediment slices (1–3 cm) in 20 mL 2.5% sodium
hydroxide (AOM) or in 20 mL 20% zinc acetate (sulfate reduction). CH4-oxidation rates were assessed by14CH4com- bustion (Treude et al. 2005), 14CO2-acidification and deter- mination of rest activity in the remaining sample (Blees et al. 2014). The first-order rate constant (k) was calculated from the fractional tracer turnover with consideration of
14C-label transfer into biomass:
kðAOM=MOxÞ5 ðACO21ARÞ ðACH41ACO21ARÞ31
t; (3)
whereACH4 is the activity of remaining14C-CH4after incuba- tion,ACO2 is the activity of the generated CO2,ARis the rest activity (biomass and non-carbonate intermediates), andt is the incubation time. We attribute methane oxidation in sediments to AOM because sediments were generally anoxic.
Yet, MOx may have contributed to methane oxidation in the top few millimeters of sediments, which may have been oxic (Niemann et al. 2006, 2009).
SR rates were determined with the cold-chromium distilla- tion method (Kallmeyer et al. 2004) to separate total reduced inorganic sulfur species (TRIS) from unreacted SO224 . Similar to AOM, the first-order rate constant of SR (kSR) was then determined from the fractional tracer turnover:
kSR5 ATRIS
ATRIS1ASO22 4
31
t31:06; (4)
whereASO22
4 is the remaining activity in the sulfate pool after incubation,ATRIS is the activity of the generated sulfide and associated sulfur species, t is the incubation time, and 1.06 the correction factor for the expected35S-isotope discrimina- tion (Jørgensen and Fenchel 1974). Samples for SR rates were not kept frozen until rates were measured, which may lead to an underestimate of the SR rates (Røy et al. 2014).
For water-column MOx measurements, water samples were transferred bubble-free into 22 mL crimp-top vials and sealed with bromobutyl stoppers (Helvoet Pharma), which have been tested not to impede MOx activity (Niemann et al. 2015). Samples were amended with 6mL of a Table 2. List of water-column sampling locations parameters sampled during cruise CE12010.
Location IDs Position
#Niskin bottles
Depth
(mbsl) Geochemistry
Rates/
microbiology Crater water BO1 57855.29’N 1837.85’ E 1 (ROV) 110 CH4(1),d13C-CH4(1) MOx(1), CARD-FISH(1) 0.5 m above sediment* BO2 57855.27’N 1837.89’E 1 (ROV) 97.5 CH4(1),d13C-CH4(1) MOx(1), CARD-FISH(1)
Upper mixed layer ML 57855.29’N 1837.85’E 11 (CTD) 10.9 CH4(11),d13C- CH4(11) MOx(11), CARD-FISH(4) DNA(1) Lower thermocline TC 57855.29’N 1837.85’E 12 (CTD) 41.5 CH4(12),d13C- CH4(12) MOx(12), CARD-FISH(4) DNA(1) Bottom water grid BW 57855.29’N 1837.85’E 12 (CTD) 84.5 CH4(12),d13C- CH4(12) MOx(12), CARD-FISH(4) DNA(1) Reference CTD refCTD 57856.41’N 1838.62’E 3 (CTD) 10.6/40.6/85.0 CH4(3),d13C-CH4(3) MOx(3), CARD-FISH(3) DNA(1)
*Sampled 50 m away from the crater above the background sediment site. Numbers in brackets (geochemistry, rates/microbiology) indicate number of samples taken per parameter.
14C-CH4:N2gas mixture (0.25 kBq,100 nmol CH4, Ameri- can Radiolabeled Chemicals) and incubated for 2 days at in situ temperature in the dark. Incubations were terminated by fixing the sample in butyl rubber sealed glass bottles with 1 g of solid NaOH, and bottles were stored at room tempera- ture until determination of ACH4, ACO2, and AR onshore. First order rate constants were determined analogously as for CH4- oxidation in the sediments. We attribute all water-column CH4-oxidation to MOx since the North Sea water column is generally well oxygenated (Queste et al. 2016). Quadruplicate incubations were performed for all MOx measurements.
Rates of AOM/MOx and SR were then calculated as
rAOM=MOx5k3½CH4; (5)
SRR5kSRR3SO224
3p; (6)
where½CH4is the concentration of CH4in sediments or the water column, respectively, at the beginning of the incuba- tion (plus the CH4 added by 14C-CH4 tracer injection),
SO224
is the sulfate concentration in the pore water, and q is the porosity of the sediment. All rate measurements were corrected for abiotic tracer turnover in killed controls.
CARD-FISH
Type I and II MOB in the water column were enumerated by CARD-FISH (Pernthaler et al. 2002). In addition, we tested for the presence of Type I and II MOB in surface sediment layers (0–
1 cm sediment depth (cmsd)) in the Blowout center- and the background sediment cores, and for the presence of ANME in sediment layers with maximal AOM rates (6–10 cmsd) of the core from the Blowout center. Fixation of water-column samples was carried out as described in Steinle et al. (2015) and references therein. CARD-FISH was performed as described by Schmale et al. (2015), except that Type I MOB were detected with a mix- ture of probes Mc705-HRP (horseradish peroxidase) and Mc84- HRP (0.3 ngmL21 each), and probe Ma450-HRP (0.6 ngmL21) was used for detecting Type II MOB (Eller et al. 2001). CARD- FISH in sediments was conducted according to Wilfert et al.
(2015). CARD-FISH staining of benthic Type I and II MOB was done as for water-column samples.
Molecular analyses
DNA was extracted from one quarter of a GF/F filter (Whatman, 4.7 cm ø, pore size 0.7 mm) for water-column samples (Woebken et al. 2007) or 0.5 g of wet sediment (Tables 1, 2) with the FastDNA SPIN Kit for soil (MP Biomed- icals) using a Precellys24 (Bertin Technologies) cell homoge- nizer. Partial 16S rRNA gene sequences of Type I and Type II MOB were amplified by PCR with the primer pairs MethT1dF/MethT1bR and 27F/MetT2R, respectively (Lane 1991; Murray et al. 1996; Costello and Lidstrom 1999; Wise et al. 1999). DNA extracts and amplification products were verified by electrophoresis in 0.8–2% (wt/vol) agarose gels with 0.001% (vol/vol) Midori Green DNA stain (Nippon Genetics) and quantified fluorometrically using Qubit
(Invitrogen). The community structure of surface sediments and the water column was investigated by denaturing gradi- ent gel electrophoresis (DGGE) following the approach of Tsutsumi et al. (2011). GC-clamped PCR products were sepa- rated on a 9% polyacrylamide gel with a linear denaturing gradient of a 40–70% (with 100% denaturants corresponding to 7 M urea and 40% (v/v) deionized formamide). Migration was done in a phorU-2 DGGE system (Ingeny International) at a constant temperature of 628C and a voltage of 130 V for 1 h, followed by 16 h at 75 V. The gel was stained in 300 mL TAE (Tris-acetate-EDTA buffer) containing 25 mL SYBR Safe (Invitrogen) for 30 min. Dominant bands were excised and DNA was extracted from gel slices with sterile, nuclease-free water at 48C overnight. Extracted DNA was re-amplified, cleaned (Wizard SV Gel and PCR Clean-up System, Promega) and finally cloned in E. coli JM109 using the pGEM-T Easy Vector System (Promega). Inserts were verified by direct clone colony PCR using KAPA2G Robust Polymerase (KAPA Biosystems) and primers SP6/T7. Purified amplicons were sent out for sequencing. Partial 16S rRNA gene sequences have been deposited in the ENA-EBI database under the accession numbers LT591861–LT591887.
Phylogenetic analysis
Phylogenetic analysis of the partial 16S rRNA gene sequences from isolated DGGE bands was performed in MEGA6 (Tamura et al. 2013). 16S rRNA gene sequences of the nearest uncultivated neighbors were identified and downloaded using SINA (Pruesse et al. 2012), completed by additional sequences of closely related cultivated bacteria as well as outgroup representatives. The sequences were aligned using the Muscle implementation of MEGA. The phylogene- tic relationship was inferred using the Maximum Likelihood method based on the Kimura 2-parameter model (Kimura 1980). Initial Neighbor-Joining tree(s) for the heuristic search were based on a pairwise distances matrix calculated with the Maximum Composite Likelihood method. The phyloge- netic analysis involved 35 (Type I)/34 (Type II) sequences.
Positions with less than 95% site coverage were eliminated from the analysis, resulting in 159 (Type I)/135 (Type II) positions in the final dataset.
Results
Sediments
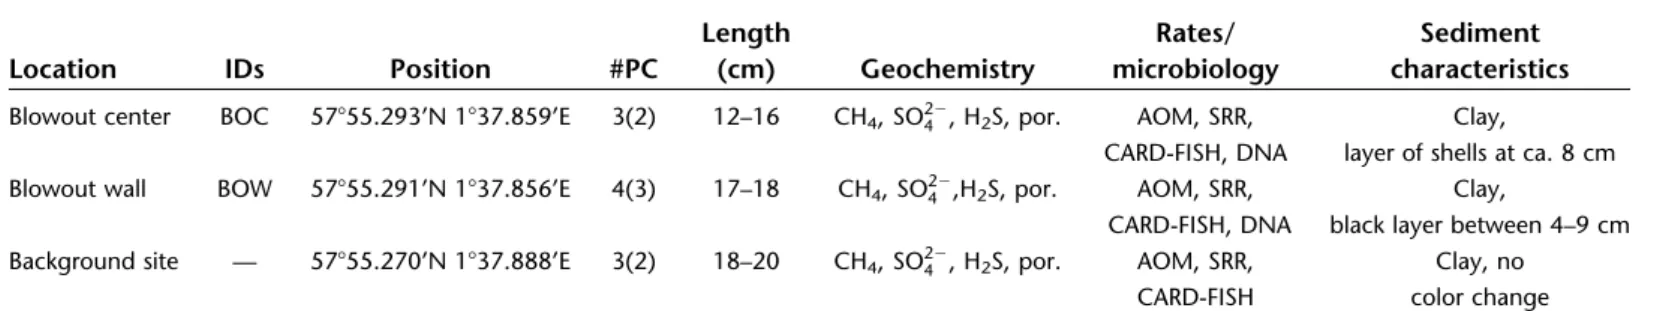
In sediments of the center of the Blowout, we found satu- rated CH4 concentrations (after retrieval at ambient pressure) without any clear downcore trends (Fig. 4a). Similarly, pore water sulfate concentrations were high (29.5 mM) and did not change substantially with depth. No sulfide was detected.
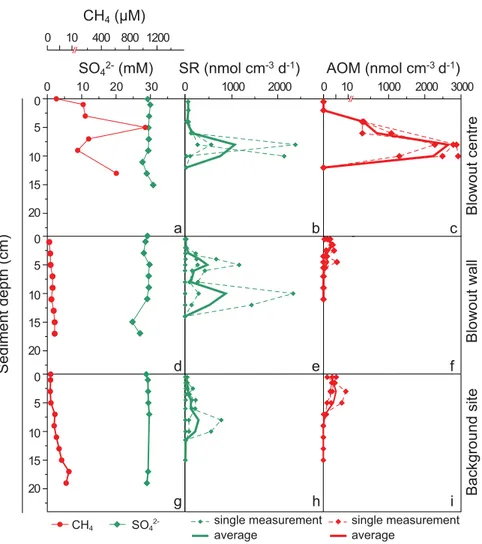
AOM and SR rates both peaked between 6 and 11 cmsd with rates of up to 2920 and 2380 nmol cm23 d21, respectively (Fig. 4b,c). At 6 cmsd, our CARD-FISH analyses revealed the presence of large aggregates, which only contained ANME-2 cells (6.6 3 107 cells cm23); however, potentially associated
SRB could not be observed (Fig. 5a,d). Additionally, some sin- gle cells of ANME-1 and23, and some cell-chains of ANME-1 were detected (all together<0.3 3107cells cm23). In surface sediments (0–1 cmsd), both Type I and II MOB were detect- able by CARD-FISH (8.0 and 8.43107cells cm23, respectively (Fig. 5b,c,e,f), while ANMEs were not detected in this layer. As sediments were anoxic and ANME cells were detected at 6 cmsd, we attribute methane oxidation in sediments primarily to AOM, with a potential contribution from MOx at the sedi- ment surface (Niemann et al. 2009).
In the Blowout wall sediment, CH4concentrations gener- ally increased with sediment depth (i.e., horizontal penetra- tion depth in the Blowout wall sediment core) reaching 3 mM at 17 cmsd; yet they were still 1000 times lower than in sediment cores retrieved from the crater bottom (Fig. 4d).
Sulfate concentrations decreased slightly from seawater concentrations (29.5 mM) to about 25 mM at 15 cmsd
(Fig. 4d). Sulfide could not be detected. We measured only very low CH4-oxidation rates in the upper section of the sed- iment core (6 nmol cm23d21 at 5 cmsd, Fig. 4e). In con- trast, SR rates were three orders of magnitude higher and showed a double-peak with maximum values of 1300 and 2400 nmol cm23 d21 at 5 and 10 cmsd, respectively (Fig.
4f). Note that slumping probably disturbed crater wall sedi- ments, which complicates further interpretation of this data.
At the background site 50 m away from the crater, downcore CH4concentrations increased only slightly, reaching8mM at the bottom of the core (17 cmsd, Fig. 4g), and were thus much lower than in nearby crater bottom sediments. Sulfate concen- trations were essentially invariant throughout the core and we could not detect sulfide (Fig. 4g). Methanotrophic activity was comparatively low (max. 9 nmol cm23d21, Fig. 4h) and similar to what was observed for the crater wall sediments. Compared to the other sediment sampling sites, SR rates were relatively CH4 (μM)
AOM (nmol cm-3d-1) SR (nmol cm-3 d-1)
SO42- (mM)
Sediment depth (cm) Blowout centreBlowout wall
a b c
d e f
0 5 10 15 20 0
0 10 400 800 1200
10 20 30 0 1000 2000 0 10 1000 2000 3000
CH4
average
single measurement
average
single measurement SO42-
Background site
g h i
0 5 10 15 20 0 5 10 15 20
Fig. 4.Sediment geochemical profiles and rate measurements from the bottom of the blowout crater (a–c), blowout wall (d–f), and background site 50 m away from the blowout (g–i). Replicate rate measurements are shown individually (dashed lines) and the average value is indicated as a thick, solid line. As sediments were anoxic, we attribute methane oxidation in sediments to AOM with potential contribution from MOx at the sediment sur- face (Niemann et al. 2009). [Color figure can be viewed at wileyonlinelibrary.com]
low, with values of<500 nmol cm23d21 (Fig. 4i). We found both Type I and Type II MOB in the upper 0-1 cm of the sedi- ment core with CARD-FISH.
Water column
Spatial variations of CH4concentrations andd13C-CH4 We detected the highest CH4 concentration of 42,097 nM within the Blowout crater, just adjacent to the main bubble
stream (BO1, Table 3). However, even higher concentrations can be expected closer to the bubble jets. Lower CH4concentrations were found in the bottom water grid (all concentrations
>500 nM; 37,233 nM maximum; Fig. 6c; Table 3) and within the thermocline (>50 nM; 13,526 nM maximum; Fig. 6b; Table 3). While we also found elevated CH4concentrations (1794 nM) in waters sampled0.5 m above the sediment background site (BO2, Table 3), we did not find indications for active CH4
a
d
c
f b
e
g
j
i
l h
k
Fig. 5.Micrographs of sediment samples from the Blowout crater bottom and from water samples. (a–f) Epifluorescence micrographs from crater bottom sediments and (g–k) from the bottom water grid (85 mbsl). Imagesa–c,g,hare stained with DAPI for total cell counts, andd-f,j,kwith Alexa488 for CARD-FISH using probe ANME-2-538 targeting ANME-2 (d), Mc705 and Mc84 targeting Type I MOB (e), or Ma450 targeting Type II MOB (f,j,k). (a,d) Image of sediment sample from 6 to 10 cmsd, and (b,c,e,f) from 0 to 1 cmsd. (i,l) Unstained transmitted light micrographs fromi, within the Blowout crater (BO1) andl, from the bottom water grid (85 mbsl) above the Blowout. Arrows indicate sediment particles. Scale bars represent 10mm.
seepage at this site (e.g., gas ebullition). In the mixed layer above the thermocline, CH4concentrations were comparably low (all
<20 nM), but even here they were at supersaturation levels (up to eightfold) with respect to the atmospheric equilibrium (2.5 nM).d13C-CH4values as low as271.1&were detected in crater waters next to the plume (BO1) and similarly negatived- values were measured in the bottom water grid (Table 3; Fig. 6f).
More variable and more positive d13C-CH4 values (up to 267.5&) were detected within the thermocline, particularly in samples with values at the lower end of the CH4concentration range (Fig. 6e). Samples collected further away from the crater (sample BO2) also showed a slight enrichment in13C (269.3&;
Table 3) when compared to BO1. CH4concentrations at the ref- erence CTD site were highest at 85 mbsl (221 nM) and decreased to 88 nM within the thermocline (Table 3).
Methane oxidation rates
The vertical distribution of MOx in the water column dis- played two maxima: One within the Blowout crater (BO1;
498 nM d21), and a second one at the thermocline (up to 262 nM d21; 49 nM d21on average; Fig. 3b, 6h, Table 3). In sample BO2, MOx rates were also elevated (up to 63 nM d21) while samples from the bottom water grid showed substan- tially lower rates with values <19 nM d21 (3.5 nM d21 on average; Figs. 3b, 6i). MOx rates in the mixed layer were low (<0.03 nM d21). Nevertheless, it has to be noted that, despite generally high CH4 concentrations measured in the bottom water grid and the thermocline, rates were variable, and below detection limit in several samples (Fig. 6, detec- tion limit ofk50.001 d21). All rates from the reference CTD were below detection limit.
MOB communities in the water column
The water-column MOB community within the crater, in the bottom water grid and the thermocline was mainly com- posed of Type II MOB (76–95% of all MOB, Fig. 5j,k, Fig. 7).
Highest cell counts of Type II MOB were observed within the crater (44.8 3 103 cells mL21; BO1; Fig. 7, Table 3) and in
* *
*
*
* *
* *
a
b
c
e d
f
g
h
i
55.37’
55.32’
55.27’
55.37’
55.32’
55.27’
55.37’
55.32’
55.27’
Latitude (57°N)
Longitude (1°E)
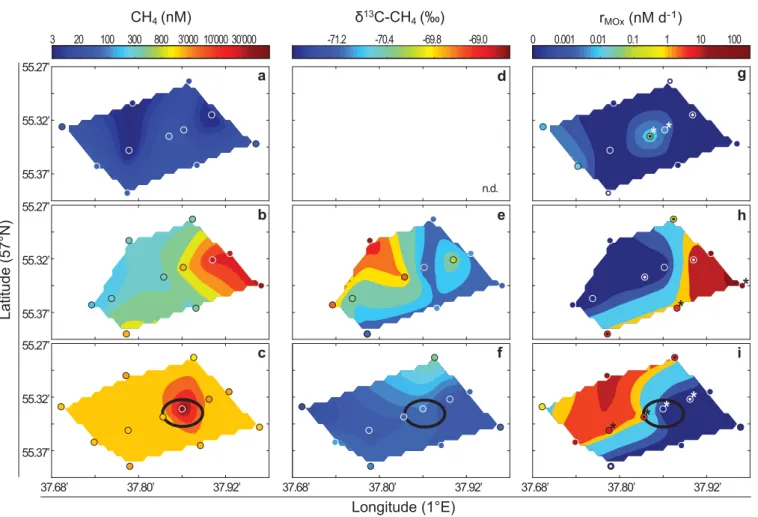
0 0.001 0.01 0.1 1 10 100
rMOx (nM d-1)
-69.0 -71.2 -70.4 -69.8
δ13C-CH4(‰)
37.68’ 37.80’ 37.92’
37.68’ 37.80’ 37.92’
37.68’ 37.80’ 37.92’
n.d.
3 20 100 300 800 3’000 10’000 30’000
CH4(nM)
Fig. 6.(a–c) Water-column CH4concentrations, (d–f)d13C-CH4values, and (g–i) MOx rates measured in the bottom water grid (c,f,i), the ther- mocline (b,e,h), and the mixed layer grids (a,d,g). Isolines were calculated from triangulation-based linear interpolation of measured values (indi- cated as circles). Locations, for which rate samples and parallel CARD-FISH samples were recovered are indicated with a dot in the center of the circles (g,h,i). Locations additionally sampled for DGGE analysis are indicated with a star (g,h,i). The position of the crater is indicated by a black oval in the bottom water plots. Relatively low CH4concentrations in the mixed layer (6a) precludedd13C-CH4measurements (detection limit20 nM).
the sample taken 50 m away from the crater (29.3 3 103 cells mL21; BO2; Table 3). In both the bottom water grid and the thermocline, average Type II cell numbers were0.5 3103cells mL21(Table 3), but 100-fold lower than within the crater. In contrast, average Type I MOB counts differed between the bottom water grid and the thermocline, with higher average cell numbers in the bottom water grid (0.15 3 103cells mL21) compared to the thermocline (0.033 103 cells mL21; Fig. 7, Table 3). No Type II MOB and only few Type I MOB (max. 0.02 3 103 cells mL21) were observed in the mixed layer (Table 3). MOB contributed up to 29% of total DAPI cell counts in the water column at the Blowout (29% BO1; 7.3% BO2; <0.3% bottom water grid, and ther- mocline; <0.01% mixed layer). We observed abundant sedi- ment particles on the filters of the BO1 (Fig. 5i) and BO2 samples, whereas only a few particles were present on filters from the bottom water grid (Fig. 5l) and none on filters from the thermocline.
In the reference CTD samples, no MOB were present, except for sporadic Type I MOB cells at the thermocline, where they constituted <1% of total DAPI cell counts (0.01 3103MOB cells mL21, Table 3).
DGGE and phylogenetic analysis of methanotrophs Community fingerprints of Type I MOB and other Gam- maproteobacteria from the Blowout crater surface sediments
(BOC 0–1, 1–2 cm and BOW 0–1 cm) were very similar to the one from the bottom-water sample (Fig. 8a). In contrast, the upper water column (thermocline and mixed layer) and waters from the reference CTD were characterized by DGGE band patterns that were distinct from the sediments and the bottom-water sample. However, while the mixed layer sample showed some similarity to the reference CTD sample, the band pattern of the thermocline sample was unique.
Phylogenetic analysis of cloned bands (Fig. 8b) revealed that the sequences BW_3 and BOC_3 were identical to a clone from the Haakon Mosby Mud Volcano (HMMVBeg-1;
AJ704654; Losekann et al. 2007). The BW_3/BOC_3 and the€ BOC_1 sequences grouped into the “Marine Methanotrophic Group I” or “deep sea-clade 1” (Fig. 8b; Ruff et al. 2013;
Tavormina et al. 2015). Sequences of BOW_1 and TC_2 also grouped within the Type I MOB, while all other sequences were more closely related to potentially methanotroph- related clones originating from the water column above cold seeps at the E-Atlantic continental margin (Tavormina et al.
2008). Among these, the sequences of BW_2 and BOC_2 were identical, as were BOC_3 and BW_3.
DGGE band patterns of Type II MOB and other Alphaproteo- bacteria were similar for both Blowout sediment samples (Fig.
9a). In contrast to the Type I DGGE gels, there was only one strong band in the water-column samples from the bottom water grid and the mixed layer (BW_6, ML_4, respectively) with Table 3. Overview of water depth, CH4concentrations,d13C-CH4values, MOx rates, MOx rate constants, and Type I and II MOB cell numbers in the water column.
Parameter:
Crater water (BO1)
0.5 m above sediment (BO2)
Bottom water grid (BW)
Thermocline (TC)
Mixed layer (ML)
Reference CTD (refCTD)
Water depth (mbsl) 110 97.5 85 42 11 11/41/85
max. CH4(nM) 42,097 1,794 37,233 13,526 21 221
min. CH4(nM) — — 523 57 <5 88
Sourced13C CH4
(gas bubble) (&)
274.8 — — — — —
max.d13C dissolved CH4(&)
271.1 269.3 269.9 267.5 NA —
max. MOx rate (nM d21)
498.4 (6159.6) 63.3 (65.4) 17.5 (618.1) 261.7 (618.7) 0.03 (60.01) 0
Average MOx rate (nM d21)
— — 3.5 49 0.006 —
max. k (31022d21)
1.2 (60.4) 3.5 (60.3) 1.9 (62.0) 2.9 (62.5) 0.2 (60.1) 0
average k (31022d21)
— — 0.5 (60.7) 1.1 (61.3) 0.04 (60.06) 0
max. Type I MOB (3103cells mL21)
0.7 0.8 0.3 0.08 0.05 0.01
max. Type II MOB (3103cells mL21)
44.8 29.3 1.3 0.9 — —
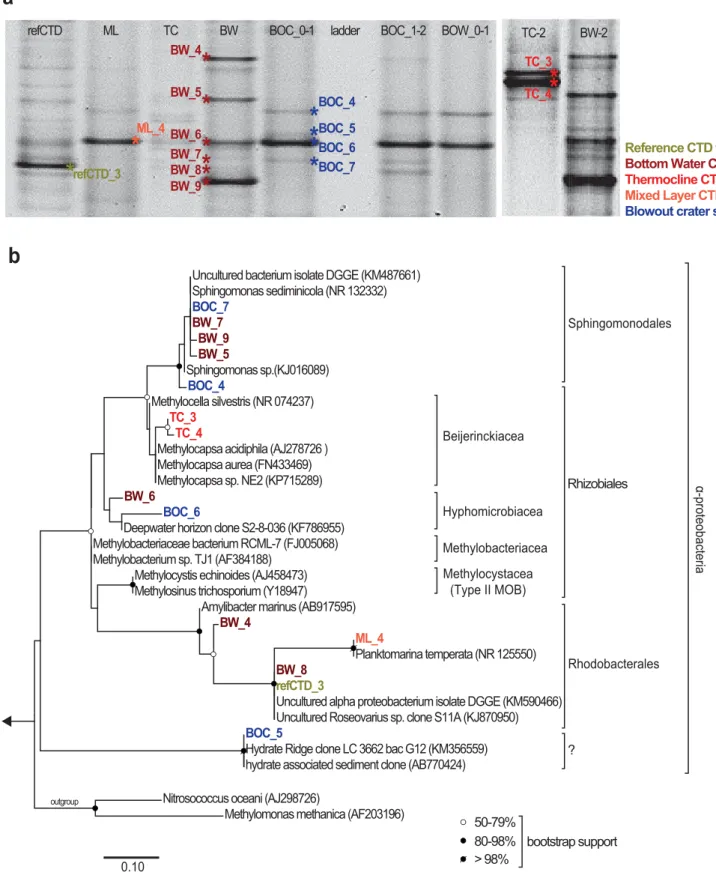
the same migration distance as a band from the sediments (BOC_6). With this exception, the band patterns of water- column samples differed from those of the sediment samples.
Additionally, the band pattern of all water-column samples did not show a substantial degree of similarity. Sequencing of excised bands and subsequent phylogenetic analyses grouped most sediment and water-column sequences into either the Sphingomonadales or Rhodobacterales clade (Fig. 9b). No sequences were related to the groups conventionally defined as Type II MOB (including only the genus Methylosinus and Meth- ylocystis). However, the sequences from the thermocline (TC_3, TC_4) were closely related to known (obligate) MOB (Methylo- capsa sp.) belonging to the family Beijerinckiaceae (Marın and Ruiz Arahal 2014). BOC_5 grouped with uncultivated bacterial clones from gas-hydrate-influenced areas; furthermore, sequen- ces of bands BW_6 and TC_4 showed a relatively high degree of similarity (99%) when compared to a clone sequence from the water column found in the Gulf of Mexico after the Deepwater Horizon oil spill (S2-8-036; KF786955). The sequences obtained from the faint bands of the bottom water grid (BW_7) and the Blowout sediment sample (BOC_7) were identical, and grouped in the Sphingomonodales clade.
Discussion
CH4seepage at the Blowout was triggered as a result of a drilling accident in 1990, during which a shallow gas pocket was tapped. Vigorous seepage mainly in the form of CH4- bubble plumes emanating from the crater’s center has been observed during every investigation of the Blowout
(Fox et al. 1995, Rehder et al. 1998, Schneider Von Deimling et al. 2007, Schneider Von Deimling et al. 2015), suggesting uninterrupted seepage since 1990. The Blowout is thus an ideal model system to study the developmental state and activity of CH4-oxidizing communities, as well as the spatial distribution of microbial CH4-oxidation (AOM and MOx) at highly active CH4point sources in shallow shelf seas.
AOM in sediments
Two decades after the onset of seepage, our investigations revealed a distinct AOM horizon between 5 and 10 cm sedi- ment depth at the Blowout crater bottom with ex situ rates that are similar to the highest known AOM activities in the marine environment (e.g., Hydrate Ridge: Boetius et al. 2000;
Treude et al. 2003; Black Sea: Treude et al. 2007). Wilfert et al.
(2015) found similar (though potential) AOM rates in an in vitro slurry experiment from Blowout crater sediments recov- ered in 2011. Our ex situ observations thus confirm the devel- opment of a highly active AOM community within only two decades after the onset of gas seepage (Wilfert et al. 2015).
Despite the highly active AOM community at the Blowout, only a small fraction of CH4is retained by the sediment CH4
filter, as becomes obvious when considering the high dissolved CH4concentrations at the sediment water interface and in the water column (Figs. 4, 6; Table 3). The role of SRB in AOM at the Blowout, however, remains unclear. SR and AOM rates dis- played similar trends and were of the same order of magni- tude, indicating that SR was most likely AOM-dependent (Knittel and Boetius 2009). Yet, we only found large ANME-2 aggregates without any obvious association with SRB (Wilfert et al. 2015), which is rather atypical for sediments character- ized by high rates of AOM (Boetius et al. 2000; Michaelis et al.
2002; Niemann et al. 2006). The physical association of ANMEs and SRB, thermodynamic constraints of the AOM reac- tion (Boetius et al. 2000; Orphan et al. 2001; Treude et al.
2003), and molecular indications for direct electron transfer from ANMEs to SRB (McGlynn et al. 2015) suggests that ANMEs carry out CH4-oxidation with the SRB as syntrophic partners, where the SRB mediate the reduction of sulfate as the terminal electron acceptor (Knittel and Boetius 2009). On the other hand, a study on an AOM enrichment culture showed that ANMEs may perform complete AOM by them- selves (Milucka et al. 2012). Our observations of solitary ANME cells and aggregates supports putative evidence from natural environments that AOM can indeed be performed independent of an obligate SRB partner (see also Orphan et al.
2002; Niemann et al. 2005; Maignien et al. 2013). In contrast to sediments of the Blowout center, the Blowout-wall and background-site sediments were only moderately affected by CH4 bubble emanations and dissolved CH4 seepage (i.e., low CH4 concentrations and low CH4-oxidation rates restricted to the uppermost 5 cm, Fig. 4), underscoring that CH4flow is strongly focused within the Blowout crater bottom sediments (Schneider Von Deimling et al. 2015, and references therein).
MOB (cells mL-1) Depth (mbsl) 80
40 0
120 60 20
100
105 103
102
101 104
TC
BO2 BO1 BO1
BO2 ML
BW
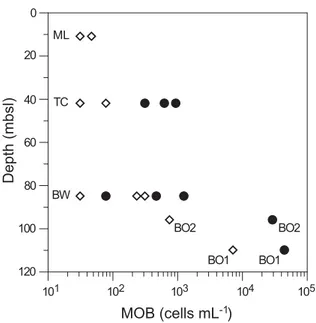
Fig. 7.CARD-FISH cell counts of Type I (open diamonds) and Type II (filled circles) MOB in the water column. Niskin bottle or CTD cast grids are indicated (BW5bottom water grid, TC5thermocline, ML5mixed layer). Samples without any detectable Type I or Type II MOB are not shown.
Vibrio sp. (AY332564)
Methylococcus capsulatus (AJ563935) Methylocaldum marinum (AB894129)
methanotroph-related water column clone 6A (EU444849) methanotroph-related water column clone 10A (EU444847) methanotroph-related water column clone 5H (EU444848)
refCTD_1
TC_1 BOC_2 BW_2 BOC_3 BW_3
BOC_1
BOW_1 TC_2
methanotroph-related water column clone 10H (EU444845) ML_2
refCTD_2 ML_3 ML_1
Methylosphaera hansonii (U67929)
Haakan Mosby mud volcano clone HMMVBeg-1 (AJ704654)
methanotrophic endosymbiont of Bathymodiolus mauritanicus (HE963013) methanotrophic endosymbiont of Bathymodiolus japonicus (AB036711) Golf of Cadiz mud volcano clone GoC Bac 36 D1 C0 M0 (FJ813558) New Zealand cold seep clone NZ 309 Bac25 (JF268402)
Methyloprofundus sedimenti strain WF1 (KF484906) Methylobacter marinus (AF304197)
Methylomonas methanica (AF304196)
methanotrophic epibiont Shinkaia crosnieri clone setae 2 18 (AB981819)
Methylomicrobium pelagica (X72775) Methylophaga marina (X95459)
New Zealand cold seep clone NZ 315 Bac89 (JN885062) Haakan Mosby mud volcano clone HMMVCen-13 (AJ704666)
b
MMG 1
MMG 3
? type X type I
outgroup
*
*
*
* *
*
*
**
* * *
**
TC_1
BOC_3 BOC_1 BOC_2
refCTD_2 refCTD_1
BW_1
BW_3 BW_2
ML_3 ML_2 ML_1
TC_2
BW ML BOC_0-1 BOC_1-2 BOW_0-1
refCTD TC ladder
BOW_1
0.10
50-69%
70-90%
> 90%
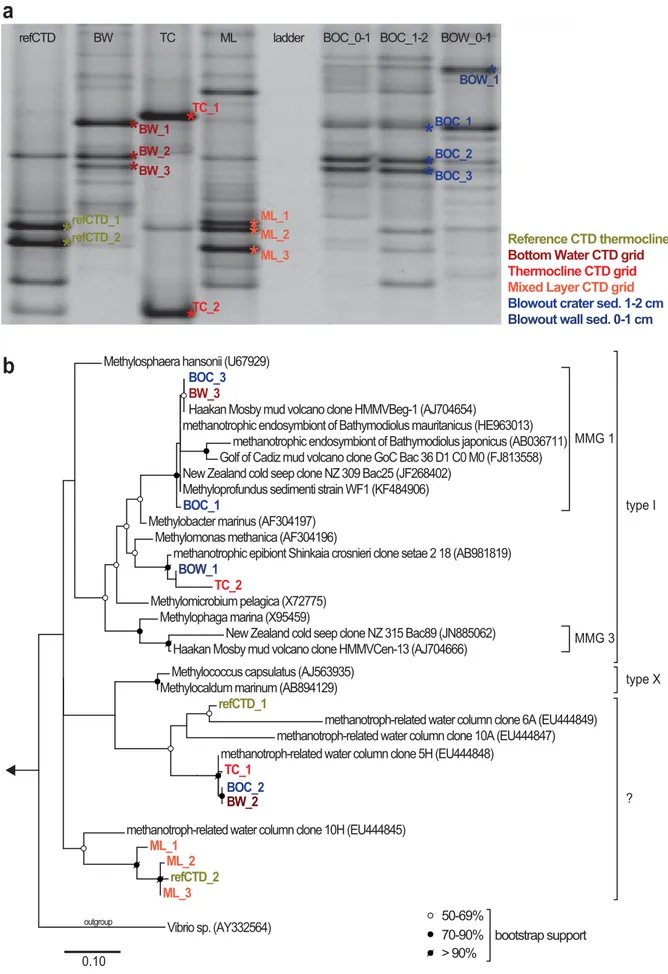
bootstrap support Thermocline CTD grid
Blowout wall sed. 0-1 cm Blowout crater sed. 1-2 cm Reference CTD thermocline Bottom Water CTD grid Mixed Layer CTD grid
Fig. 8.(a) DGGE community fingerprints of Type I MOB and other Gammaproteobacteria at the different sampling sites. Sample names are indicated (BOC5Blowout crater push core, BOW5Blowout wall push core, BW5bottom water grid, TC5thermocline, ML5mixed layer, refCTD5reference CTD). (b) Maximum likelihood tree based on partial 16S rRNA gene sequences showing the phylogenetic affiliation of sequenced DGGE bands (indi- cated with a star and a label on the DGGE gels) with closely related cultivated MOB and sequences of uncultivated close relatives from comparable
Methane oxidation in the water column
CH4concentrations in the water column above the Blow- out (up to 42 mM) were comparable to other catastrophic CH4-release sites, such as the Deepwater Horizon oil spill site (Kessler et al. 2011; Crespo-Medina et al. 2014), or anoxic marine basins (Reeburgh et al. 1991). Water-column CH4
concentrations at other highly active marine seeps, e.g., at hydrothermal vents at the Juan de Fuca Ridge (deAngelis et al. 1993), cold seeps in the Santa Monica basin (Mau et al.
2012), at Hydrate Ridge (Heeschen et al. 2005), and at the Svalbard continental margin (Steinle et al. 2015), are general- ly 1–2 orders of magnitude lower. The highest CH4 concen- trations at the Blowout (i.e., [CH4]>5000 nM, Fig. 6b,c) seem to be constrained to waters most directly influenced by the main bubble plume (Schneider Von Deimling et al.
2015; Sommer et al. 2015). The horizontal extension of the plume can be estimated from the highest CH4 concentra- tions located in the eastern part of the CTD grid (Fig. 6b,c).
In line with results from data from 2011 (Sommer et al.
2015), bottom water grid samples (Fig. 6c) showed ubiqui- tously high CH4 concentrations (900 nM), and thus a strong lateral influence of the plume, possibly driven by density-driven recirculation of CH4-rich waters ascending with the main bubble plume (Schneider Von Deimling et al.
2015, Wilson et al. 2015). At the thermocline, the impact of the bubble plume on CH4-concentrations seems reduced and less constant (CH4-concentrations as low as 50 nM; Fig. 6b).
See Sommer et al. (2015) and Schneider Von Deimling et al.
(2015) for a detailed discussion on lateral plume extension.
At the Blowout, >95% of the uprising CH4 seems to be trapped below the thermocline (Schneider Von Deimling et al. 2007; Sommer et al. 2015), so that relatively little CH4
reaches the mixed layer (see Fig. 6a). Yet, the fate of the uprising CH4 is not completely certain. The enrichment of
13C of thermocline CH4relative to the source CH4(Table 3;
Fig. 4d–f) is consistent with C-isotope fractionation during partial CH4-consumption by MOx (Whiticar 1999) and implies that a fraction of seep-derived CH4is oxidized in the water column. However, the rather subtle increase in d13C suggests that13C-enrichment during MOx is counteracted by the continuous resupply of CH4 with a low d13C-signature.
In light of the very high water-column CH4 concentrations, mixing with atmospheric CH4 (about 247&; NOAA-ESRL network) can be excluded to cause the observed13C-isotopic enrichment in the residual CH4 pool, leaving partial con- sumption by water-column MOx as the most likely explana- tion for the elevated methaned13C within the thermocline.
The MOx rates in the Blowout water column (Figs. 3b, 6g–i) are among the highest values reported for marine envi- ronments (Reeburgh 2007; Mau et al. 2013; Steinle et al.
2015). They lie within the same range as rates detected in the anoxic basin of the Black Sea (Reeburgh et al. 1991) and the Gulf of Mexico water column following the Deepwater Horizon oil spill (Kessler et al. 2011; Crespo-Medina et al.
2014). Two rate maxima were observed within the water col- umn, one within the crater and the second one at the ther- mocline (Fig. 3b), indicating more favorable conditions for MOx in these water layers. Previous studies found that important factors controlling MOx are (1) CH4 availability, (2) trace metal abundance, and/or (3) changes in the abun- dance of MOB bacteria caused by water mass exchange (Semrau et al. 2010; Kessler et al. 2011; Mau et al. 2013;
Crespo-Medina et al. 2014; Steinle et al. 2015).
1. CH4 availability. Low CH4 concentrations may explain the overall low MOx rates in the mixed layer; and the high variability of MOx rates in the thermocline may to some extent be related to variable CH4 concentrations (Fig. 6). However, even though very high CH4 concentra- tions were observed both in the bottom water grid and in crater waters, MOx rates were much lower in the bottom water grid compared to crater waters. The overall rather poor correlation between CH4 concentrations and MOx (R2-values<0.2; data not shown) implies that the ambient CH4 concentrations are not the major control on MOx activity in these water layers.
2. Trace metal abundance. No water-column trace metal data are available for the Blowout area. However, within the crater and the plume above, it seems plausible that sediment mobilization can increase the concentration of trace metals that are important for MOB (i.e., Cu, Fe;
Semrau et al. 2010) and thus stimulate MOx in the water column (see section below “Type II methanotrophs in the water column” for further discussion).
3. Water mass transport. The space within the Blowout cra- ter is partly shielded against tidal influences/currents, pro- viding relatively stable conditions. We also detected a constant supply of MOB from surface sediments to the water column within the crater (see section below
“Sediment-borne MOB fuel the water-column MOx filter”).
Combined, these factors appear to warrant conditions conducive to MOB community development and thus high MOx rates (Steinle et al. 2015). A similar situation seems to apply to thermocline waters, where CH4is being trapped during density stratification. Yet, the rather vari- able CH4concentrations (Fig. 6b) suggest a stronger influ- ence by lateral advection (Sommer et al. 2015). At seeps offshore Svalbard, lateral transport of water-column MOB away from the CH4 point source was found to reduce water-column MOx activity (Steinle et al. 2015). In com- parison to the crater, the more variable conditions at the Blowout’s thermocline may thus explain the fluctuating MOx rates in this water layer (Fig. 6h).
Sediment-borne MOB fuel the water-column MOx filter Sediment particles on the filter from the Blowout crater water sample (Fig. 5i) and, though less abundant, on filters from the bottom water grid (Fig. 5l) indicate that sediment
is entrained in the bubble plume and transported into the water column. Our DGGE and phylogenetic analysis revealed several bottom water sequences (BW_2, BW_3, BW_7), which were identical to sequences from crater surface sediments (BOC_2, BOC_3, BOC_7; Figs. 8, 9) providing evidence that mobilized sediments provide a vector for transporting ben- thic microbes into the water column. The distribution of sediment particles in the water column paired with the iden- tity of pelagic vs. benthic microbes thus suggests that MOB, maybe in immediate association with sediment particles, were transported at least 40 m up into the water column.
The elevated MOx rates in the bottom water grid samples are likely supported by the ebullition-aided dispersal of sediment-borne MOB, which seem to continuously re-stock the MOx filter in the water column. A recent study by Schmale et al. (2015) described the entrainment of MOB by bubbles at the Rostocker seep site (Coal Oil Point seep field, California) as “bubble transport mechanism”; however, the bubble stream with the entrained microbes was captured only 15 cm above the sediment surface. Here, we confirm that mobilization of sediment microbes into the water col- umn can play an important role for inoculating the water column. In addition, we demonstrate for the first time that
“bubble plumes” can transport microbes over much larger vertical distances, thereby linking benthic and pelagic bacte- rial communities. Although other work at cold seeps could not find similar MOB communities in sediments and in bot- tom waters (Tavormina et al. 2008), our study suggests that transport of benthic microbes far into the water column may be a globally important mechanism that shapes the regional microbial biogeography (Schmale et al. 2015).
Type II methanotrophs in the water column
Results from earlier studies suggest that aerobic MOB in marine habits almost exclusively belong to Type I MOB (Elsaied et al. 2004; Tavormina et al. 2013, 2010; Reed et al.
2009; Kessler et al. 2011; Ha˚velsrud et al. 2011, Steinle et al.
2015). In some marine studies, Type II MOB were observed, but in all cases they constituted only a small part of the methanotrophic community (Wang et al. 2004; McDonald et al. 2005; Hamdan et al. 2011). So far, Type II–dominated MOB communities seem to be restricted to certain freshwater systems, e.g., some arctic lakes (He et al. 2012), soils (Henckel et al. 2000), and rice fields (Bodelier et al. 2000;
Macalady et al. 2002). Our finding of a Type II–dominated MOB community in the water column at the Blowout (Fig.
9) is thus unique. The recruitment from the sediments (where both Type I and II MOB were detected, Table 3; Fig.
5) provides a stock of both types of aerobic MOB to bottom waters, which explains the presence of Type II MOB in the bottom water grid. However, it remains unclear as to why the thermocline MOB community at the Blowout is domi- nated by Type II MOB. Very little is known about factors selecting for this group of MOB. Hanson and Hanson (1996)
suggested that Type II MOB are better adapted to high CH4
concentrations, which agrees with more recent environmen- tal observations (Bodelier et al. 2000; Henckel et al. 2000;
Macalady et al. 2002; Kessler et al. 2011; He et al. 2012).
Besides CH4 concentrations, the availability of copper and iron (which are present in the reaction centers of the soluble and particulate MMO, respectively) may also influence expression, enzyme activity, and ultimately the community structure of MOB. For example, pMMO has been found to be less expressed under copper limitation compared to sMMO (Murrell 2010). While Type II MOB often have the ability to express both, pMMO and sMMO, most Type I MOB synthe- size only the particulate form of MMO (Semrau et al. 2010, and references therein). We did not measure water-column trace metal concentrations, so that we can only speculate whether the water column at the Blowout is depleted in cop- per, which could potentially limit the expression of pMMO and thus give competitive advantage to Type II MOB over Type I MOB. We propose that elevated levels of CH4 in the water column paired with potential copper limitation (to be confirmed by future work) constitute important selection mechanisms for Type II MOB at the Blowout.
Diversity of MOB in the blowout area
Phylogenetic analyses revealed strong differences between the MOB and phylogenetically related communities in the bottom water grid, the thermocline, and the mixed layer. As for Type I MOB, we found several sequences from the bot- tom water grid (and from the Blowout crater sediment) that were closely related to known MOB of the “Marine Methano- trophic Group I” or “deep-sea clade 1.” These sequences are thus originating from obligate MOB (Tavormina et al. 2008;
Ruff et al. 2013). Similarly, two sequences from the bottom water grid and the thermocline at the Blowout are also likely to originate from bacteria mediating MOx, since they were closely related to a methanotrophic epibiont from a deep-sea crab (Watsuji et al. 2014). In addition to sequences related to known obligate MOB, we found several sequences that were closely related to putatively methanotroph-related bac- teria previously found in the water column at cold seeps off the US West Coast (Tavormina et al. 2008). Their occurrence at the Blowout, and at two other CH4-rich environments (Eel River Basin and Santa Monica Basin; Tavormina et al.
2008) may indicate an involvement of these organisms in hydrocarbon degradation.
The Type II MOB recovered from the water column belong to the order Rhizobiales within the class Alphapro- teobacteria and, therein, to two genera of the familyMethylo- cystacea:MethylocystisorMethylosinus. Two additional genera, Methylocella and Methylocapsa within the order Rhizobiales, were recently identified as obligate methanotrophs, but are not considered traditional Type II MOB as they belong to the family Beijerinckiacea and not to Methylocystacea (Marın and Ruiz Arahal 2014). The identified sequences from the