Thaumarchaeal ecotype distributions across the equatorial Pacific Ocean and their potential roles in nitrification and sinking flux attenuation
Alyson E. Santoro ,
1,a* Mak A. Saito,
2Tyler J. Goepfert,
2,bCarl H. Lamborg,
3Chris L. Dupont,
4Giacomo R. DiTullio
51Horn Point Laboratory, University of Maryland Center for Environmental Science, Cambridge, Maryland
2Department of Marine Chemistry and Geochemistry, Woods Hole Oceanographic Institution, Woods Hole, Massachusetts
3Department of Ocean Sciences, University of California, Santa Cruz, California
4J. Craig Venter Institute, San Diego, California
5Hollings Marine Laboratory, College of Charleston, Charleston, South Carolina
Abstract
Thaumarchaea are among the most abundant microbial groups in the ocean, but controls on their abun- dance and the distribution and metabolic potential of different subpopulations are poorly constrained. Here, two ecotypes of ammonia-oxidizing thaumarchaea were quantified using ammonia monooxygenase (amoA) genes across the equatorial Pacific Ocean. The shallow, or water column “A” (WCA), ecotype was the most abundant ecotype at the depths of maximum nitrification rates, and its abundance correlated with other biogeo- chemical indicators of remineralization such as NO3: Si and total Hg. Metagenomes contained thaumarchaeal genes encoding for the catalytic subunit of the urease enzyme (ureC) at all depths, suggesting that members of both WCA and the deep, water column “B” (WCB) ecotypes may contain ureC. Coupled urea hydrolysis- ammonia oxidation rates were similar to ammonia oxidation rates alone, suggesting that urea could be an important source of ammonia for mesopelagic ammonia oxidizers. Potential inducement of metal limitation of both ammonia oxidation and urea hydrolysis was demonstrated via additions of a strong metal chelator. The water column inventory of WCA was correlated with the depth-integrated abundance of WCB, with both likely controlled by the flux of sinking particulate organic matter, providing strong evidence of vertical connectivity between the ecotypes. Further, depth-integrated amoA gene abundance and nitrification rates were correlated with particulate organic nitrogen flux measured by contemporaneously deployed sediment traps. Together, the results refine our understanding of the controls on thaumarchaeal distributions in the ocean, and provide new insights on the relationship between material flux and microbial communities in the mesopelagic.
Microbial diversity in the ocean is vast, even within co- existing, closely related groups of microorganisms. Within this diverse assemblage, the distribution of specific microbial
ecotypes—ecologically differentiated but phylogenetically similar populations (Cohan 2001)—should be shaped by the physicochemical features of the surrounding environment.
In the ocean, the ecotype framework has been applied to explain diversity patterns in some of the most abundant bac- terial groups (reviewed in Cordero and Polz 2014). For exam- ple, ecotypes of the cyanobacterium Prochlorococcus appear closely tied to light physiology (Moore et al. 1998) and vary predictably with temperature and light both temporally (Malmstrom et al. 2010) and across basin-scale gradients (Johnson et al. 2006; Zinser et al. 2007). Similarly, ecotypes of abundant heterotrophic bacterial clades vary predictably with temperature, depth, and season such as SAR11 in the Sargasso Sea (Carlson et al. 2009) and SAR86 in the surface ocean (Dupont et al. 2012). Marine ecosystem models that
*Correspondence: asantoro@ucsb.edu
aPresent address: Department of Ecology, Evolution, and Marine Biology, University of California, Santa Barbara, California
bDivision of Marine Geosystems, Helmholtz Center for Ocean Research, Kiel, Germany
Additional Supporting Information may be found in the online version of this article.
This is an open access article under the terms of the Creative Commons Attribution License, which permits use, distribution and reproduction in any medium, provided the original work is properly cited.
1984
LIMNOLOGY
and
OCEANOGRAPHY
Limnol. Oceanogr.62, 2017, 1984–2003 VC2017 The Authors Limnology and Oceanography published by Wiley Periodicals, Inc.on behalf of Association for the Sciences of Limnology and Oceanography doi: 10.1002/lno.10547
include the physiological adaptations of these ecotypes are successful at recreating microbial biogeography (Follows et al. 2007). While efforts to date have focused primarily on taxa in the surface and upper mesopelagic ocean, similar gra- dients in temperature and material flux exist throughout the mesopelagic. Yet, there are remarkably few quantitative, taxon-specific studies of planktonic microbes in the mesopelagic.
Thaumarchaeota are one of the most abundant microbial groups in the mesopelagic and deep oceans (Karner et al.
2001) and offer an attractive system for quantitative map- ping of ecotypes across basin-scale physicochemical gra- dients. Thaumarchaea have been directly linked to nitrogen remineralization in the upper ocean through their role in the oxidation of ammonia (NH3) to nitrite (NO22), the first step of nitrification (Konneke et al. 2005; Wuchter et al.
2006). In the marine water column, ammonia-oxidizing thaumarchaea far exceed their bacterial counterparts, partic- ularly in the open ocean (Santoro et al. 2010). The hypothe- sized basis for this dominance is their high substrate affinity for NH3/NH14 (Martens-Habbena et al. 2009), making these organisms ideally suited to the extremely low NH3/NH14 flux in the open ocean (Gruber 2008). Early studies of thau- marchaeal ammonia monooxygenase subunit A (amoA) gene sequences from the ocean recovered two distinct clades of pelagic ammonia-oxidizing thaumarchaea (Francis et al.
2005), termed water column “A” (WCA) and water column
“B” (WCB), that have been suggested to represent “shallow”
and “deep” adapted ecotypes (Hallam et al. 2006; Mincer et al. 2007; Beman et al. 2008) within the marine thau- marchaea (Pester et al. 2011). Subsequent studies supported this hypothesis, with depth being a significant factor con- trolling ammonia-oxidizing archaeal community composi- tion (Biller et al. 2012; Sintes et al. 2015) and observations of increasing WCB-likeamoAgene abundance with depth (San- toro et al. 2010; Smith et al. 2014, 2015).
Despite an emerging understanding of the biogeography of thaumarchaea, the physiological basis for the WCA-WCB clade division has not been definitively identified. Depth in the ocean corresponds with gradients in nearly every physi- cochemical parameter including temperature, light, and organic matter flux. Only one cultivated representative of the shallow WCA clade has been described, Candidatus
“Nitrosopelagicus brevis” (Santoro and Casciotti 2011; San- toro et al. 2015) and as-yet, there are no cultivated represen- tatives of the WCB clade. Thus, exploring the physiological basis of the ecotype division is not yet possible with cultivat- ed organisms. Though there are significant differences in gene content between pelagic and benthic thaumarchaea (Swan et al. 2014; Santoro et al. 2015), cultivation- independent single cell and metagenomic studies have sug- gested limited identifiable gene content differences between the shallow and deep pelagic thaumarchaea (Luo et al.
2014). One hypothesized difference between the two
ecotypes is tolerance to sunlight, as DNA photolyase was detected exclusively in the epipelagic clade (Luo et al. 2014).
This protein, however, is expressed in the dark (Santoro et al. 2015), thus its role in adaptation to light stress is uncertain. Other hypotheses put forth to explain the ecotype distributions include substrate affinity (Sintes et al. 2013;
Smith et al. 2015) or the ability to use organic substrates other than reduced nitrogen as sources of energy and reduc- ing equivalents (Qin et al. 2014). For example, at least some thaumarchaea in the ocean appear to be able to use urea (Alonso-Saez et al. 2012; Qin et al. 2014; Swan et al. 2014).
Differential requirements for micronutrients, such as copper (Amin et al. 2013), may also explain niche differentiation between the two ecotypes, but as yet are unexplored.
As thaumarchaea are a dominant taxon in the dark ocean, quantitative mapping of thaumarchaea may help inform some long-standing questions about energy supply to the deep ocean, and the relationship between material export from the surface and its impact on microbial communities below (Cho and Azam 1988). Studies in the Pacific have found a general correspondence between latitudinal patterns in particulate organic matter (POM) flux and microbial abun- dance in the meso- and bathyplelagic (Nagata et al. 2000;
Yokokawa et al. 2013), while no relationship was found across spatial gradients in POM flux in the Arabian Sea (Han- sell and Ducklow 2003). The same study, however, found a relationship between annual POM flux and bathypelagic microbial abundance, leading to the conclusion that bathy- pelagic microbial abundance integrates across a long-term average of material flux. These previous studies used cell count methods that cannot resolve individual microbial groups. With the ability to quantify genes at a resolution previously possible only with cell counts, relationships between individual microbial taxa and organic matter export can now be explored.
Motivated by a desire to understand both the distribution of thaumarchaeal ecotypes and the relationships between material export, nitrogen remineralization, and the abun- dance of thaumarchaea in the mesopelagic, here, we exam- ine the distribution of thaumarchaea across a transect in the equatorial Pacific, a region of previous intensive investiga- tion of carbon export (Murray et al. 1995). Spatial mapping of the two thaumarchaeal ecotypes is compared to a suite of physicochemical parameters to identify physical and biologi- cal factors that could contribute to the distribution of each ecotype across multiple biogeographic provinces. Rate experiments using 15NH14 and15N-urea were conducted at a subset of sites to characterize the biogeochemical environ- ment with respect to nitrogen remineralization. These experiments included treatments to identify the potential for trace metal limitation of urea hydrolysis and nitrification, which rely on metalloenzymes (Morel and Price 2003; Walk- er et al. 2010). The results are compared to contemporaneous measurements of particulate organic nitrogen (PON) flux
using sediment traps. This study is unique in that it exam- ines the distribution of thaumarchaea over a rarely examined spatial and depth scale, ties these measurements directly to particulate flux measurements, and examines them against a rich dataset of accompanying environmental parameters.
Materials and methods
Cruise track and sample collection
Samples were collected 01 October 2011–25 October 2011 during the METZYME cruise (KM1128) aboard the R/V Kilo Moana (Lamborg et al. 2014; Saito et al. 2014). The cruise
track was an 4500 km transect from Hawai’i, across the equatorial upwelling region, and west to the islands of Samoa (Fig. 1A). Eleven oceanographic stations were sampled for molecular characterization of thaumarchaea. A subset of three stations (stations 1, 3, and 5) was chosen for additional geochemical characterization using stable isotope labeling experiments; two of these (stations 3 and 5) were chosen for metagenomic sequencing at select depths (see below).
Water samples were collected at discrete depths using either a standard 24-bottle rosette sampler equipped with an SBE9plus conductivity–temperature–depth (CTD) sensor pack- age (SeaBird Electronics, Bellevue, Washington) or a 12-bottle Fig. 1.(A) Location of the METZYME cruise across the equatorial Pacific. (B) Temperature and (C) oxygen concentration across the cruise track. Tem- perature and oxygen data are reported as 1 m-binned averages from the CTD sensors. Station locations are indicated as black circles with station num- bers above. Open circle denotes a station where only physicochemical samples (i.e., no molecular samples) were collected (station 6). Data were contoured using weighted-average gridding in Ocean Data View v4.7.3.
Santoro et al. Thaumarchaea in the equatorial Pacific
1986
trace metal clean rosette equipped with an SBE19 CTD. Nutri- ent samples were collected from the trace metal clean rosette at 12 depths between 0 m and 1000 m and stored frozen until analysis. Samples for nucleic acid extraction were collected from the rosette in 2–4 L polycarbonate bottles. With one exception, samples were collected from at least ten depths between 40 m and 1000 m, with additional sampling to 3000 m at stations 5, 9, and 11. Fewer samples were collected at station 4 due to loss of the ship’s CTD rosette sampler; a reconstituted equipment package was used in subsequent sta- tions lacking only a PAR sensor. Cells were harvested by pres- sure filtration onto 25 mm diameter, 0.2 lm pore-size polyethersulfone membrane filters (Supor-200, Pall Corpora- tion, Port Washington, New York) housed in polypropylene filter holders (Whatman SwinLok, GE Healthcare, Pittsburgh, Pennsylvania) using a peristaltic pump and silicone tubing.
Pump tubing was acid washed with 10% hydrochloric acid and flushed with ultrapure water between each sample. For DNA extraction and analysis, 1–4 L sample volumes were fil- tered depending on the biomass present at each station and depth, and the filters were flash frozen in liquid nitrogen in 2 mL gasketed bead beating tubes (Fisher Scientific).
Samples for metagenomic sequencing were collected from the 0.2–3.0lm plankton size fraction using an in situ pump- ing system (McLane Research Laboratories, East Falmouth, Massachusetts) and captured on 142 mm, 0.2 lm pore size Supor-200 filters (Pall) as described previously (Saito et al.
2014). Filters were sectioned immediately after pump recov- ery and approximately one quarter of the filter was stored at 2808C for later DNA extraction and sequencing (see below).
Metagenomic samples were collected from station 3 at five depths: 150 m, 250 m, 300 m, 550 m, 800 m, and from sta- tion 5 at 50 m.
Nutrient analyses
Dissolved nitrite (NO22), nitrite1nitrate (NO22 1NO23), ammonium (NH14), ortho-phosphate, and silicate concentra- tions were determined from thawed seawater samples using standard colorimetric methods at the Oregon State University College of Earth, Ocean and Atmospheric Sciences nutrient laboratory. Nutrient, mercury (Hg) speciation, and high- performance liquid chromatography (HPLC) pigment data from the cruise have been reported previously (Saito et al.
2014; Munson et al. 2015) and were used in the present data analysis. At the three stations where nitrification rates were measured (see below), low level ammonium concentrations [NH14] were quantified at 7–10 depths in the upper 200 m at sea with the o-phthaldialdehyde fluorescence method (Holmes et al. 1999; Taylor et al. 2007) using duplicate 50 mL sample volumes with a detection limit of 31 nM. Dissolved urea concentration was determined colorimetrically using the diacetyl monoxime method (Price and Harrison 1987) with previously frozen samples from the initial timepoints of the
15N-urea addition experiments (see below) using 10 mL sam- ple volumes with a detection limit of 100 nM.
Nitrification rate measurements
Rate measurements were conducted using stable isotope tracer additions (15N) at stations 1, 3, and 5 at four depths in the upper water column, targeting the base of the subsurface chlorophyll maximum as the shallowest depth and at approxi- mately 75 m intervals below. Water for incubations at station 1 was obtained from the ship’s rosette; water for stations 3 and 5 was obtained from the trace metal clean rosette due to the aforementioned equipment loss. For each depth, three 500 mL bottle incubations were conducted: two ammonia oxi- dation rate bottles (with15NH14 added) and one no-addition control bottle. Water for the experimental bottles was collect- ed directly from the rosette into 500 mL acid-cleaned polycar- bonate bottles. Each bottle was spiked with 100lL of 1 mmol L21 15N-labeled substrate (15NH14, 99.5 atom percent 15N;
equivalent to a final label concentration of 200 nmol L21 15N, Cambridge Isotope Laboratories). Bottles for the surface chlo- rophyll maximum depth (approximately 1% surface irradi- ance) incubations were incubated in an on-deck circulating seawater incubator in neutral density-screened bags calibrated to approximate the in situ light field at each depth using a photosynthetically active radiation sensor (Biospherical Instruments QSL-2200). Waters from below the euphotic zone were incubated at approximately in situ temperatures in the dark in commercial refrigeration units.
Replicate 50 mL samples were removed from each bottle at time points of 0 h, 8 h, 16 h, and 24 h, 0.2lm syringe- filtered, and frozen. Samples were prepared for d15NNOx
determination from 10 nmol or 20 nmol of analyte using the denitrifier method (Sigman et al. 2001; Mcilvin and Casciotti 2011) at the University of Maryland Center for Environmental Science. Isotopic analysis of the resulting headspace N2O used a ThermoFinnigan DeltaPLUS V isotope ratio mass spectrometer interfaced with a ThermoFinnigan GasBench II-PreCon trace gas analysis system at the Universi- ty of California, Davis Stable Isotope Facility.d15NNOxvalues were calibrated against NO23 isotope reference materials USGS32, USGS34, and USGS35, analyzed in parallel.
Nitrification rates were calculated using the model described previously (Santoro et al. 2013). Model coefficients Fin (the rate of NO2x production, with units lmol L21 h21) andk (the rate constant for NO22 or NO2x assimilation, with units h21) were calculated using a non-linear least squares curve fitting routine, implemented in MATLAB R2011b with the Optimization Toolbox. The fractionation factor for NOx
assimilation (a) was taken to be 1.005. Standard error in the fit coefficients was calculated by approximating the covari- ance matrix, and using the square root of the diagonal to calculate the standard error. Isotope dilution of the tracer (Glibert et al. 1982) and rate stimulation by tracer addition (Horak et al. 2013) can lead to under or over estimation of
the calculated rates, respectively. No corrections for either process have been applied to the rates calculated here.
Urea hydrolysis and trace metal limitation experiments A set of additional incubations were conducted at station 3 to determine rates of nitrification and urea hydrolysis cou- pled to nitrification, and to assess the effect of induced metal limitation on these processes via the addition of the metal- chelating ligand TETA. Here we use TETA to describe the molecule 1,4,8,11-tetraazacyclotetradecane-1,4,8,11-tetraace- tic acid hydrochloride hydrate, abbreviated TETA by Martell and Smith (1977). However, caution is advised not to con- fuse this molecule with another Cu chelator named TETA, triethylenetetramine. The TETA molecule utilized here has a strong affinity for Cu and Co; thermodynamic stability con- stants for TETA show an affinity for metals in the order Cu, Co, Ni, Zn, Fe(III), and Fe(II) (listed in order of decreasing stability constants; 0.1 ionic strength and 258C; Martell and Smith 1977). Water for these experiments was collected at 150 m and 300 m depths using the trace metal clean rosette described above. For each treatment, triplicate trace metal clean 250 mL polycarbonate bottles were triple rinsed and filled within a temporary clean room on the ship. The treat- ments were: (1) 100 nM natural abundance NH14, (2) 50 nM natural abundance urea, (3) 100 nM 15NH14, (4) 50 nM15N- urea, and (5)15N urea plus 0.1 lM TETA. Experiments were harvested after 32 h. As only two time points were available for urea-based nitrification rate determination, the linear equations of Dugdale and Goering (1967) were used to calcu- late the rate of15NOxproduction over time.
Nucleic acid extraction
Nucleic acids (DNA) were extracted as described previous- ly (Santoro et al. 2010), with slight modifications. Briefly, cells on the filters were lysed directly in the bead beating tubes with sucrose-ethylene diamine tetraacetic acid (EDTA) lysis buffer (0.75 M sucrose, 20 mM EDTA, 400 mM NaCl, 50 mM Tris) and 1% sodium dodecyl sulfate (SDS). Prior to mechanical lysis, filter samples were subject to three freeze- thaw cycles of 5 min in liquid nitrogen and 5 min in a 658C water bath. Tubes were then agitated in a FastPrep bead beat- ing machine (MP Biomedicals) for 1.5 min at speed 5.5, and proteinase K (Invitrogen) was added to a final concentration of 0.5 mg mL21. Filters were incubated at 55C for approxi- mately 4 h and the resulting lysates were purified with the DNeasy kit (Qiagen) using a slightly modified protocol (San- toro et al. 2010). The purified nucleic acids were eluted in 200 lL of DNase, RNase-free water (Gibco), and quantified using a fluorometer (Qubit and Quanti-T BR reagent, Invitro- gen Molecular Probes).
DNA for metagenomic library construction and sequenc- ing was extracted as previously described (Rusch et al. 2007).
Briefly, TE buffer (pH 8) containing 50 mM ethylene glycol tetraacetic acid (EGTA) and 50 mM EDTA was added until fil- ter pieces were barely covered. Lysozyme was added to a
final concentration of 2.5 mg mL21, and the tubes were incubated at 378C for 1 h. Proteinase K was added to a final concentration of 200 lg mL21, and the samples were sub- jected to two cycles of rapid freeze-thaw. SDS (final concen- tration of 1%) and an additional 200lg mL21 of proteinase K were added, and samples were incubated at 558C for 2 h followed by three aqueous phenol extractions and one phe- nol/chloroform extraction. The supernatant was then precip- itated with two volumes of 100% ethanol, and the DNA pellet was washed with 70% ethanol. Finally, DNA was treated with cetyl trimethylammonium bromide (CTAB) to remove enzyme inhibitors.
Quantitative PCR (qPCR)
All qPCR assays were conducted using group-specific assays for the thaumarchaealamoA gene for WCA and WCB ecotypes (Mosier and Francis 2011) with TaqMan Environ- mental Mastermix (Life Technologies) chemistry on a CFX96 qPCR machine (Bio-Rad, Hercules, California). Detection lim- its for TaqMan assays were 1 copy mL21or better. All sam- ples were run in triplicate against a standard curve spanning approximately 1012105templates, run in duplicate. Plasmids containing cloned inserts of the target gene (TOPO pCR4 vector, Invitrogen or pGem vector, Promega) were used as standards. Standards were linearized with the restriction enzyme NotI (New England Biolabs), purified (DNeasy, Qia- gen), quantified by fluorometry (Quanti-T HS reagent, Invi- trogen), and stored at 2808C. Fresh standard dilutions were made from frozen stocks for each day of analysis. qPCR was carried out using the following thermal profile: 958C for 10 min, followed by 40 cycles of 958C for 30 s and 558C for 30 s. A minimum of three negative control qPCR reactions to which no DNA template was added were run with every assay. Efficiency was calculated relative to a theoretical stan- dard curve slope of 3.32. All qPCR runs were setup using an epMotion 5070 automated liquid handling system (Eppen- dorf) to minimize between-run variability. A total of 148 samples were analyzed for each ecotype assay.
Metagenomic sequencing and bioinformatic analysis Metagenomic sequence data were produced by the United States Department of Energy Joint Genome Institute (JGI;
http://www.jgi.doe.gov/), in collaboration with the user community, following standard JGI protocols for library gen- eration, sequencing, and assembly on the Illumina HiSeq 2000 or 2500 sequencing platforms. Thaumarchaeal amoA, urease gamma subunit (ureC), and ammonium transporter (amtB1) genes were identified through blastn searches using reference genes from all full genome-sequenced marine thau- marchaea and a thaumarchaeal ureC gene obtained from a urea-hydrolyzing enrichment culture (P. Carini, Santoro and Dupont, unpubl.) against the assembled metagenomic data using a 70% nucleotide identity threshold and 50% coverage requirement. Thaumarchaeal 16S rRNA sequences were iden- tified using a 90% nucleotide identity threshold to genome-
Santoro et al. Thaumarchaea in the equatorial Pacific
1988
sequenced marine thaumarchaea. Coverage information of the raw reads to the assembled contigs was taken directly from the mapping to assemblies generated by JGI. Nucleo- tide sequence alignments were performed using MAFFT’s local pairwise alignment algorithm (L-INS-i; v7.245, Katoh and Standley 2013) with default settings and manually refined based on the translated sequences in AliView (Lars- son 2014). Phylogenetic trees were constructed using Fast- Tree (Price et al. 2009) using the GTR1CAT model for nucleotide trees and the WAG1CAT model for the AmtB amino acid tree.
Statistical analyses
All curve fitting and statistical analyses were implemented in MATLAB R2011b (MathWorks, v.7.13) using the Statistics and Curve Fitting Toolboxes. Pairwise correlation analyses used non-parametric Spearman correlations and partial Spearman correlations on untransformed data using the functions “corr” and “partialcorr.” Stepwise regression mod- els (“stepwisefit”) were evaluated on de-meaned data normal- ized to a standard deviation of 1. Non-parametric fitting using multiple methods (first-order polynomial, smoothing spline, and local interpolation) was used to investigate the relationship between thaumarchaeal community structure (as %WCB) and physicochemical variables. To investigate relationships through the vertical extent of the water col- umn, biological variables (qPCR and pigment data) were depth-integrated between 10 m and 1000 m using trapezoi- dal integration and analyzed using non-parametric correla- tion analysis as above.
Data deposition
All nutrient, qPCR, and nitrification rate data have been archived with the United States National Science Founda- tion’s Biological and Chemical Oceanography Data Manage- ment Office (BCO-DMO; bco-dmo.org) in association with the “MetZyme” project. Metagenomic data (both raw data and assemblies) are available in JGI’s Integrated Microbial Genomes database (img.jgi.doe.gov) under JGI Project ID numbers 1024961, 1024964, 1024967, 1024970, 1024973, and 1024976. Sequence alignments have been archived with BCO-DMO, also in association with the MetZyme project.
Results
General hydrographic parameters
Sampling extended from the oligotrophic waters of the North Pacific Subtropical Gyre, off the Hawaiian Islands (sta- tion 1), across the Equator (station 5) along 157W, then west to Western Samoa (station 12; Fig. 1A; Table 1). Surface temperature along this transect varied from 25.7C (station 1) to 28.9C (station 9) (Table 1; Fig. 1B). At station 5, the equatorial upwelling was evident in lower SST than adjacent stations, concave isothermals, and elevated surface [NO23] of 6.1 lM (Table 1). Chlorophyll a (Chl a) concentration was Table1.SummaryofhydrographicparametersontheMETZYMEcruise,October2011.Depthintegratednitrificationratesarecalculatedfromthebaseof theeuphoticzoneand300m.ChlaconcentrationsreportedarethesumofChlaanddivinylChla. StationLat.Long.SST (8C)MLdepth (m)ML [NO2 3](lM)
Surface [Chla] (ngL21 )
Depth ofDCM- CTD(m)
Depth ofDCM- HPLC(m)[Chla]at DCM(ngL21 )Depthof O2min(m)Min[O2] (lmolkg21 )
PONflux at60m6SD (mmol m22 d21 )*
Depth- integrated nitrification rate(mmol m22 d21 ) 117.02154.425.748BDL2812487205499180.6160.280.39 212.02155.527.353BDL34ND1003151421NDND 38.02156.028.3370.3179ND80340146121.0960.350.92 44.02157.128.11011.771872120024947338NDND 50.02157.125.9576.102774340448511371.5560.332.17 623.52160.827.31045.10220726039121624NDND 726.02162.627.81364.32162848531526776NDND 829.252165.428.5611.46110696039632789NDND 9212.02167.628.9230.671335760415400111NDND 10215.02170.028.2900.1744136135475443134NDND 11215.02171.528.2570.91ND137NDND438137NDND 12215.02173.128.4710.1280114125510402114NDND SST,seasurfacetemperature;ML,mixedlayer;definedas0.58CtemperaturedeviationfromSST;DCM,deepChlamaximum;BDL,belowdetectionlimit;ND,notdetermined. *FromMunsonetal.(2015).
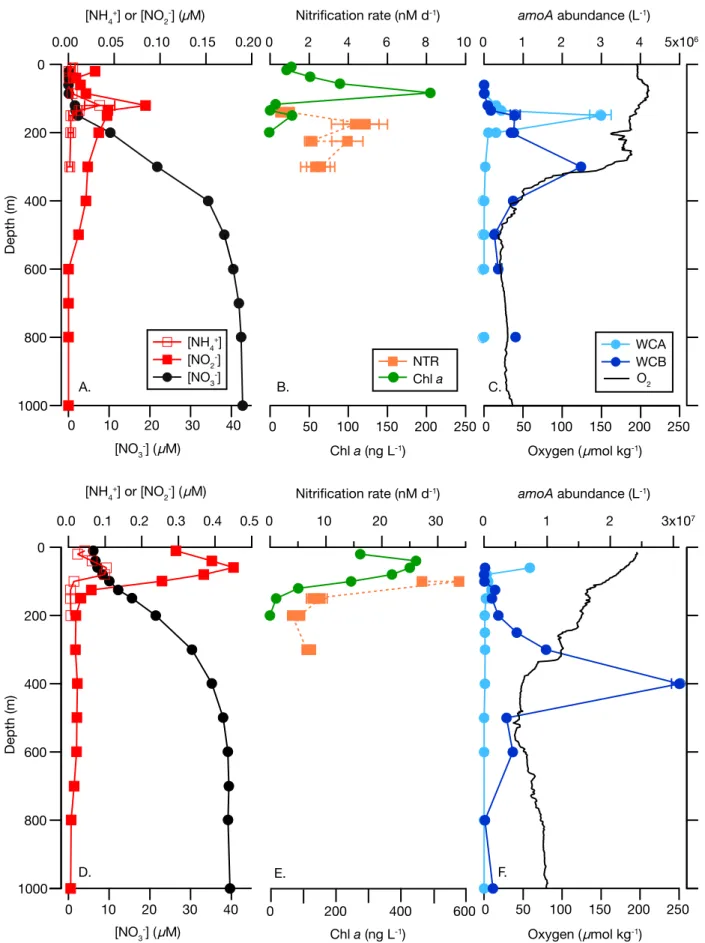
Fig. 2.Representative depth profiles from station 1 (17 N, top row) and station 5 (Equator, bottom row) (A, D). [NH14] (open squares), [NO22] (filled squares), [NO23] (filled circles). Error bars for [NH14] measurements represent standard error of triplicate measuremetns and in most cases are smaller than the symbol (B,E). Nitrification rates (NTR) determined using15NH4Cl (filled squares) and Chladetermined using high performance liq- uid chromatography (filled circles). Error bars for NTR indicate standard error in the model fit, and in most cases are smaller than the symbol; (C,F).
Abundance of archaealamoAgenes determined using qPCR for the water column “A” (WCA) and water column “B” (WCB) ecotypes, and dissolved oxygen. Points are the mean of triplicate qPCR analyses; error bars indicade standard deviation from the mean and in most cases are smaller than the symbol. Note that scaling changes on most horizontal axes between stations.
also high at station 5, both at the surface (277 ng L21; Table 1) and in the deep Chlamaximum (DCM, 448 ng L21). The highest subsurface Chlaconcentrations were observed at the western edge of the cruise track at stations 10 and 12 (475–
510 ng L21). The cruise track intersected the western extent of the Eastern Tropical North Pacific oxygen deficient zone at stations 2 and 3, with low mesopelagic oxygen concentra- tions approaching the detection limit of the standard CTD oxygen sensor ( 1lM) (Table 1). [NH14] and [NO22] profiles demonstrated characteristic maxima just below the DCM (Fig. 2). [NH14] in the NH14 maximum ranged from 34 nM at station 1 (Fig. 2A) in the North Pacific Subtropical Gyre to 103 nM at station 5 at the Equator (Fig. 2D). The subsurface NO22 maximum (the primary nitrite maximum) ranged from very low values in the gyre (station 1) and off Samoa (0.05–
0.08 lM; stations 10–12) to 2.15lM at station 7 (Fig. 2A,D;
Table 1). Urea concentrations at station 3, the only station analyzed, were 38 nM at 150 m and below the detection lim- it at 300 m.
Nitrification rate distributions
Nitrification rates in the oligotrophic gyre at station 1 ranged from 0.8 nM d21 below the chlorophyll maximum (140 m; Fig. 2B) to 4.6 nM d21at 175 m. At station 3, nitrifi- cation rates varied little across the 4 depths sampled, ranging
from 3.5 nM d21 at 300 m to 4.4 nM d21 at 150 m and 225 m (Supporting Information Table S1). Relatively high rates of nitrification were measured at the Equator, station 5 (Fig. 2E), reaching 30.5 nM d21 within the subsurface NO22 maximum and decreasing to 4.6 nM d21 at 200 m. No changes in d15NNOx were detected in the no-addition con- trols at any station/depth (data not shown).
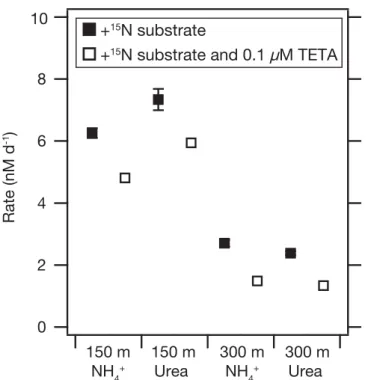
Additional experiments were conducted at station 3 (150 m and 300 m depths) to determine rates of coupled urea hydrolysis-nitrification, and the impact of free metal chelation on the rates of those processes (Fig. 3). At 150 m, rates of coupled urea hydrolysis-nitrification were slightly, but significantly, higher than nitrification alone (Fig. 3A;
7.360.3 nM d21 vs. 6.360.2 nM d21; t-test, p50.05). At 300 m, rates of the two processes were not significantly dif- ferent (2.460.1 nM d21 vs. 2.760.1 nM d21; p50.07).
Addition of the metal chelator TETA significantly decreased both nitrification and coupled urea hydrolysis-nitrification at both depths (Fig. 3). TETA addition to a final concentration of 0.1 lM reduced nitrification rates 23% to 4.860.02 nM d21at 150 m. Coupled urea hydrolysis-nitrification was simi- larly affected, decreasing 19% to 5.960.3 nM d21. Rates at 300 m were more affected by TETA addition, with nitrifica- tion decreasing 45% to 1.560.1 nM d21 and coupled urea hydrolysis-nitrification decreasing 44% to 1.360.1 nM d21.
Thaumarchaeal ecotype distributions
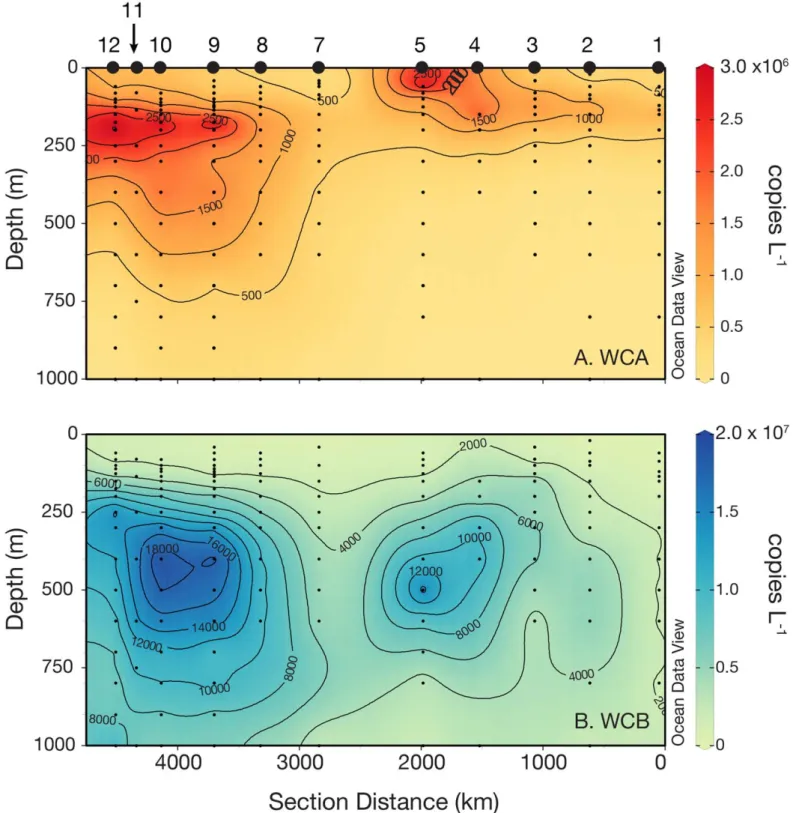
The WCA clade ofamoA-containing archaea is thought to be adapted to the epipelagic, while the WCB clade is thought to be adapted to the mesopelagic. The general shape of depth profiles of WCAamoAgenes was as follows: low to undetectable in the mixed layer, maximal near the top of the nitracline, becoming very low (< 105 genes L21) again below 200 m (Fig. 2C,F). Across the cruise track (Fig. 4A), abundances of WCA amoA genes were lowest at station 1, ranging from below detection limits in surface waters and below 500 m to approximately 3.0 3 106 genes L21 at the top of nitracline. Abundance of WCA amoAgenes was rela- tively high at station 5, reaching 7.3 3 106 genes L21 at 60 m, but reached the maximum abundance at station 10, 175 m depth (1.83107genes L21) within a mesopelagic fea- ture containing high abundances of both thaumarchaeal clades at stations 9–12 (Fig. 4A,B). WCA amoA gene abun- dance was correlated (p<0.05) with over 20 hydrographic parameters (Table 2), exhibiting the strongest correlations with NO3 : Si (r50.58), the pelagophyte pigment 19’- butanoyloxyfucoxanthin (r50.41), and a negative correla- tion with the cyanobacterial pigment zeaxanthin (r5 20.52).
WCA amoA abundance was not correlated with nitrification rate (p50.12), but was inversely correlated with [NH14] (r5 20.23, p50.02). Stepwise regression modeling was fur- ther applied to establish predictive relationships between measured physicochemical and biological parameters. Of the Fig. 3.Rates of nitrification and coupled urea hydrolysis-nitrification at
station 3 determined under trace-metal clean conditions using15N trac- ers with and without the divalent metal chelator TETA. In all cases, rates in the TETA addition bottles are significantly lower (Student’s t-test, p<0.02 for all pairwise comparisons). Values are the means of triplicate experimental bottles for each treatment. Error bars indicate one standard error and in most cases are smaller than the symbol.
Fig. 4.Abundance of archaealamoAgenes in the equatorial Pacific between W. Samoa (section distance5000 km) and offshore of Hawai’i (section distance0 km) as determined by quantitative PCR (qPCR). (A) Water column “A” (WCA) clade, (B) water column “B” (WCB) clade. Station num- bers are indicated along the top of panelA. Note thex-axis differs slightly from Fig. 1 to display data from multiple stations occupied along 15S (see Fig. 1A), and that the color scale range is different for panelsAandB. Points below the detection limit of our qPCR assays were coded as zero values for data interpolation using the weighted-average gridding algorithm in Ocean Data View v4.7.3 with automaticxandyscale lengths.
Santoro et al. Thaumarchaea in the equatorial Pacific
1992
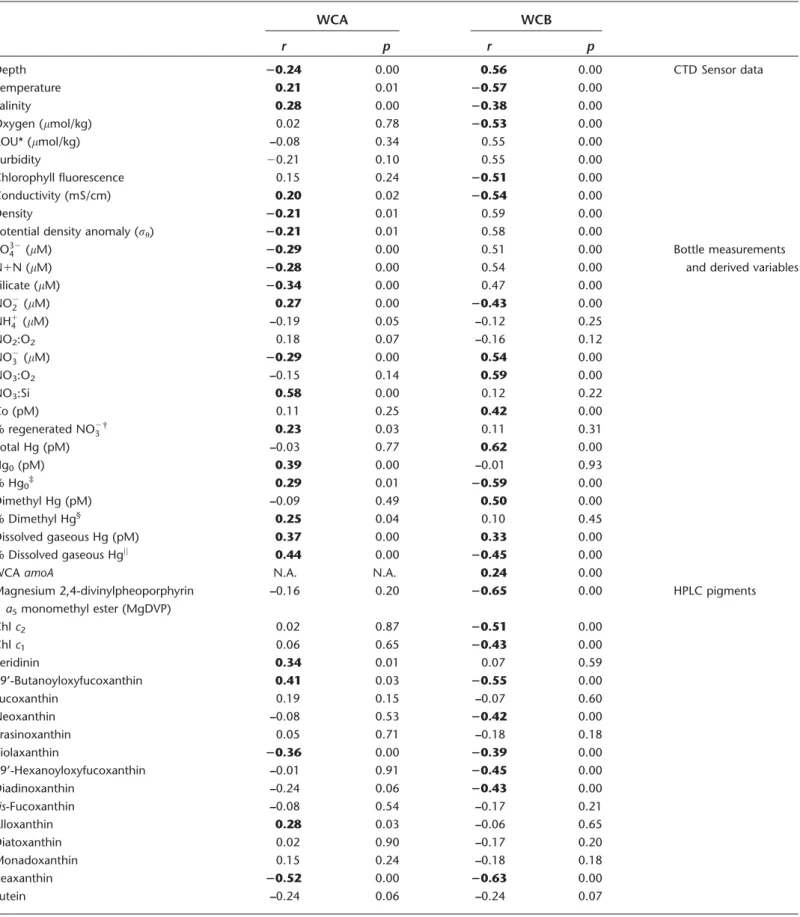
Table 2. Results of pairwise non-parametric correlation (Spearman’s rho) between biological and physical parameters and ecotypes (WCA and WCB) of archaealamoAgenes. Bold text indicatesrvalues supported byp<0.05.
WCA WCB
r p r p
Depth 20.24 0.00 0.56 0.00 CTD Sensor data
Temperature 0.21 0.01 20.57 0.00
Salinity 0.28 0.00 20.38 0.00
Oxygen (lmol/kg) 0.02 0.78 20.53 0.00
AOU* (lmol/kg) –0.08 0.34 0.55 0.00
Turbidity 20.21 0.10 0.55 0.00
Chlorophyll fluorescence 0.15 0.24 20.51 0.00
Conductivity (mS/cm) 0.20 0.02 20.54 0.00
Density 20.21 0.01 0.59 0.00
Potential density anomaly (ru) 20.21 0.01 0.58 0.00
PO324 (lM) 20.29 0.00 0.51 0.00 Bottle measurements and derived variables
N1N (lM) 20.28 0.00 0.54 0.00
Silicate (lM) 20.34 0.00 0.47 0.00
NO22 (lM) 0.27 0.00 20.43 0.00
NH14 (lM) –0.19 0.05 –0.12 0.25
NO2:O2 0.18 0.07 –0.16 0.12
NO23 (lM) 20.29 0.00 0.54 0.00
NO3:O2 –0.15 0.14 0.59 0.00
NO3:Si 0.58 0.00 0.12 0.22
Co (pM) 0.11 0.25 0.42 0.00
% regenerated NO23† 0.23 0.03 0.11 0.31
Total Hg (pM) –0.03 0.77 0.62 0.00
Hg0(pM) 0.39 0.00 –0.01 0.93
% Hg0‡
0.29 0.01 20.59 0.00
Dimethyl Hg (pM) –0.09 0.49 0.50 0.00
% Dimethyl Hg§ 0.25 0.04 0.10 0.45
Dissolved gaseous Hg (pM) 0.37 0.00 0.33 0.00
% Dissolved gaseous Hgjj 0.44 0.00 20.45 0.00
WCAamoA N.A. N.A. 0.24 0.00
Magnesium 2,4-divinylpheoporphyrin a5monomethyl ester (MgDVP)
–0.16 0.20 20.65 0.00 HPLC pigments
Chlc2 0.02 0.87 20.51 0.00
Chlc1 0.06 0.65 20.43 0.00
Peridinin 0.34 0.01 0.07 0.59
19’-Butanoyloxyfucoxanthin 0.41 0.03 20.55 0.00
Fucoxanthin 0.19 0.15 –0.07 0.60
Neoxanthin –0.08 0.53 20.42 0.00
Prasinoxanthin 0.05 0.71 –0.18 0.18
Violaxanthin 20.36 0.00 20.39 0.00
19’-Hexanoyloxyfucoxanthin –0.01 0.91 20.45 0.00
Diadinoxanthin –0.24 0.06 20.43 0.00
cis-Fucoxanthin –0.08 0.54 –0.17 0.21
Alloxanthin 0.28 0.03 –0.06 0.65
Diatoxanthin 0.02 0.90 –0.17 0.20
Monadoxanthin 0.15 0.24 –0.18 0.18
Zeaxanthin 20.52 0.00 20.63 0.00
Lutein –0.24 0.06 –0.24 0.07
56 variables included in the analysis, only [NO22] was retained in the final model for WCA abundance.
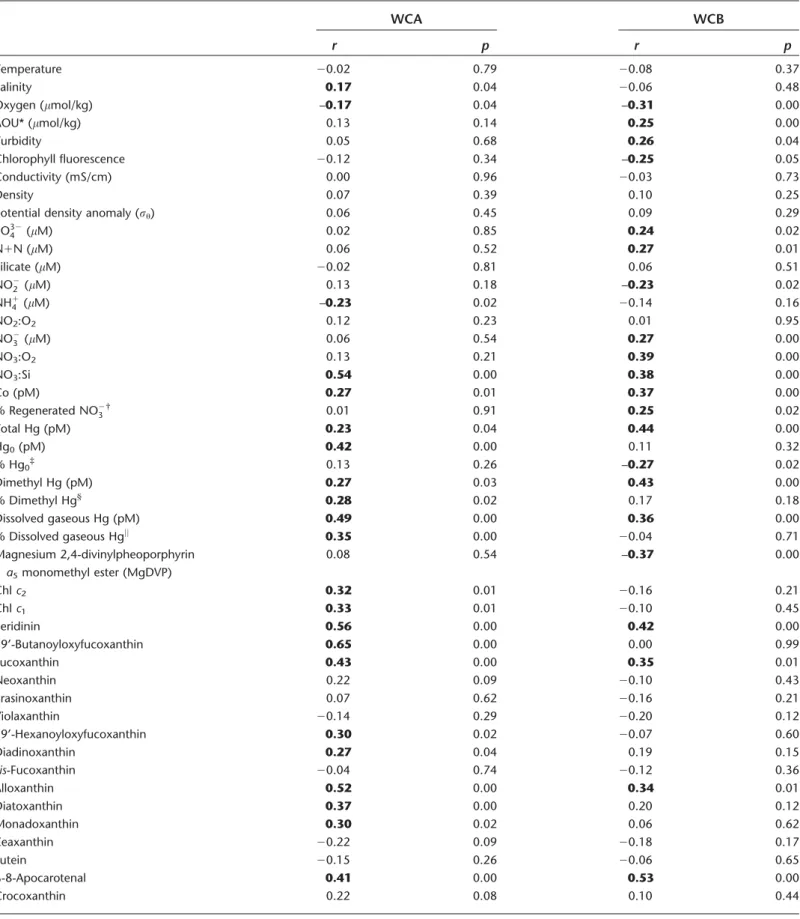
WCBamoAgenes were also near or below detection limits in the euphotic zone. In contrast to WCAamoAgenes, how- ever, WCB amoA depth profiles had increasing abundance through the upper mesopelagic (Fig. 2C,F), and were detecti- ble down to the deepest depth sampled at every station (1000 m, or 3000 m at stations 5 and 9). As mentioned above, WCB amoA genes were observed in very high abun- dance within a mesopelagic feature spanning stations 9–12 (Fig. 4B). Within this feature, WCBamoAabundance reached 4.5 3 107genes L21(station 10, 400 m depth). WCB amoA abundance was significantly correlated with nearly every physicochemical parameter measured (Table 2), owing to a strong correlation between WCBamoAabundance and depth (r50.56, p<0.001) and the co-variation with depth of most physicochemical parameters. Therefore, a partial correlation analysis, controlling for depth, was also carried out to evalu- ate factors controlling WCB amoA abundance (Table 3).
Strongest partial correlations were found with indicators of remineralization: total Hg (r50.44, p<0.001), dimethyl Hg (r50.43, p<0.001), dissolved cobalt (r50.37, p <0.001), NO3 : Si (r50.38, p<0.001), AOU (r50.25, p<0.01), and fraction remineralized NO23 (r50.25, p50.02). WCB abun- dance was not successfully modeled using stepwise regres- sion. High abundances of WCB amoA genes were observed underlying waters with relatively high abundances of WCA amoA genes (Fig. 4); depth-integrated abundances of WCA and WCB amoA genes were strongly correlated (r50.82, p<0.01, n511), more so than pairwise correlation of indi- vidual samples (r50.24,p<0.01,n5145).
In addition to correlations between the absolute abun- dance of the ecotypes, we also investigated physical factors that may govern community structure and the shift from a WCA-dominated to a WCB-dominated community by exam- ining the percent of totalamoAgenes belonging to the WCB clade (%WCB; Fig. 5). Plotting %WCB with respect to seawa- ter density shows a relatively sharp boundary around rT526 kg m23. Plotted against the depth-dependent varia- bles temperature and phosphate (also a proxy for many micronutrients), there is considerable scatter around the transition from a WCA to a WCB-dominated community (Fig. 5C,D).
Thaumarchaeal gene content in metagenomes
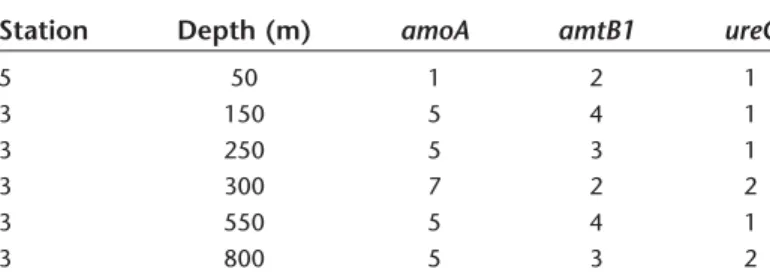
Metgenomic libraries were constructed from samples col- lected at stations 3 and 5 at depths from 50 m to 800 m (Table 4; Supporting Information Table S3). Thaumarchaeal amoA, amtB, and ureC genes were detected in all samples (Table 4), but no hits to thaumarchaeal photolyase were detected. Contigs containing a thaumarchaeal 16S rRNA, amoA and/or ureC gene represented 0.003–0.013% of the total assembled sequence data (Supporting Information Table S3). Average fold coverage of these contigs in the raw data was highest in the 550 m and 800 m libraries (Fig. 6).
The ratio of ureC : amoA in each sample ranged from 0.22 (800 m) to 0.55 (50 m), indicating that up to 55% of amoA- containing thaumarchaeal genomes also containureC.
Depth partitioning was apparent in amoA sequences retrieved from the metagenome (Supporting Information Fig.
S1A). Two WCA cladeamoA sequences were recovered from station 5, 50 m and station 3, 150 m libraries forming a monophyletic clade with Ca. N. brevis CN25, distinct from TABLE 2.Continued
WCA WCB
r p r p
b-8-Apocarotenal 0.30 0.02 0.21 0.12
Crocoxanthin –0.09 0.50 20.32 0.02
Chlc2like 0.22 0.08 0.08 0.57
Divinyl (DV) Chla 20.30 0.02 20.62 0.00
Monovinyl (MV) Chla 0.02 0.86 20.45 0.00
Total Chla(MV1DV) –0.17 0.18 20.55 0.00
b,E-Carotene 0.30 0.02 –0.05 0.73
b,b-Carotene 0.22 0.08 0.02 0.91
Chlc3 0.31 0.02 –0.25 0.06
Chlb 0.25 0.05 20.41 0.00
Chlorophyllidea 0.10 0.44 –0.08 0.57
Phaeophorbidea 0.00 0.98 20.45 0.00
Phaeophytina 0.06 0.79 20.63 0.00
* Apparent oxygen utilization.
† Regenerated NO23 calculated using AOU and the respiration stoichiometry of Anderson (1995) (i.e., AOU/10.6), reported as a percent of total [NO23].
‡,§,jj
As a percent of total Hg.
Santoro et al. Thaumarchaea in the equatorial Pacific
1994
Table 3. Results of partial non-parametric correlation (Spearman’s rho) between biological and physical parameters and ecotypes (WCA and WCB) of archaealamoAgenes, controlling for depth. Bold text indicatesrvalues supported byp<0.05.
WCA WCB
r p r p
Temperature 20.02 0.79 20.08 0.37
Salinity 0.17 0.04 20.06 0.48
Oxygen (lmol/kg) –0.17 0.04 –0.31 0.00
AOU* (lmol/kg) 0.13 0.14 0.25 0.00
Turbidity 0.05 0.68 0.26 0.04
Chlorophyll fluorescence 20.12 0.34 –0.25 0.05
Conductivity (mS/cm) 0.00 0.96 20.03 0.73
Density 0.07 0.39 0.10 0.25
Potential density anomaly (ru) 0.06 0.45 0.09 0.29
PO324 (lM) 0.02 0.85 0.24 0.02
N1N (lM) 0.06 0.52 0.27 0.01
Silicate (lM) 20.02 0.81 0.06 0.51
NO22 (lM) 0.13 0.18 –0.23 0.02
NH14 (lM) –0.23 0.02 20.14 0.16
NO2:O2 0.12 0.23 0.01 0.95
NO23 (lM) 0.06 0.54 0.27 0.00
NO3:O2 0.13 0.21 0.39 0.00
NO3:Si 0.54 0.00 0.38 0.00
Co (pM) 0.27 0.01 0.37 0.00
% Regenerated NO23† 0.01 0.91 0.25 0.02
Total Hg (pM) 0.23 0.04 0.44 0.00
Hg0(pM) 0.42 0.00 0.11 0.32
% Hg0‡
0.13 0.26 –0.27 0.02
Dimethyl Hg (pM) 0.27 0.03 0.43 0.00
% Dimethyl Hg§ 0.28 0.02 0.17 0.18
Dissolved gaseous Hg (pM) 0.49 0.00 0.36 0.00
% Dissolved gaseous Hgjj 0.35 0.00 20.04 0.71
Magnesium 2,4-divinylpheoporphyrin a5monomethyl ester (MgDVP)
0.08 0.54 –0.37 0.00
Chlc2 0.32 0.01 20.16 0.21
Chlc1 0.33 0.01 20.10 0.45
Peridinin 0.56 0.00 0.42 0.00
19’-Butanoyloxyfucoxanthin 0.65 0.00 0.00 0.99
Fucoxanthin 0.43 0.00 0.35 0.01
Neoxanthin 0.22 0.09 20.10 0.43
Prasinoxanthin 0.07 0.62 20.16 0.21
Violaxanthin 20.14 0.29 20.20 0.12
19’-Hexanoyloxyfucoxanthin 0.30 0.02 20.07 0.60
Diadinoxanthin 0.27 0.04 0.19 0.15
cis-Fucoxanthin 20.04 0.74 20.12 0.36
Alloxanthin 0.52 0.00 0.34 0.01
Diatoxanthin 0.37 0.00 0.20 0.12
Monadoxanthin 0.30 0.02 0.06 0.62
Zeaxanthin 20.22 0.09 20.18 0.17
Lutein 20.15 0.26 20.06 0.65
b-8-Apocarotenal 0.41 0.00 0.53 0.00
Crocoxanthin 0.22 0.08 0.10 0.44
the WCB amoA sequences found deeper in the water col- umn.amoAdiversity was greater within the WCB clade, but similar sequences were found at 150 m and 800 m depth.
OneureCsequence type apparently affiliated with the WCA clade was found in the station 5, 50 m library, falling within a clade including cultivated thaumarchaea (Supporting Infor- mation Fig. S2B).
Discussion
The aim of this study was to understand the physico- chemical controls on the abundance and partitioning of two presumptive ecotypes of ammonia-oxidizing thaumarchaea at the basin scale, and quantify nitrification in the equatorial Pacific, a site of intensive previous studies of nitrogen cycling (Wilkerson and Dugdale 1992; Raimbault et al. 1999) and organic matter export (Murray et al. 1995). Nitrification rates at station 1 and station 5 displayed a characteristic power law profile (Ward 2008; Newell et al. 2011; Smith et al. 2015), with highest rates just below the DCM, decreas- ing exponentially below (Fig. 2B,E). This was not observed at station 3, where high rates of nitrification near the base of
the euphotic zone were not captured (Supporting Informa- tion Table S1). Loss of the real-time output on the CTD sen- sor for stations 2–4 prevented choosing precise incubation depths relative to the Chl a maximum at station 3, so it is likely this narrow maximum in nitrification rates was missed by our sampling. Our data are qualitatively consistent with previously observed distributions of nitrification rates in the water column of the tropical Pacific (Ward and Zafiriou 1988; Raimbault et al. 1999; Beman et al. 2012) and other oceanic regions (Clark et al. 2008; Newell et al. 2013) and provide the first rate measurements of sub-euphotic zone nitrification in this region.
Nitrification is the final step of nitrogen remineralization in the breakdown of organic matter, thus, the depth- integrated nitrification rate should be directly related to organic nitrogen (and carbon) export from the base of the euphotic zone. Surprisingly, there are limited direct compari- sons of these two measurements from a single expedition. As mentioned above, the PAR sensor was lost during sampling at station 2, thus direct light measurements with which to calculate euphotic zone depth were not possible for most of the cruise. If we take the depth of the DCM, however, to approximate the 1% light depth as it does throughout much of the oligotrophic ocean (Cullen 2015) and depth-integrate nitrification rates between there and 300 m, we arrive at 0.39 mmol m22d21at station 1, 0.92 mmol m22d21at sta- tion 3, and 2.17 mmol m22d21at station 5 (Table 1). These values compare well with, though are somewhat higher than, previous estimates of N export from the equatorial Pacific [0.76 mmol m22 d21 (Dugdale and Wilkerson 1998);
0.88 mmol m22 d21 (Chai et al. 2002)]. Depth-integrated nitrification rates were correlated with both depth-integrated Chl a (R250.96) and sediment trap PON export at 60 m (R250.94), the later reported by Munson et al. (2015).
TABLE 3.Continued
WCA WCB
r p r p
Chlc2like 0.39 0.00 0.39 0.00
Divinyl (DV) Chla 20.05 0.72 –0.33 0.01
Monovinyl (MV) Chla 0.30 0.02 20.16 0.23
Total Chla(MV1DV) 0.12 0.37 20.23 0.07
b,E-Carotene 0.49 0.00 0.28 0.03
b,b-Carotene 0.38 0.00 0.39 0.00
Chlc3 0.55 0.00 0.13 0.32
Chlb 0.41 0.00 20.16 0.21
Chlorophyllidea 0.31 0.02 0.29 0.03
Phaeophorbidea 0.18 0.16 20.25 0.05
Phaeophytina 0.09 0.50 –0.43 0.00
* Apparent oxygen utilization.
†Regenerated NO23 calculated using AOU and the respiration stoichiometry of Anderson (1995) (i.e., AOU/10.6), reported as a percent of total [NO23].
‡,§,k
As a percent of total Hg.
Table 4. Genotype counts for select thaumarchaeal genes identified in the assembled metagenomes, used for determining coverage values shown in Fig. 6.
Station Depth (m) amoA amtB1 ureC
5 50 1 2 1
3 150 5 4 1
3 250 5 3 1
3 300 7 2 2
3 550 5 4 1
3 800 5 3 2
Santoro et al. Thaumarchaea in the equatorial Pacific
1996
Previous studies in the Pacific have found positive correla- tions between depth-integrated primary production and nitrification (Beman et al. 2012; Shiozaki et al. 2016). The correlations in our data and others support a direct and quantitative connection between nitrification rates, euphotic zone biomass, and PON export (Newell et al. 2011).
Rates of nitrification and coupled urea hydrolysis- nitrification were similar, and suggest that urea could be an important source of NH3fueling nitrification in the mesope- lagic as has been recently shown in mesopelagic waters over the Antarctic Shelf (Tolar et al. 2016). Our experiments can- not resolve whether this transformation is being carried out by a single group of organisms, or a consortium of urea-
hydrolyzing microbes and ammonia oxidizers, as was recent- ly proposed (Koch et al. 2015). Cultures of urea-utilizing marine ammonia-oxidizing archaea have been reported (Qin et al. 2014; Bayer et al. 2015) and urease genes have been detected in multiple cultivation-independent studies of marine thaumarchaea (Alonso-Saez et al. 2012; Tully et al.
2012; Swan et al. 2014). Here, thaumarchaeal ureC genes were detected in metagenomes at all depths, suggesting that both ecotypes of thaumarchaea may possess the ability to use urea as a source of NH3. A recent study, however, did not find evidence of thaumarchaeal ureC expression in the mesopelagic though ureC genes were detected (Smith et al.
2015). While it has been suggested that urease may be a Fig. 5.Fraction of totalamoAgenes belonging to the water column B clade as a function of (A) depth, (B) seawater density, (C) temperature, and (D) inorganic phosphate concentration.