Multiple Imputation of Censored Variables
Dissertation
zur Erlangung des akademischen Grades eines Doktors der Sozial- und Wirtschaftswissenschaften
(Dr. rer. pol.)
an der Fakult¨ at Sozial- und Wirtschaftswissenschaften der Otto-Friedrich-Universit¨ at Bamberg
vorgelegt von Thomas B¨ uttner
Bamberg, im Juli 2010
Datum der Disputation: 17. Juni 2010 Promotionskommission:
Professor Dr. Susanne R¨ assler (Erstgutachter)
Professor Trivellore E. Raghunathan, Ph.D. (Zweitgutachter) Professor Dr. Johannes Schwarze
Professor Dr. Henriette Engelhardt-W¨ olfler
Danksagung
Diese Dissertation w¨ are nicht m¨ oglich gewesen ohne die Unterst¨ utzung einer Vielzahl von Kollegen und Freunden, die entscheidend zum Gelingen der Arbeit beigetragen haben. Zuallererst gilt mein Dank meiner Doktor- mutter Prof. Dr. Susanne R¨ assler f¨ ur ihre langj¨ ahrige Unterst¨ utzung. Vor allem m¨ ochte ich Ihr daf¨ ur danken, dass sie mich in die Welt der multiplen Imputation eingef¨ uhrt hat und daf¨ ur, dass sie mir die M¨ oglichkeit er¨ offnet hat, dieses Dissertationsprojekt ¨ uberhaupt anzugehen. Ein entscheidender Grund, dass diese Dissertation nun abgeschlossen vorliegt, ist sicherlich, dass sie auch in schwierigen Phasen, oftmals deutlich st¨ arker als ich selbst, immer an den Erfolg dieses Projekts geglaubt hat. Mein ausdr¨ ucklicher Dank gilt auch meinem Zweitbetreuer Prof. Trivellore Raghunathan, Ph.D., vor allem f¨ ur einige wertvolle Tipps, die mir aus mehreren hoffnungslos erscheinenden Situationen geholfen haben.
Diese Dissertation ist w¨ ahrend meiner T¨ atigkeit am Institut f¨ ur Arbeitsmarkt- und Berufsforschung (IAB) entstanden und wurde im Rahmen des IAB/WiSo- Graduiertenprogramms (GradAB) mit einem Stipendium gef¨ ordert. Mein Dank geb¨ uhrt daher auch einer Reihe von Kolleginnen und Kollegen am IAB, insbesondere jenen im Kompetenzzentrum empirische Methoden (KEM).
Besonders hervorzuheben sind hier Dr. Johannes Ludsteck, Prof. Dr. Hans
Kiesl und Dr. J¨ org Drechsler. Johannes Ludsteck und Hans Kiesl daf¨ ur,
dass sie mir von Anfang an mit Rat und Tat zur Seite standen. Nur durch
ihre Hilfe war es m¨ oglich, dass die eine oder andere Wissensl¨ ucke meinerseits
dem Erfolg des Dissertationsvorhabens nichts anhaben konnte. J¨ org Drechsler
daf¨ ur, dass er den oftmals steinigen Weg der Promotion mit mir gemeinsam
gegangen ist. Allen drei danke ich f¨ ur hilfreiche Diskussionen ¨ uber die ver-
schiedensten Themen, seien sie wissenschaftlich oder auch eher privat, und
nat¨ urlich auch f¨ ur die unvergesslichen gemeinsamen Reisen zu Konferenzen in
der ganzen Welt. Bedanken m¨ ochte ich mich auch bei den Kolleginnen und
Kollegen im Graduiertenprogramm, besonders bei Katrin Hohmeyer und Eva
Kopf, die immer ein offenes Ohr auch f¨ ur die irrelevantesten Probleme hatten.
und meiner Schwester Susanne B¨ uttner bedanken, die mich bei diesem Vorhaben aber auch in allen anderen Lebenslagen stets unterst¨ utzt haben.
Kaum m¨ oglich w¨ are das Vorhaben auch ohne die Unterst¨ utzung meiner Freun- din Ariadna Ripoll Servent gewesen. Ich kann ihr gar nicht genug danken f¨ ur ihre beeindruckenden Motivationsk¨ unste, ihr Verst¨ andnis und ihre Hilfe in den verschiedensten Situationen, nicht nur bei der Korrektur des englischen Textes.
Abschließend m¨ ochte ich mich bei allen bedanken, die ich hier nicht explizit auff¨ uhren konnte, die mich aber dennoch in vielf¨ altiger Weise unterst¨ utzt haben, sei es nur, dass sie meinen in den letzten Wochen vor Abschluss der Arbeit stetig wechselnden Gem¨ utszustand klaglos hingenommen haben.
N¨ urnberg, Juli 2010
Thomas B¨ uttner
Contents
1 Introduction and Motivation 1
2 Wage Data 7
2.1 Wage Information in Surveys and Register Data . . . . 7
2.1.1 Surveys . . . . 8
2.1.2 Register Data . . . 11
2.2 Register Data of the German Federal Employment Agency . . . 13
2.3 The IAB Employment Sample (IABS) . . . 15
3 Censoring in Wage Data 19 3.1 The German Social Insurance System . . . 20
3.2 Contribution Limits and Censoring . . . 21
3.3 Censored Wage Data in Other Countries . . . 25
3.3.1 U.S. Current Population Survey (CPS) . . . 25
3.3.2 U.S. Social Security Administration Earnings Records (SSA) . . . 27
3.3.3 Austrian Social Security Database (ASSD) . . . 28
4 Modeling Censored Data 29 4.1 Parametric Approaches . . . 30
4.2 Semiparametric Approaches . . . 35
4.3 Nonparametric Approaches . . . 37
4.4 Censored Quantile Regression . . . 38
4.5 Advantages and Disadvantages . . . 39
5 Studies Based on Censored IAB Data 41 5.1 Gender Wage Gap . . . 41
5.2 Wage Inequality . . . 44
I
5.3 Central Wage Bargaining and Union Wages . . . 46
5.4 Wage Rigidity . . . 47
5.5 Labor Supply . . . 48
5.6 Regional Studies . . . 48
5.7 Other Wage Analyses . . . 49
6 Multiple Imputation 57 6.1 Missing-Data Mechanisms . . . 57
6.2 Handling Missing Data . . . 59
6.2.1 Simple Approaches . . . 59
6.2.2 Weighting Adjustments . . . 60
6.2.3 Single Imputation . . . 60
6.3 Principles of Multiple Imputation . . . 62
6.3.1 Combining Rules for Multiply Imputed Data . . . 66
6.3.2 Advantages of Multiple Imputation . . . 67
6.3.3 Multiple Imputation for Censored Variables . . . 68
7 Imputation for Right-Censored Wages 71 7.1 Homoscedastic Imputation Approaches . . . 75
7.1.1 Homoscedastic Single Imputation . . . 75
7.1.2 Multiple Imputation Assuming Homoscedasticity (MI- Hom) . . . 75
7.2 Heteroscedastic Imputation Approaches . . . 78
7.2.1 Single Imputation Considering Heteroscedasticity . . . . 79
7.2.2 A First Simulation Study . . . 80
7.2.3 Multiple Imputation for Right-Censored Wages Consid- ering Heteroscedasticity (MI-Het) . . . 80
8 Validation of the Approaches 83 8.1 Simulation Study using the IABS . . . 85
8.1.1 Creating a Complete Population . . . 85
8.1.2 Simulation Study . . . 86
8.1.3 Results . . . 89
Homoscedastic data set . . . 91
Heteroscedastic data set . . . 91
8.2 Simulation using External Data . . . 93
8.2.1 Simulation Study Based on a Log Transformation . . . . 97
CONTENTS III 8.2.2 Simulation Study Based on a Cube Root Transformation 99
8.2.3 GLS Estimation in the Analysis Step . . . 104
8.2.4 Reduced Set of Variables in the Model . . . 106
8.2.5 Differing Imputer’s and Analyst’s Models . . . 111
8.2.6 Different Transformations in the Imputer’s and Ana- lyst’s Model . . . 113
9 Alternative Approaches 117 9.1 Univariate Imputation . . . 118
9.2 Combining with External Data . . . 121
9.3 Starting Values from External Data . . . 126
9.4 Minimum Requirements . . . 129
10 Applications 137 10.1 Typical Examples from Economic Research . . . 137
10.1.1 Average Wages . . . 138
10.1.2 Wage Inequality . . . 139
10.1.3 Blinder-Oaxaca Decomposition . . . 141
10.2 First Studies Based on Imputation Approaches . . . 144
10.3 Some Final Suggestions for Imputers . . . 146
11 Conclusion and Outlook 149 Appendix 153 A.1 Additional Simulation Studies . . . 155
A.2 Confidence Interval Overlap . . . 159
Bibliography 165
List of Figures
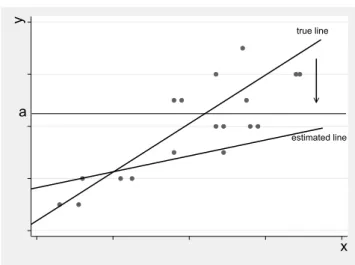
2.1 Distribution of daily wages in logs in the IAB Employment Sam- ple (IABS) in West Germany 2000. . . 18 4.1 Bias of estimation based on censored data . . . 30 7.1 Residuals against fitted values of observed daily wages in the
IAB Employment Sample. . . 79 7.2 Residuals against fitted values of observed daily wages in logs
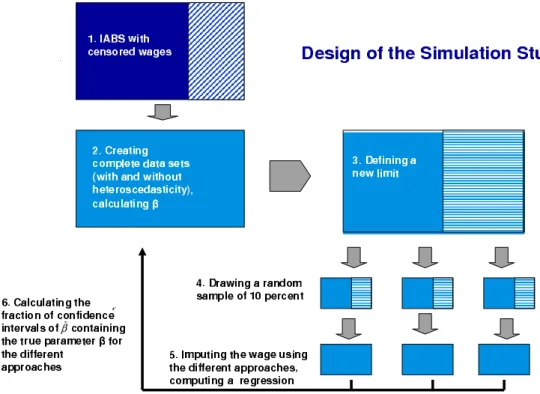
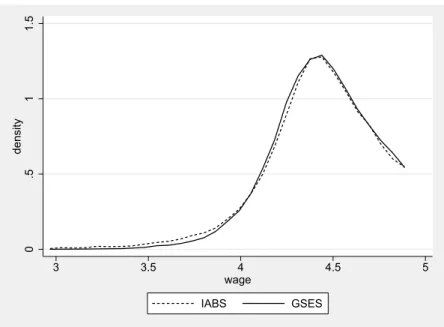
in the IAB Employment Sample. . . . 79 8.1 Design of the simulation study . . . 88 8.2 Kernel density estimates of wages up to the contribution limit
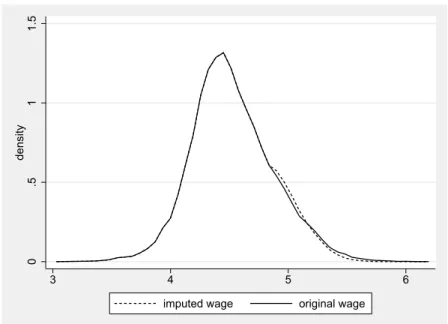
in the IABS and GSES (2001) . . . 95 8.3 Kernel density estimates of original wage versus imputed wage . 98 8.4 Distribution of β b
M Iin the analysis step of the simulation study 99 8.5 Normal Q-Q plot comparing randomly generated, independent
standard normal data to the wage distribution . . . 103 9.1 File concatenation of the IAB Employment Sample with exter-
nal data . . . 122 9.2 Kernel density estimates of imputed wages in the IABS and
original wages in the GSES (2001) . . . 122 10.1 Average daily wages by education groups . . . 139 10.2 Blinder-Oaxaca decomposition results (All persons) . . . 143 10.3 Blinder-Oaxaca decomposition results (Univ. or college degree) . 143
V
List of Tables
2.1 Versions of the IAB Employment Sample . . . 16
3.1 Contribution limits West Germany . . . 22
3.2 Contribution limits East Germany . . . 23
3.3 Fractions of censored wages in the IAB Employment Sample (Males in West Germany) . . . 24
5.1 Recent studies based on IAB data . . . 55
8.1 Simulation studies in Chapter 8 . . . 84
8.2 Results of the homoscedastic data set . . . 90
8.3 Results of the heteroscedastic data set . . . 92
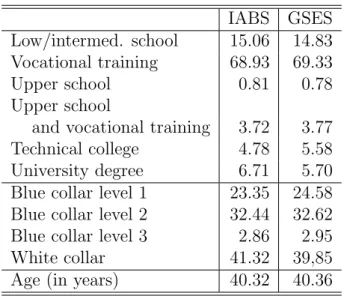
8.4 Comparison of shares of education groups, shares of job levels groups, and average age (IABS and GSES 2001) . . . 96
8.5 Simulation results based on a lognormal transformation . . . 100
8.6 Simulation results based on a cube root transformation . . . 102
8.7 Simulation results based on GLS estimation in analysis step . . 105
8.8 Results of a simulation study using a limited set of variables . . 107
8.9 Results of an imputation in education groups . . . 109
8.10 Results based on a large imputation model and a small analyst’s model - Example 1 . . . 110
8.11 Results based on a large imputation model and a small analyst’s model - Example 2 . . . 110
8.12 Results of a simulation study with differing imputation and analysis models . . . 112 8.13 Results of a simulation study with log transformation in the
imputation step and cube root transformation in the analysis step114
VII
8.14 Results of a simulation study with cube root transformation in the imputation step and log transformation in the analysis step 115 9.1 Univariate imputation versus MI-Het . . . 119 9.2 Imputation using external data versus MI-Het . . . 125 9.3 Imputation using external starting values versus MI-Het . . . . 127 9.4 Multiple imputation based on external quantiles . . . 132 9.5 Univariate imputation based on external quantile information
versus MI-Het . . . 135 10.1 Wage inequality for men in West Germany (2001) . . . 140 10.2 Blinder-Oaxaca decomposition of differences in mean wages by
gender (All) . . . 141 10.3 Blinder-Oaxaca decomposition of differences in mean wages by
gender (University or college degree) . . . 142 A.1 Simulation results based on untransformed wages (Section 8.2.2) 156 A.2 Results of a heteroscedastic imputation using external data ver-
sus MI-Het (Section 9.2) . . . 157 A.3 Results of an imputation using external data versus MI-Het
(only variables observed in IABS and GSES, Section 9.2) . . . . 158
A.4 Comparison of confidence interval overlaps - Example 1 . . . 162
A.5 Comparison of confidence interval overlaps - Example 2 . . . 163
A.6 Comparison of confidence interval overlaps - Example 3 . . . 164
Chapter 1
Introduction and Motivation
Censoring of the dependent variable is a very common problem with micro- data. In case of a censored variable, all values in a certain range are reported as a single value, which means the variable is partly continuous but has multi- ple observations at one point. This often occurs when the variable is zero for a significant part of the population but many different positive outcomes can be observed for the rest of the population. Common examples for this situation are vacation expenditures, automobile expenditures, hours of work, or charita- ble contributions. Wooldridge (2002, p. 517) calls this kind of variables ‘corner solution outcome’. In such cases standard estimation techniques, like, e.g., or- dinary least squares, are inconsistent because these methods fail to account for the difference between limit observations and continuous observations.
Wooldridge (2002) defines a second category of censoring: data censoring. In case of data censoring we have a variable with quantitative meaning, y
∗. Due to a data problem y
∗is censored from above and/or below and therefore can- not be observed for some part of the population. If y
∗was observed for the entire population, standard estimation techniques could be applied, but due the censoring specific censored data models have to be adapted. Censoring from below, also called left-censoring, frequently appears with environmental data due to detection limits of laboratory assay procedures (see, e.g., Helsel (1990) or Newton and Rudel (2007)). Censoring from above or right-censoring is a common problem of survey data. An important example are the top-coded income variables in the U.S. Current Population Survey (CPS) conducted by the Census Bureau. Here, censoring is used as a measure to ensure confiden- tiality of the respondents. Therefore, if earnings are to be analyzed from these
1
data, standard models cannot be applied.
Generally, the problem of data censoring concerning wage and income variables occurs frequently in all fields of economics and sociology, where these variables are in the center of interest of many studies. For a large number of research questions, like analyzing the gender wage gap, assessing the determinants of wage returns to education, evaluating the effects of changes in the institutional and legal framework or several other applications, it is interesting to use wage data. To address this kind of questions two types of data are usually used:
surveys and process generated data, i.e., administrative data. Administrative data have several advantages over survey data, like a large number of obser- vations, no nonresponse burden, and no problems with interviewer effects or survey bias. Unfortunately, in many large administrative data sets of economic or sociological interest some variables are not entirely available. This applies prevalently to wage and earnings information, which are often top-coded or right-censored due to manifold reason. The data may not be available due the data collection process, artificially censored to ensure confidentiality, or just not reliable because high wage earners tend above average not to answer income questions.
An important example for this problem is the German IAB Employment Sam- ple (IABS), which represents administrative data coming from the social se- curity systems. Here, right-censoring of wages occurs due to the contribution limit in the German social security system. This data set represents approx- imately 80 percent of the employees in Germany. The IABS includes, among others, information on age, sex, education, wage, and the occupational group (see Bender et al. (2000)) and is based on the register data of the German social insurance system. The contribution rate of this insurance is charged as a percentage of the gross wage. Therefore, if the gross wage is higher than the current contribution limit only the amount of the ceiling is liable for the con- tribution. In 2010, the contribution limit in the unemployment and pension insurance system is fixed at a monthly income of 5,500 euros in West Germany and at 4,650 euros in East Germany. Therefore, since wages are only recorded up to the contribution limit, the wage information in the sample is censored at this limit.
Due to its importance for all kind of researchers in Germany, the thesis focuses
on the right-censored wage variable in the IAB Employment Sample. Never-
theless, all suggested approaches are generally valid for all kind of data sets
3 faced with censoring from above or below.
In the literature a wide range of models to handle censored data is proposed.
The most famous is without any doubt the censored regression model first pro- posed by Tobin (1958). Other models include Powell’s (1984) censored least absolute deviation method (CLAD) or the iterative linear programming algo- rithm by Buchinsky (1994). While most of these models are intended to be used for direct estimation, we use an alternative approach. We treat the problem of censored wages as a missing data problem and impute the censored wages using multiple imputation. The theory and principle of multiple imputation originates from Rubin (1978) and involves replacing each missing value by a number of imputed values yielding to m imputed data sets. This number may be rather small; usually m = 5 times can be regarded as an adequate number.
Here, the goal is not to provide an estimation method that is applicable to get the estimates of interest for a particular research question, but to provide a complete data set that can be used by researcher to examine a variety of re- search questions. Once the data are imputed, these analyses can be performed applying standard methods and models. Therefore, multiple imputation has the advantage that analysts do not have to familiarize themselves with multi- ple imputation or other models for censored data. As the data can be analyzed like any complete data set, multiply imputed data create new potential for a wide range of research questions. Even research questions, for which no appli- cable models for the analysis of incomplete data exist, can be easily examined using multiply imputed data and standard estimation techniques.
Gartner (2005) proposes a non-Bayesian single imputation approach to solve the problem of censored wages in the IAB Employment Sample. As it will be discussed later, single imputation has some serious drawbacks. The main criticism is that single imputed data yield biased variance estimates making multiple imputation generally preferable (see, e.g., Little and Rubin (1987, 2002)). The main argument to impute missing values multiply is to be able to calculate correct variance estimates. Here, the uncertainty due to the impu- tation can be reflected in the final variance estimates by adding a correction term based on the variance between the results of the m different imputations.
A multiple imputation method for right-censored wages based on draws of a
random variable from a truncated distribution and Markov chain Monte Carlo
techniques is suggested by Gartner and R¨ assler (2005). Both approaches that
are suggested in the literature to solve the censoring in the IABS assume ho-
moscedasticity of the residuals. But contrary to this assumption, the variance of income is usually smaller in lower wage categories than in higher categories, thus assuming homoscedasticity in an imputation model is highly question- able. This becomes evident if one thinks of the wage dispersion within edu- cation groups. While in lower groups, there is generally little wage inequality, wages of highly skilled employees, for example holding an university degree, may differ significantly. Therefore, in this thesis new imputation methods al- lowing for heteroscedasticity are suggested. In a first step a single imputation procedure is developed. Furthermore a new multiple imputation approach will be presented. First simulation studies show that in case of heteroscedasticity this approach is superior to the two approaches assuming homoscedasticity.
Moreover, it does not matter if the algorithm considering heteroscedasticity is chosen in a homoscedastic case, since it just represents a generalization of the homoscedastic approach and therefore works well in case of homoscedasticity.
Whereas one goal of this thesis is to present new imputation approaches that are applicable for right-censored wages, a main objective will be also to con- firm the validity of multiple imputation approaches in general and to show the superiority of the new approach considering heteroscedasticity in a wide range of situations. In a series of simulation studies different approaches are evaluated to confirm the quality of the multiply imputed data. Besides simu- lated data, uncensored wage information of the German Structure of Earnings Survey (GSES) 2001 is employed to assess the quality of imputation. Later, the external complete wage information is also used for the imputation model.
The first reason to do so is to try to develop an even more robust imputation technique, the second is to have a benchmark for the proposed approaches, that work without external information.
The thesis is organized as follows. Chapter 2 gives an overview on German databases that are applicable to analyze research questions concerning wages.
First, we distinguish between survey and register data. Second, the data stem-
ming from the German Federal Employment Agency, including the IAB Em-
ployment Sample is presented and its potential for analyses discussed. In
Chapter 3, the German social insurance system is briefly described in order to
explain why censoring occurs in the IAB Employment Sample. This explana-
tion is followed by some examples of other wage data affected by censoring in
order to illustrate that the necessity of appropriate solutions to handle censored
data is not restricted to the German data. On the contrary, the imputation
5
approaches addressed here are applicable to various surveys and other kind
of data sets whose potential is hindered by censoring. Chapter 4 discusses
censored models applicable to the analysis of various research questions. To
assess the potential of multiply imputed wages in the IAB Employment Sam-
ple, Chapter 5 gives an overview of studies based on the wage data of the
IABS. These studies are presented to illustrate the variety of analyses that are
performed using the IABS and the multitude of techniques that are applied
to handle the censoring. This overview shows that multiply imputed wages
generate new potential in various fields. Beyond, by means of this overview
one can easily see that multiple imputed data simplify the analysis of wages
in the IAB Employment Sample. Before specific imputation approaches for
right-censored wages are presented, Chapter 6 offers an introduction to multi-
ple imputation in general. The chapter starts with the explanation of different
missing-data mechanism, continues by exposing rather simple imputation ap-
proaches and finally addresses the theory of multiple imputation. Chapter
7 introduces imputation approaches for right-censored wages. This chapter
starts with explaining approaches assuming homoscedasticity of the residuals
and later presents new approaches considering heteroscedasticity. Chapter 8
to 10 evaluate these approaches and confirm the superiority of the new mul-
tiple imputation approach considering heteroscedasticity. Chapter 8 describes
a series of simulation studies to compare the different approaches. The first
two simulation studies are based on simulated wage data generated using the
IABS, the following simulation studies are based on the German Structure of
Earnings Survey, which contains uncensored information on wages. In Chap-
ter 9, alternative approaches to the approach considering heteroscedasticity are
suggested and evaluated. Finally Chapter 10 presents some real world exam-
ples. The first part of the chapter compares results of three research questions
used as examples. Results based on original complete data, censored data,
and multiply imputed complete data are compared to demonstrate once more
the validity of imputed data. The second part reviews recent studies based
on one of the imputation approaches, that were discussed in this thesis. The
conclusion summarizes the main findings and gives an outlook towards future
steps. These involve providing access to the proposed imputation algorithms
and multiply imputed versions of the IAB Employment Sample to researchers
both at the IAB and other research institutions.
Chapter 2 Wage Data
By definition, wage is the financial compensation a worker receives in exchange for his labor, hence it is a central element of the labor market and examining wages is a central issue in labor economics and labor market research. For that reason several data sources exist, that cover the broad range of different aspects related to the analysis of wages. This chapter gives an overview on this kind of data sources in Germany starting with survey data and followed by register or administrative data sets. Finally, the Chapter ‘Wage Data’
introduces the register data of the German Federal Employment Agency, that are stored, edited and released to researchers at the Institute for Employment Research.
2.1 Wage Information in Surveys and Register Data in Germany
To address questions concerning wages, two types of data are usually used:
surveys and process generated data, i.e., administrative data. In Germany, several data sources for both types of data exist. In order to be able to classify advantages and disadvantages of administrative data in general and the data of German Federal Employment Agency in particular, this section briefly de- scribes the most important ones. Some of the data sets cover several sources of income and are not restricted to wages or labor earnings. Many report income at the individual and household level. As we are interested in data to analyze wages, we report here mainly surveys and administrative data that admit to analyze individual income from the labor market.
7
2.1.1 Surveys
As Lewis-Beck et al. explain “The social survey is a widely used method of collecting and analyzing social data for academic, government, and commercial research” (Lewis-Beck et al., 2004, p. 1102). Surveys are widely accepted as a means of collecting information about populations, but also face criticism due to some shortcomings. For, instance methods of collecting survey data may be subject to error due to sampling problems and flawed data collection instru- ments and methods. Especially the reliability of high wages is questionable in surveys. In a study examining consistency of income in 2002 across eight major U.S. surveys, Czajka and Denmead (2008) found out that a large percentage of yearly incomes is divisible by 5,000, suggesting that many respondents are rounding when reporting income. Nevertheless, we briefly describe the most important German surveys containing wage and income information.
German Socio-Economic Panel Study (GSOEP)
The German Socio-Economic Panel Study (GSOEP) is intended to offer mi- crodata for research in the social and economic sciences. It is not restricted to the field of employment and wages, but includes as well information on other fields such as living conditions, values, or willingness to take risks. The GSOEP is not only used for basic academic research but also for policy-related social reports. It is conducted annually as a longitudinal study of private households since 1984 in West Germany and since 1990 in East Germany. In 1984, 5,921 households with 12,290 individual respondents participated in the
‘SOEP West’, in 2007 3,337 households with 5,963 respondents were still par- ticipating. In the ‘SOEP East’ sample, 2,179 house-holds with 4,453 members responded in the first year 1990; in 2007, 1,654 households and 3,067 indi- viduals still participated. The GSOEP contains, apart from other sources of income like social security transfers, information on the gross and net monthly labor market income of all household members. Since 2002, a subsample of high income households which is selected independently from all other subsam- ples is added in order to oversample these households. Originally, the selection scheme required that the responding household had a monthly income of at least 7,500 DM (3,835 euros) to be relevant this subsample. From 2003, only households with a net monthly income of at least 4,500 euros were included.
Further advantages of this survey are its panel design and the information on
2.1. WAGE INFORMATION IN SURVEYS AND REGISTER DATA 9 the household context. Besides, it is referred to as the largest survey of foreign- ers and immigrants in Germany. As it is conducted as a survey the problems concerning the reliability of the wage information applies to this data set as well. More information on the survey and current results can be found in Headey and Holst (2008) or Haisken-DeNew and Frick (2005). A scientific use file is released by the research data center of the GSOEP at the German Institute for Economic Research (DIW) in Berlin.
Income and Expenditure Survey (IES)
The Income and Expenditure Survey (IES) is a data source applicable to the analysis of the different components of household income, income tax, welfare contributions and benefits received, savings, and the structure and develop- ment of household consumption. It has been conducted since 1962/63 in West Germany and since 1994 in East Germany. Since the wave of 1973, it is carried out every five years. About 0.2 percent of all households in Germany partici- pate in each wave. The IES is a proportional sample as households are chosen according to a quota plan. The aim of this survey is to cover in-depth data on income and expenditure of private households. It is mainly used for income analysis, but provides information on a wider range of research fields such as the composition of households, participation in professional life, consumer goods consumption, wealth, level of assets and debt of private households and, as previously mentioned, type and level of income, including labor market earn- ings. A problem of this survey is that households with a monthly net income above 18,000 euros are not included because these data are considered as not statistically reliable. Another drawback is that foreign citizens in Germany are not sampled representatively. Hence, this data do not allow to study income of foreigners or to compare income of foreign and German citizens. The data can only be accessed by appointment with the Federal Statistical Office by members of independent German research institutions.
Microcensus
The Microcensus is an official survey conducted by the Federal Statistical Of-
fice and is intended to give a snapshot of the entire population by questioning
one part of it. Its purpose is to provide statistical information on the eco-
nomic and social situation of the population as well as on employment, the
labor market, and education in order to update the results of the population census. The Microcensus is a representative one percent random sample of all households in Germany, which are about 390,000 households with 830,000 persons in total, including about 150,000 persons in about 72,000 households in East Germany. It is carried out once a year since 1957 (Schwarz, 2001).
Every household stays in the sample for four years and every year 25 percent of the included households are exchanged. All members of the household are interviewed, information for other household members is permitted only under specific premises. The details provided - especially those on employment - refer to a specific report week, normally the last week of April. Main topics of the Microcensus are sociodemographic characteristics (age, sex, nationality, etc.), economic and social situation of individual, household and family contexts, labor market status, questions on general and vocational level of qualification.
It also contains information on income, but restricted to the total individual and household net income, including all sources of income. Another disad- vantage is that income is asked in classes of 200 euros. A drawback of the Microcensus is that the access is restricted since it is not a voluntary survey.
Therefore, the original data of Microcensus is de facto anonymized. In the form of a scientific use file, which contains an anonymized 70 percent sample of the 1 percent sample and just represents a cross-section, it can be obtained by German research institutions.
The German Structure of Earnings Survey (GSES)
The German Structure of Earnings Survey was conducted in 1990, 1992, 1995,
and 2001 in establishments of the manufacturing industry and the service sec-
tor. For 2006 it reports wages from all sectors. The data for 2001 can be
obtained as a scientific use file from the research data center of the German
Statistical Office. All other years can only be accessed on-site. The Ger-
man Structure of Earnings Survey is designed as a linked employer-employee
data set and contains information on about 22,000 establishments and more
than 846,000 employees. The GSES includes information on the individuals
(e.g., sex, age, education, children), on the job (e.g., occupation, job level,
performance group, working times, tenure), on earnings (e.g., gross wage, net
wage, income taxes, social security contributions) and additionally on the es-
tablishment (e.g., number of employees). Since the collection of the GSES is
2.1. WAGE INFORMATION IN SURVEYS AND REGISTER DATA 11 performed at the individual level, the latter provides a comprehensive data set to analyze possible merits to the workplace and personal characteristics. The GSES includes all employees covered by social insurance. The survey is con- ducted in establishments with at least 10 employees. Thus, the sample covers approximately 90 percent of all workers.
The survey is therefore suitable to examine a broad range of questions con- cerning wages. For more details see Forschungsdatenzentrum der Statistischen Landes¨ amter (2006). This survey will play an important role later, when we perform simulation studies to compare different imputation approaches for cen- sored wages. As the structure of this survey is very similar to the variables in the IAB Employment Sample and as it contains uncensored wage information for all employees it is especially appropriate to evaluate the performance of imputation approaches.
Further Surveys
Apart from these surveys several other surveys include questions on earnings on income. One example is the German General Social Survey (ALLBUS/GGSS), which is similar to the American General Social Survey (GSS). Its intention is to collect and disseminate high quality information on attitudes, behavior, and social structure in Germany. Since 2004, the European Union Statistics on Income and Living Conditions (EU-SILC) is conducted in 13 member states of the European Union and includes questions on income as well. In the German wage literature these surveys do not play an important role compared to the surveys discussed previously.
2.1.2 Register Data
Register data, also called administrative or process-generated data, have sev- eral advantages, like a large number of observations, no nonresponse burden and no problems with interviewer effects or survey bias. Especially when data are collected for official reasons, for example for taxation or for calculating unemployment benefits, there is a high interest and relevance for all involved persons to report accurate information and generate correct data. This applies especially to wages and other sources of income, for which reason register data are especially suitable to address questions concerning wages and earnings.
Sometimes, e.g., in the German social insurance, some additional variables
are asked to the employers concerning job classification, education, national- ity or other characteristics of their employees, which increase the value of an administrative data for research issues. One shortcoming of this additional information may be that it is not of primary interest to calculate contribu- tions and benefits, but only asked for statistical reasons. If information is collected for statistical reasons only, it may not be as reliable as those vari- ables collected for the official process. A further advantage of register data is the almost complete absence of panel mortality.
Wage and Income Tax Statistics
The German Wage and Income Tax Statistics report detailed information on all persons liable to income tax as well as on the amount, distribution, and taxation of their income with liability to taxation. Its primary aim is to as- sist political and fiscal decisions and to allocate tax revenues to the states (‘L¨ ander’) and communities, but it is also distributed as a public use file and a scientific use file through the research data centers of the German Statis- tical Office. It is conducted every three years as a secondary statistic from the taxation records of the state revenue authorities. Public and scientific use files are currently available for the years 1992, 1995, 1998, and 2001. The Wage and Income Tax Statistics are a census with about 30 million records, comprising up to 400 variables on about 40 million persons and therefore are the largest secondary statistic on income in Germany (Merz et al., 2005). The data contain information, for example, on taxable wages and income, income tax, social transfer income, but also on socio-demographic characteristics like sex, age, religion, children, location, industry or profession of the tax payers.
More details on this data source can be found in Statistische ¨ Amter des Bundes
und der L¨ ander (2009)(only partly in English). Comprising a large number of
items, the German Wage and Income Tax Statistics represent an applicable
data set for a broad range of research questions. This involves not only fiscal
questions, but also questions related to the income distribution. A main ad-
vantage is that it covers also recipients of high incomes in a very accurate way
as it is based on the records of the revenue authorities. Another advantage is
that not only the wages of employees can be examined, but also the income of
self-employed. Serious drawbacks of this data source are that it is conducted
only every three years and that different years can not easily be compared
2.2. REGISTER DATA OF THE GERMAN FEDERAL EMPLOYMENT AGENCY13 due to frequent changes in the income tax law. Hence, it is mainly useful for
regional comparisons.
Further Register Data
Further administrative data in Germany containing wage information are for example the Social Welfare Statistics and the Housing Allowance Statistics.
Moreover, the branches of the German social security insurance system record administrative data to be able to satisfy their duties. Some of these data are edited and released for researchers. One of these administrative data are the data of the German Federal Employment Agency, which stem from the employment notifications of employers to the employment agency. Edited data sets based on these notifications are provided by the Research Data Center of the German Federal Employment Agency, which is located at the Institute for Employment Research (IAB), the research institute of the Federal Employment Agency. These data and their advantages and disadvantages are discussed in detail in the next section.
2.2 Register Data of the German Federal Em- ployment Agency at the Institute for Em- ployment Research
The Institute for Employment Research provides via its Research Data Center data on individuals, households, and establishments, as well as data that com- prise both establishment and personal information. Some of the data come from surveys like for example the IAB Establishment Panel or the panel study
‘Labour Market and Social Security’ (PASS). Most of the data are process generated and originate from two different sources: One part of the data are collected in the notification process of the social security system, the other part comes from the internal procedures of the Federal Employment Agency for computer-aided benefit allowance, job placement, and administration of employment and training measures.
The IAB files the social security notifications and provides these data in the
form of a history data set known as the Employment History (BeH). Another
database, the Benefit Recipient History (LeH), originates from the internal
data processing modules of the Federal Employment Agency. These databases, BeH and LeH, are linked to form the Employee and Benefit Recipient History (BLH), from which several specific samples are generated:
• The Establishment History Panel (BHP) which is an aggregation of the BLH to the establishment level.
• The linked employer-employee data of the IAB (LIAB) that are formed by matching data from the BLH with the IAB Establishment Panel.
• The Integrated Employment Biographies sample of the IAB (IEBS), gen- erated by matching spells of Employment History (BeH), the Benefit Re- cipient History (LeH), participants in measures and the applicants pool.
• The IAB Employment Samples (IABS) which are drawn from the Em- ployee and Benefit Recipient History (BLH).
While most of the administrative or process-generated data of the Institute for Employment Research can be accessed only by internal researchers or on- site at the Research Data Center of the Federal Employment Agency at the Institute for Employment Research, the IABS is also provided in several ver- sions as a scientific use file. It is therefore an important database for many studies of economic interest concerning the German labor market conducted by researchers of the Institute for Employment Research as well as by ex- ternal researchers.
1All data sets that are based (or partly based) on the Employment History (BeH) coming from the social security notifications con- tain information on wages. In principle the problem of censoring occurs in all these administrative data sets based on these notifications that contain wage information. Even if all proposed imputation procedures are applicable for all administrative data sets provided by the Institute of Employment Research, due to its importance for all kind of researchers, in the following, the focus will be on the IAB Employment Samples.
1More details on the data sets and on the ways to access them can be found at the website of Research Data Centre of the Federal Employment Agency at the Institute for Employment Research (http://fdz.iab.de/en.aspx).
2.3. THE IAB EMPLOYMENT SAMPLE (IABS) 15
2.3 The IAB Employment Sample (IABS)
As mentioned, the German IAB Employment Samples (IABS) are random samples drawn from the IAB Employee History with additional information on benefit recipients and hence are samples of all employees covered by social security. Consequently, self-employed, family workers, and civil servants are not included and therefore the data represent approximately 80 percent of all employees in Germany (see Bender et al. (2000)). Since 1999, also marginal employment (‘Geringf¨ ugige Besch¨ aftigung’) with earnings of 400 euros or less per month, which is not fully liable to social insurance, is included. The IAB Employment Samples comprise a continuous flow of data on employment subject to social security as well as on receipt of unemployment benefits, un- employment assistance, and maintenance allowance, and contain additionally a number of establishment characteristics. Key variables are for example:
• gender
• age
• nationality
• marital status
• number of children
• school education and professional qualifications
• type of employment (especially differentiation between employment cov- ered by social security and marginal employment)
• person group
• gross earnings subject to social security
• profession
• occupational status (including full or part-time employment)
• start and end date of employment
• industry
The differen t v ersions of the IAB Emplo ymen t Sample
Basic file 75-95 Regional file 75-97 Regional file 75-04 W eakly anon ymized v er-
sion 1975-04
Description 1% random sample 1% random sample 2 % random sample 2 % random sample
Emplo y ees co v ered b y so cial
securit y, b enefit recipien ts Emplo y ees co v ered b y so cial
securit y, b enefit recipien ts Emplo y ees co v ered b y so cial
securit y (including marginal
emplo ymen t since 1999),
b enefit recipien ts Emplo y ees co v ered b y so cial
securit y (including marginal
emplo ymen t since 1999),
b enefit recipien ts
559,540 individuals 588,827 individuals 1,360,949 individuals 1,360,949 individuals
P erio d
co v ered W est:
1.1.1975 to 31.12.1995 W est:
1.1.1975 to 31.12.1997 W est:
1.1.1975 to 31.12.2004 W est:
1.1.1975 to 31.12.2004
East:
1.1.1992 to 31.12.1995 East:
1.1.1992 to 31.12.1997 East:
1.1.1992 to 31.12.2004 East:
1.1.1992 to 31.12.2004
Time
reference Emplo ymen t biographies on
a da y-to-da y basis Emplo ymen t biographies on
a da y-to-da y basis Emplo ymen t biographies on
a da y-to-da y basis Emplo ymen t biographies on
a da y-to-da y basis
Regional
structure W est/ East German y W est/East German y, fed-
eral states (Bundeslaender),
348 regions W est/East German y, fed-
eral states (Bundeslaender),
348 regions Emplo ymen t agency (Ar-
b eitsagen tur), districts
(Kreis)
T opics So cio-demographic charac-
teristics So cio-demographic charac-
teristics So cio-demographic charac-
teristics So cio-demographic charac-
teristics
Emplo ymen t-related char-
acteristics Emplo ymen t-related char-
acteristics Emplo ymen t-related char-
acteristics Emplo ymen t-related char-
acteristics
Benefit-related characteris-
tics Benefit-related characteris-
tics Benefit-related characteris-
tics Benefit-related characteris-
tics
Detailed o ccupation and in-
dustry classification Aggregation of o ccupation
and industry classifications Aggregation of o ccupation
and industry classifications Detailed o ccupation and in-
dustry classification
Access Scien tific Use File Scien tific Use File Scien tific Use File On-site use and remote data
access
T able 2.1: V ersions of the IAB Emplo ymen t Sample
2.3. THE IAB EMPLOYMENT SAMPLE (IABS) 17
• establishment location
• establishment size
The IABS is provided as a scientific use file in three versions and one weakly anonymized version that can only be accessed on-site and subsequently by remote data access. Table 2.1 gives an overview over of these four different versions. The main difference between the versions is the anonymization pro- cess. In the scientific use files some variables are aggregated in order to prevent the identification of individuals. In the basic file 75-95 the regional variable is highly aggregated and allows only to separate between East and West Ger- many. In the regional aggregation anonymization concerns the industry and occupation variables. The weakly anonymized version is not aggregated. Be- cause the samples are drawn from the longitudinal processed database of em- ployment notifications, all version contain not only cross-sectional information, but represent panel data. A detailed description of the employment sample can be found in Drews (2007, 2008) or Sch¨ onberg (2009). In the following chapters, the weakly anonymized version will be considered as the IAB Em- ployment Sample.
Originating from the employer notifications, the IABS has one big advantage such that it covers all employees subject to social security in Germany for a long time period. It contains very reliable information on a broad range of variables and therefore is optimally qualified for the analysis of various research questions. The main advantage for wage analysis is that information on the employment history and especially wages is measured more precisely than in surveys like the GSES or GSOEP.
One important disadvantage is caused by the contribution limit of the German social security system. The contribution rate of the insurance is charged as a percentage of the gross wage. If the gross wage is higher than the current contribution limit only the amount of the ceiling is liable for the contribution.
In 2010, the contribution limit in the unemployment insurance system is fixed
in West Germany at a monthly income of 5,500 euros. Therefore as wages
are only recorded up to the contribution limit, the wage information in this
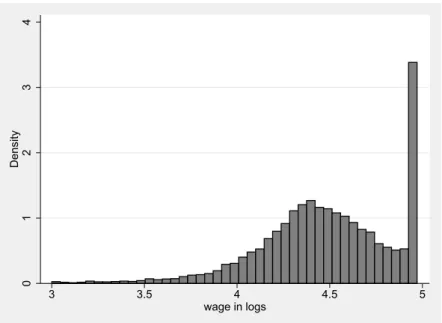
sample is censored at this limit. To illustrate this problem, Figure 2.1 shows
the distribution of wages in the IAB Employment Sample in 2000. To be
able to analyze wages based on this data set and to be able to access the
whole potential of the data, one has to find appropriate techniques that yield
01234Density
3 3.5 4 4.5 5
wage in logs
Figure 2.1: Distribution of daily wages in logs in the IAB Employment Sample (IABS) in West Germany 2000.
unbiased results in the case of censoring. The censoring and its impacts are
discussed in detail in the next chapter.
Chapter 3
Censoring in Wage Data
Many data sets collected by economists or social scientists are incomplete in some way for different reasons. Two specific cases of incomplete data are truncation and censoring. Truncation occurs if all observations for both the dependent and explanatory variables lying outside some range are completely missing. An important example in the literature is the New Jersey negative income tax experiment. Only families with incomes lower than 1.5 times the 1967 poverty were included in this study, families with higher incomes were not selected (see, e.g., Robins (1985) or Maddala (2001)). Therefore, the data contain no information at all for these families. If we have information on the explanatory variable for all individuals, but the dependent variable is missing for some individuals, censoring occurs. In the case of censoring the distribution of the data on the dependent variable is cut off outside of some range. Therefore we observe multiple observations at the endpoint of that range. The advantage in this case is that we know the number of (missing) observations and the value for all explanatory variables, even if the dependent variable is censored. Li and Racine describe the situation of censoring as follows: “Strictly speaking, a sample has been censored if no observations have been systematically excluded, but some of the information has been suppressed. Envision a censor who reads your mail and blacks out part of it - you still get your mail, although some parts of it are illegible” (Li and Racine, 2007, p. 331). Many examples in the empirical literature deal with dependent variables that are zero for a significant fraction of the observations. In this case conventional regression methods are not able to account for the difference between limit (zero) and nonlimit (continuous) observations. The first important studies dealing with this kind
19
of problem are Tobin (1958) examining household purchases of durable goods or Fair (1977, 1978) analyzing the number of extramarital affairs.
In the situation of the register data of the German Federal Employment Agency coming from the German social security insurance system we find a censoring of wages, one of the key variables for many research questions of economic interest. The wages are not left-censored at zero as discussed in the examples above, but we observe data censoring at the right. The following chapter describes this situation in detail.
3.1 The German Social Insurance System
In Germany nearly 90 percent
1of the population is covered by either compul- sory or voluntary social insurance (Deutsche Sozialversicherung, 2009) which consists of five branches. The social insurance schemes are primarily financed through contributions paid by employees and employers. The branches of so- cial insurance include:
• Statutory unemployment insurance: insures employees’ livelihood in case of unemployment,
• Statutory pension insurance: insures aged members and cases of reduced earning capacity. Upon an employees’ death, it insures his or her sur- vivors as well,
• Statutory health insurance: supports maintenance and restoration of good health and eases the financial consequences of illness,
• Statutory accident insurance: helps an employee regain his earning abil- ity after a (work-related) accident,
• Statutory long-term care insurance: provides financial support for those dependent on care and assistance from others.
The social insurance funds are generally financed equally by contributions from insured fund members and their employers. Contributions are calculated as
1Even if only 80 percent of employees are covered by social insurance, nearly 90 percent of the population are covered by social security, because children are insured without con- tribution if at least one parent is covered and families are over-represented as insurants in the social security system.
3.2. CONTRIBUTION LIMITS AND CENSORING 21 percentage of the gross wage, but only up to a contribution limit. For higher earnings the contribution rate remains the same. As the exact wage is not needed to calculate the contribution, wages are in those cases only recorded up to this limit and are consequently censored on the IAB Employment Sample.
The level of the contribution limit differs from branch to branch. Decisive for the extent of censoring in the IAB Employment Sample are the limits in the unemployment and pension insurance branches, which are identical. The ceilings of the unemployment and pension branch are decisive, because these insurances have the highest ceilings. The relevant limits are shown in the following section for the years 1975 to 2010. Constantly updated figures can be found in Deutsche Rentenversicherung (2010).
3.2 Contribution Limits and Censoring
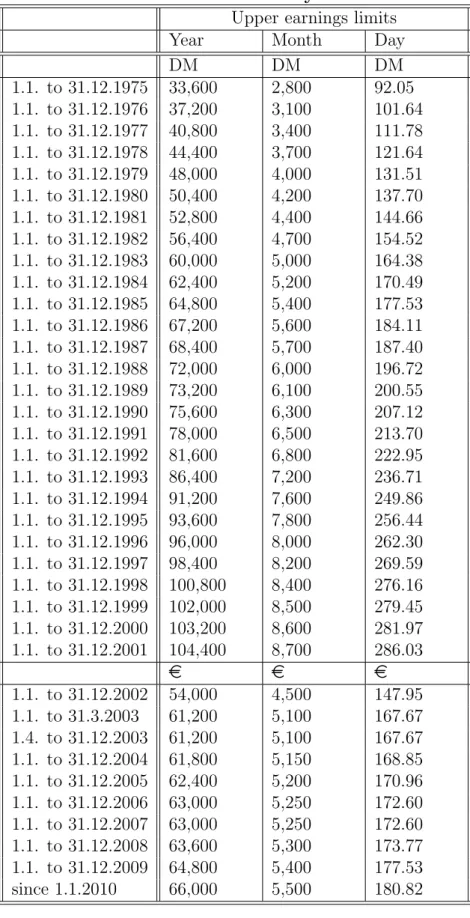
The contribution limits are constantly adjusted, typically every year. Table 3.1 and Table 3.2 show the upper contribution limits in the statutory pension insurance of workers and employees for West Germany from 1975 and for East Germany from 1990, the year of the reunification. Until 2001, the ceilings are shown in German mark (DM), since 2002 in euros ( e )
2. In 2010, the current contribution limit in West Germany is fixed at a yearly wage of 66,000 euros and a monthly wage of 5,500 euros. In East Germany it is fixed at a yearly wage of 55,800 euros and a monthly wage of 4,650 euros. Daily values were calculated by division of the yearly values by the number of calendar days (i.e., 365, 366 in leap years).
An exception is the statutory pension insurance for miners, where the con- tribution limits are higher. For 2010, it is fixed for West Germany at 81,600 euros per year and for East Germany at 68,400 euros. This additional contri- bution limit is relevant in only very few cases, which are difficult to identify.
Because these cases cannot be distinguished from misreporting of wages that are higher than the actual contribution limit, these special cases are normally disregarded. Instead the limits of the pension insurance of workers and em- ployees are used for all cases. Misreported wages and contributions liable to the miners insurance are accordingly cut off at this ceiling.
The wage is reported by the employer for the entire period of employment in
2The relation of the German mark to the euro is officially fixed at 1.95583.