Analyzing the Missing Data of Online Travel Reviews Published in a Large Virtual Travel Community
Lisa Hepp
University of Bamberg,An der Weberei 5, 96047 Bamberg, Germany http://www.uni-bamberg.de
Abstract.
In the present study, a data set of a virtual travel community is to be analyzed. The relationship between two variables of the data set is being examined with a regression model. The network was identified to contain a lot of missing data and the need to handle the missing data was presented. The missing data was found to be missing at random.
A plan to handle the missing data in this specific data set by multiple imputation was developed.
Key words:
Missing Data, Social Network Analysis, Multiple Imputation
Introduction
A huge data set of the virtual travel community trip advisor was generated by Ro- man Tilly [7] . It contains the user generated reviews of many accommodations worldwide. Using this data, we want to examine the relationship between the rat- ing given for service and the rating given for check-in. The reviewers are given the option to rate several aspects of the accommodation such as the service or the location. Many users choose to only fill in some of these categories and leave others blank. This leads to a large amount of missing data in the network. Previ- ous research has shown that simply ignoring missing data when analyzing social networks can lead to bias and lower the significance of the network analysis dra- matically and should therefore be avoided [2]. It is therefore the aim of this work to prepare the given network data to allow further network analysis to be performed.
In order to achieve this, the data was analyzed with a focus on the missing data.
Reasons for the missing data and the missingness mechanism were identified.
SOCNET 2018, February 28, 2018 103
The need for future work was outlined. The missing data will need to be imple- mented on the basis of a suitable multiple imputation method as presented by Huisman [4].
Methodology
. Data
In the following, the data used in this study is being introduced. The reporting guidelines by Stef Buuren are used as an orientation here [1]. Roman Tilly devel- oped a software to collect information available on the online travel platform tri- padvisor. Using this method, around 7.89 million reviews in different languages on attractions worldwide were accumulated. The reviews in this data set were all published between 1999 and 2010. 26.564 randomly chosen reviews from this pop- ulation were used as a sample for the here conducted study. The variables used in this study are listed in Table 1.
Compulsory Variable Description
x rating Overall rating of the property on a scale from 1 to 5
reader_rating_helpful Number of users who found this review help- ful
x no_words_title Number of words in the title of the review x no_words_content Number of words in the written review section
detail_value Value for money on a scale from 1 to 5
detail_rooms Evaluation of the room on a scale from 1 to 5 detail_location Evaluation of the location of the hotel on a scale
from 1 to 5
detail_cleanliness Evaluation of the cleanliness on a scale from 1 to 5
detail_service Evaluation of the service on a scale from 1 to 5 detail_check_in Evaluation of the check in on a scale from 1 to
5
detail_business_service Evaluation of the business service on a scale from 1 to 5
Table 1: Description of the variables in the data set
Whenever the factor variables have levels from 1 to 5, then 1 corresponds to terrible, 2 corresponds to poor, 3 corresponds to average, 4 corresponds to very good and 5 corresponds to excellent.
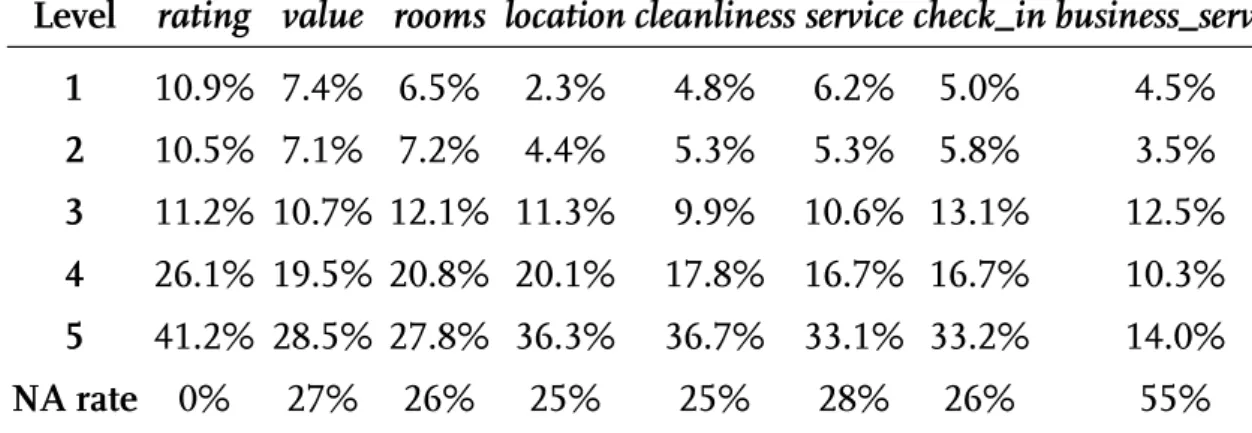
To allow for quantitative analysis, the content in the fields title and content were transformend into integer variables only containing the number of words written in the corresponding section. Reviewers were obligated to fill in the categories title and content and hence there is no missing data here. Users are also required to fill in the category rating before submitting a review. Surprisingly, there are two values missing in this category, this is most likely due to technical issues. The category reader_rating_helpful is by default set to zero and hence this category does not have any missing values either. The value in this category can only be incremented when other users of the platform rate this specific review as being helpful and can thus not be rated by the reviewer itself. The amount of missingness of the categories with missing data is listed in Table 2.
Level
rating value rooms location cleanliness service check_in business_service1 10.9% 7.4% 6.5% 2.3% 4.8% 6.2% 5.0% 4.5%
2 10.5% 7.1% 7.2% 4.4% 5.3% 5.3% 5.8% 3.5%
3 11.2% 10.7% 12.1% 11.3% 9.9% 10.6% 13.1% 12.5%
4 26.1% 19.5% 20.8% 20.1% 17.8% 16.7% 16.7% 10.3%
5 41.2% 28.5% 27.8% 36.3% 36.7% 33.1% 33.2% 14.0%
NA rate 0% 27% 26% 25% 25% 28% 26% 55%
Table 2: Summary of all the categorical variables of the data set. The non- categorical variables of the data set don’t have missing values and are therefore omitted here.
. Data Analysis Method
At first the data set was investigated on a general level, summary statistics and
frequency tables were generated. Then the focus was placed on the missing data
of the data set. Again, frequency tables, combinatorics and plots were produced
to gain a better understanding of the data. Reasons for the missing data and the
missingness pattern need to be identified before further analysis can be conducted
[1] [3]. Huisman distinguishes between data that are missing completely at random
(MCAR), data that are missing at random (MAR) and data that are not missing
at random (NMAR) [3]. When an item is missing completely at random, neither the (unknown) value of the missing item nor the observed items are related to the missigness of an item. In this case, the observed data is simply a random subset of the original set of oberservations, since there is no systematic bias. MAR means that the missingness of an item is not related to its value, but it is related to some of the observed data in the data set. The systematic bias can, in this case, be controlled as it is related to known values. The property MNAR describes the case in which the probability that an item is missing is related to the item’s value.
This mechanism can lead to a large bias and is hard to regulate. To determine the missingness mechanism in the data set, the following hypothesis is set up:
Hypothesis 1
�0: The data is missing completely at random.
�1
: The data is not missing completely at random.
To test the null hypothesis, Little’s test for MCAR was conducted using the R- package BaylorEdPsych on the entire data set [5] . The hypothesis is to be rejected if the corresponding p-value is less than 0.05.
In the next step, a further hypothesis was set up to investigate whether the re- viewer’s satisfaction of the attraction that is being reviewed and the thoroughness of the review are dependent.
Hypothesis 2
�0: The overall rating of a review and the number of missing items in the review are not related.
�1
: The overall rating of a rewiew and the number of missing items in the review are related.
A Chi-Square test of independence was conducted on the value of the categorical variable rating and the number of missing values in the review to test this null hy- pothesis. The test was conducted with 26561 degrees of freedom at a significance level of 0.05.
After investigating the missing data, the complete cases of the data set were analyzed and summary statistics were computed.
. Setting up the Analysis Model
In order to examine the relationship between the two variables detail_service and
detail_check_in , a regression model is set up. Additionally to the above mentioned
categories, the other variables of the data set (rating, reader_rating_helpful, no_words- _title, no_words_content, detail_value, detail_rooms, detail_location, detail_cleanliness, detail_business_service) were also taken into account.
Due to the mixed nature of the variables, some of them are of categorical nature and some are integers, a logistic regression model was chosen.
The logistic regression model is given by:
�
p
( �_
� ) � �0+ �1 �_
ℎ_
� + �2 � +�3
_
�_ℎ
+ �4_ _
� + �5_ _
+�6 �
_
+ �7 �_
+ �8 �_
� + �9 �_
� +�10 �
_
�_
�. Imputation Methods
In the next step that has yet to be performed, an appropriate multiple imputation method will be chosen since Huisman identifies multiple imputation methods to perform the best when imputing missing data in social networks [4]. This imputed data set will then be compared to the complete cases and the performance of the imputation method and the usefulness of the imputed data set will be assessed.
There are several imputation methods that could potentially be useful for the given data set.
Results
. Missingness
The data set used here contains 26.564 travel reviews with 11 categories each.
These variables are listed in Table 1 and a summary of the categorical variables is
given in Table 2. While the platform requires the user to fill in a rating, a title and
a worded review, the other categories may be left blank. It can be seen that most
categories suffer from missingness at a rate of approximately 25%. An exception
to this is the variable detail_business_service with a missingness rate of 55%. The
data set contains 11.150 complete cases, these are reviews without any item nonre-
sponse. It is essential to observe the reasons for missingness and the missingness
patterns and mechanisms before further analyzing the data set. Negligence and
ambiguity may have led to missing data here [8]. Moreover, users may have omit- ted filling in some categories of the review if they felt they were closely related to another category and they wanted to avoid repetition. An example of such a pair of variables are detail_service and detail_check_in. The relationship of the missingness of the two variables is strong. Due to its nature of being a survey whose sample is chosen by self-selection, we do not have unit nonresponse here and only deal with item nonresponse. The hypothesis that the data are MCAR was strongly rejected with a p-value of zero when Little’s test for MCAR was conducted [5] . Therefore, we assume the data to be MAR.
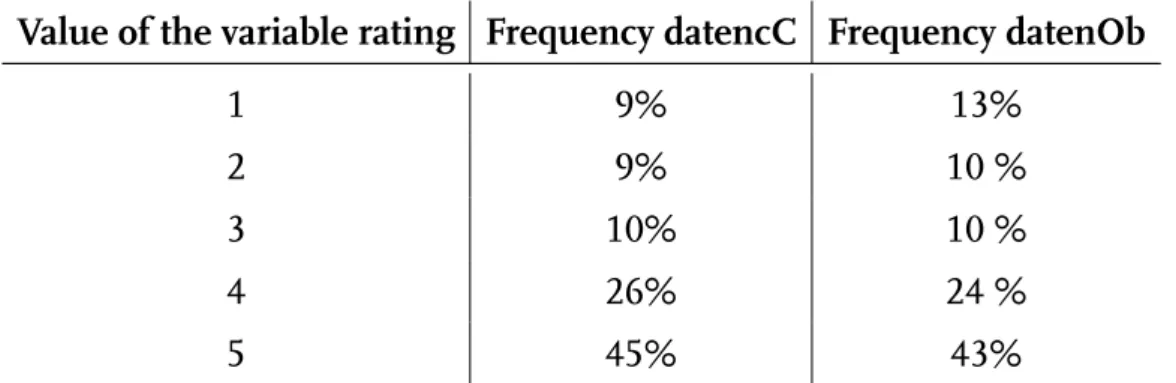
An interesting observation can be made that shows that there are two kinds of people writing reviews on this particular platform: Participants who fill in every single category or only miss out one rating and participants who only fill in the cat- egories one needs to rate in order to submit a review. In fact, 42,0% are complete cases, 28,7% are only missing one item per review and 24,5% of the reviews are missing 7 values. Only 4,8% of the reviews have 2-6 missing items. This raises the question whether missingness only depends on the personality of the person writ- ing the review and is independent of the accommodation that is being reviewed. To check this assumption, I first compared the values of the variable rating from the complete cases and the reviews with seven missing items (”obligatory data”). At first sight, the data looks very similar as can be seen in Table 4 and this strengthens the assumption that missingness is independent of the rating itself. Afterwards, a Chi-Squared test of independence was conducted to check whether rating and number of missing values per review are independent. With a p-value smaller than 2,2e-16 there is strong evidence that these factors are, in fact, dependent and the hypothesis was incorrect.
. Logistic Regression Model
The logistic regression model for the dependent variable detail_service can be seen in the following figure 1.
The model output shows that not only the covariate detail_check_in but also the
covariate rating is highly significant for every value of the categorical variable.
Fig. 1. Output from the logistic regression model
# items missing 0 1 2 3 4 5 6 7
# reviews 42.0% 28.7% 3.7% 0.5% 0.1% 0.1% 0.3% 24.5%
Table 3: Number of reviews that have 0, 1, 2, ... , 7 items missing expressed in percentages
Value of the variable rating Frequency datencC Frequency datenOb
1 9% 13%
2 9% 10 %
3 10% 10 %
4 26% 24 %
5 45% 43%
Table 4: Comparison of the relative frequency of a specific value of the variable rating from the data set containing only complete cases and the data con- taining only the obligatory fields.
Discussion
This work understands itself as making a first step towards dealing with the miss-
ing data of the trip advisor data set to allow for network analysis in subsequent
research. The data set was analyzed and looked at with an open mind and rea-
sons for and properties of the missing data of the data set were described and a
further research plan was outlined. The next step of the analysis would be to find
the most suitable imputation method from the comprehensive list of imputation
methods listed by Huisman and Krause [4]. After imputing the missing data of the
data set, it needs to be compared to the complete cases of the data set to evaluate
the performance of the imputation method on this specific network. Older im-
putation methods do not perform well when the missing data is not MCAR and
therefore a modern imputation method will be chosen to avoid bias [4]. The most
crucial part when applying multiple imputation is the specification of the impu-
tation model [6]. An exponential random graph model (ERGM) will be used here
since this is a promising approach to multiple imputation [4].
References
1. van Buuren, S.: Flexible Imputation of Missing Data. CRC Press (2012), 252–253 2. Borgatti, S., Carley, K., Krackhardt, D.: On the Robustness of Centrality Measures Un-
der Conditions of Imperfect Data. Social Networks 28(2), 124–136 (2006)
3. Huisman, M.: Imputation of Missing Network Data: Some Simple Procedures. Journal of Social Structure 10 (2009)
4. Huisman, M., Krause, R.: Imputation of missing network data. Encyclopedia of Social Network Analysis and Mining 382–392 Springer New York (2017)
5. Little, R.: A test of missing completely at random for multivariate data with missing values. Journal of the American Statistical Association 83, 1198 – 1202 (1988)
6. Nguyen, C., Carlin, J., Lee, K.: Model checking in multiple imputation: an overview and case study. Emerging Themes in Epidemiology 14:8 (2017)
7. Tilly, R., Fischbach, K., Schoder, D.: Mineable or messy? Assessing the quality of macrolevel tourism information derived from social media. Electronic Markets 25(3), 227–241 (2015)
8. Wang, H., Wang, S.: Mining imcomplete survey data through classification. Knowl- edge and Information Systems 24(2) 221–233 (2010)