A TLAS-CONF-2012-042
29March2012ATLAS NOTE
ATLAS-CONF-2012-042
March 20, 2012
Performance of the ATLAS Inner Detector Track and Vertex Reconstruction in the High Pile-Up LHC Environment
The ATLAS Collaboration
Abstract
The performance of the ATLAS inner detector in a high occupancy environment of ap-
proximately 30 inelastic proton-proton interactions per bunch crossing is presented. The
track and vertex reconstruction algorithms are studied in data by comparing track and vertex
properties such as multiplicities, track impact parameters, the number of hits on track and
detector occupancies for a varying number of proton-proton interactions per bunch cross-
ing. Several simulated samples are used to estimate the track and vertex reconstruction
efficiency and to quantify the level of agreement between data and simulation. It is shown
that although pile-up has a significant impact in many areas, the detector design and re-
construction algorithms are sufficiently robust to maintain good performance in such a high
pile-up environment.
1 Introduction
The excellent performance of the LHC in 2011 resulted in more than 5 fb
−1of integrated luminosity being delivered to and recorded by ATLAS. The number of inelastic proton-proton interactions
1per bunch crossing, µ, at the start of a fill increased from 5 in early 2011 to more than 15 by the end of 2011 as shown in Fig. 1. Certain fills had up to 23 interactions for some bunch crossings, reaching the design value of the LHC [1]. Current projections indicate that in 2012 the peak number of interactions may be greater than 30, which is beyond the design specifications of the inner detector (ID) [2]. A natural question is the impact that this large number of interactions has on ID performance. Previous works [2, 3] have studied the expected ID performance in simulation with similar pile-up conditions.
This note presents new results in simulation as well as the first studies in data from special LHC high intensity runs with up to 32 interactions per bunch crossing.
Day in 2011
28/02 30/04 30/06 30/08 31/10
Peak Average Interactions/BX
0 5 10 15 20
25 ATLAS Online s = 7 TeV LHC Delivered
Figure 1: The mean number of interactions per bunch crossing at the peak of the fill for each day in 2011 for data used in physics analyses. The number of events per beam crossing is averaged over a short time period.
The inner detector covers the pseudorapidity range | η | < 2.5 and has full coverage in φ
2. It consists of a silicon pixel detector, a silicon microstrip detector (SCT) and a transition radiation tracker (TRT) located in a 2 T axial magnetic field. Each sub-detector consists of a barrel and two end-caps. A track from a particle traversing the barrel would typically have 3 pixel clusters, 8 SCT strip clusters and more than 30 TRT straw hits. See [4] for further details of the ID.
The ID is particularly sensitive to the increase in particle multiplicity with pile-up. The increasing per-event detector occupancy, i.e. the fraction of channels which need to be read out from each sub- detector, is challenging for the read-out electronics of the individual sub-detectors. The pixel detector, as the detector closest to the interaction point, has the highest particle flux but it has the lowest occupancy because of the high granularity. The strips in the SCT are larger than the pixels such that the highest oc- cupancies in the silicon detectors are in the first layer of the SCT. The TRT, which has smaller granularity
1Henceforth proton-proton inelastic interactions will be referred to as interactions.
2The ATLAS reference system is a Cartesian right-handed co-ordinate system, with the nominal collision point at the origin.
The positivex-axis is defined as pointing from the collision point to the centre of the LHC ring and the positivey-axis points upwards, thez-axis is defined along the beam pipe. The azimuthal angle,φ is measured around the beam axis, and the polar angle,θis measured with respect to thez-axis. The pseudorapidity is defined asη=−ln tanθ/2.
than the silicon detectors, has even higher occupancy.
The increased detector occupancy makes track reconstruction more challenging, which can result in degraded track parameter resolution due to incorrect hit assignment, decreased efficiency and fake tracks from random hit combinations. Degradation of the track reconstruction quality impacts vertex reconstruction resulting in a lower efficiency and an increased fake rate: i.e. vertices reconstructed from a random combination of tracks and/or fake tracks. The increasing density of collisions degrades vertex resolution when a nearby track is included in a vertex or two nearby vertices are merged into a single reconstructed vertex. The track and vertex algorithms have therefore been designed to minimise the impact of such effects from a high density environment.
Section 2 provides a brief discussion of pile-up in the inner detector. The data and simulation samples studied are described in Section 3. Algorithms used to reconstruct tracks (see Section 4) and vertices (see Section 5) are introduced and their expected performance in a high pile-up environment is shown using simulated samples. Track and vertex multiplicity and properties are studied in data with varying amounts of pile-up in Section 6. Finally the modelling of effects due to pile-up in simulation is discussed in Section 7.
2 Pile-up in the Inner Detector
The number of proton-proton interactions per bunch crossing follows a Poisson distribution with mean value µ. During a fill, µ decreases with decreasing beam intensity and increasing emittance, such that the quoted peak value, or µ
peak, is the highest value in a single bunch crossing at the start of the stable beam period of the fill. The number of interactions per bunch crossing also varies between bunches. The number of interactions averaged over all bunch crossings and averaged over the data analysed will be referred to as hµ i.
In data, µ is calculated using the following formula:
µ = L × σ
ineln
bunchf
r(1)
where L is the luminosity, σ
inelis the total inelastic cross-section, n
bunchthe number of colliding bunches and f
rthe LHC revolution frequency. The uncertainty on µ depends on the uncertainties on the luminos- ity and the total inelastic cross-section. The luminosity measurement is performed with dedicated detec- tors and calibrated using special LHC fills. The uncertainty on the integrated luminosity is ∼ 3.9% [5]
for the 2011 physics data. The high-intensity runs studied have an additional 1% uncertainty to account for the extrapolation of direct luminosity measurements from lower intensity runs. The total inelastic cross-section used, σ
inel= 71.5 mb, is taken from Pythia [6]. The value is ∼3% lower than the measure- ment from TOTEM of 73.5 ± 1.9 mb [7]. The total cross-section has also been measured by ATLAS to be 69.1 ±2.4(exp.) ±6.9(extr.) mb [8, 9] by extrapolating a measurement of the cross-section for events in the acceptance of scintillators in the forward region. The difference between the ATLAS and TOTEM measurements and the nominal value from Pythia is taken as a systematic uncertainty on µ of 3%.
When comparing data to simulation, there is an additional uncertainty on the number of interactions reconstructible within the ID acceptance, due to the modelling of inelastic interactions, which is esti- mated to be ∼10%. However this note primarily focuses on data-driven studies which are independent of this additional uncertainty.
During 2011, the proton bunches were typically separated by 50 ns corresponding to twice the design
LHC bunch spacing. Depending on the length of the read-out window of the sub-detector, signals from
neighbouring bunch crossings can be present when the detector is read out. The impact of the interactions
from the neighbouring bunch crossings is referred to as out-of-time pile-up, as opposed to in-time pile-up
which results from additional interactions in the same bunch crossing. Given the timing resolution of the
inner detector, the out-of-time pile-up has a much smaller impact than the in-time pile-up. It slightly increases the occupancy in the TRT, which has a read-out window of 75 ns, in contrast to the silicon detectors which have read-out windows of 25 ns. The 75 ns read-out window for the TRT is needed to read out the full signal that spans a range of ∼50 ns. A veto rejecting out-of-time hits in the TRT minimises the impact of out-of-time pile-up on the TRT. The number of reconstructed vertices is a direct measure of the amount of in-time pile-up on an event-by-event basis because of the time resolution of the silicon detectors.
3 Data and Simulation Samples
This study focuses on data taken during the two fills with high intensity bunches delivered in October 2011. These data had µ
peakof 30 and 34 interactions per bunch crossing. The total luminosity in these datasets is small because there were few bunches in the LHC. The bunches were well-separated such that there was no out-of-time pile-up. Fill A contained only two bunches per beam: a low-intensity pilot bunch and a single high-intensity bunch. Fill B contained 10 high-intensity bunches. The total integrated luminosity recorded by ATLAS from these runs was ∼60 nb
−1in fill A and ∼400 nb
−1in fill B. Fill C with µ
peak= 21 was used to provide a comparison at lower intensity. As this fill contained 1317 bunches, it included out-of-time pile-up.
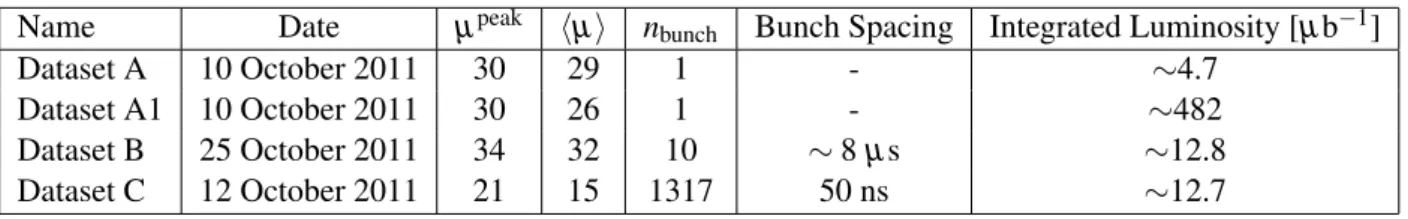
Four datasets were analysed from these fills. Two datasets were extracted from fill A: Dataset A uses 4.7 µ b
−1from a short period at the beginning of the fill with highest intensity and Dataset A1 uses the full recorded dataset of 482 µ b
−1from the fill. Datasets B and C use the first 12.8 µ b
−1and 12.7 µb
−1from fills B and C respectively. The characteristics of the datasets are summarized in Table 1. Datasets A and B are referred to as high pile-up data and Dataset C as medium pile-up data. Datasets A and B do not appear in Fig. 1 because that only shows the µ values for data used in physics analyses. Events were selected using a random trigger in all runs, which was prescaled. The integrated luminosity quoted accounts for the prescale. In addition, data collected throughout 2011 using the same random trigger are used for vertex reconstruction studies.
To validate the description of a high pile-up environment by the simulation, a dedicated minimum bias Monte Carlo sample was produced matching the luminous size of the collision region, or beam spot, and the luminosity profile of fill A. This sample was generated using Pythia 6 with the AMBT2B tune [10]. The uncertainties on the modelling of inelastic events and µ limit the direct comparisons that can be made between data and simulation.
In addition, three simulation samples with differing levels of pile-up were used for studies of the track and vertex efficiency and fake rates. One had no pile-up, i.e. exactly one inelastic collision per bunch crossing, and the other two had a single inelastic collision event overlaid with a Poisson distributed
Table 1: Summary of data studied in this note. The date of the run, peak number of interactions per bunch crossing µ
peak, the average number of interactions per bunch crossing in the analysed data hµ i, the number of high intensity bunches per beam, the spacing between bunches and the integrated luminosity corresponding to the data analysed.
Name Date µ
peakhµ i n
bunchBunch Spacing Integrated Luminosity [µ b
−1]
Dataset A 10 October 2011 30 29 1 - ∼ 4.7
Dataset A1 10 October 2011 30 26 1 - ∼482
Dataset B 25 October 2011 34 32 10 ∼ 8 µ s ∼12.8
Dataset C 12 October 2011 21 15 1317 50 ns ∼ 12.7
number of additional collisions with an average of either 20 or 40 additional collisions. For simplicity, these are referred to as µ = 1, 21 and 41, although this is not entirely correct because of the superposition of one event with the Poisson distributed additional collisions. The event generator used is Pythia 8 [11]
with ATLAS minimum bias tune 4C [12].
4 Track Reconstruction
Previous studies of tracking performance in a low pile-up environment have demonstrated excellent algo- rithmic performance and good agreement between data and simulation [13, 14]. Tracks are reconstructed in the inner detector using a sequence of algorithms [15]. The inside-out algorithm starts from 3-point seeds in the silicon detectors and adds hits moving away from the interaction point using a combinato- rial Kalman filter. Ambiguities in the track candidates found in the silicon detectors are resolved, and tracks are extended into the TRT. The inside-out algorithm is the baseline algorithm designed for the efficient reconstruction of primary charged particles. Primary particles are defined as particles with a mean lifetime of greater than 3 × 10
−11s directly produced in a pp interaction or from the subsequent decays or interactions of particles with a lifetime shorter than 3 × 10
−11s. The tracks reconstructed by the inside-out algorithm are required to have transverse momentum p
T> 400 MeV.
In a second stage, a track search starts from segments reconstructed in the TRT and extends them inwards by adding silicon hits, which is referred to as back-tracking. Back-tracking is designed to re- construct secondaries, which are particles produced in the interactions of primaries. Finally tracks with a TRT segment but no extension into the silicon detectors are referred to as TRT-standalone tracks. This document focus on the impact of pile-up on the baseline inside-out algorithm. There is significant impact from pile-up on both back-tracking and TRT-standalone reconstruction, which will not be discussed here.
The increasing detector occupancy with pile-up can result in nearby hits from other particles con- fusing the pattern recognition algorithm such that the track is not correctly reconstructed. Increased occupancy can lead to an increase in combinatorial fake tracks, i.e. reconstructed tracks which could not be matched to either a primary or secondary particle. Previous studies of the performance of ID recon- struction in high pile-up [3] have indicated that fake tracks can be minimised by tightening the quality requirements on reconstructed tracks. A set of robust requirements is therefore defined by selecting tracks with at least 9 hits in the silicon detectors (pixel + SCT) and exactly zero holes in the pixel detec- tor. A hit is a measurement point assigned to a track. A hole is a non-existing but expected measurement point given a track trajectory. If a track passes through an inactive module, this is not counted as a hole, but instead added to the hits used to meet the hit requirement. In contrast to the robust requirements, the default requirements used in 2011 require at least 7 silicon hits and allow at most two holes in the pixel detector.
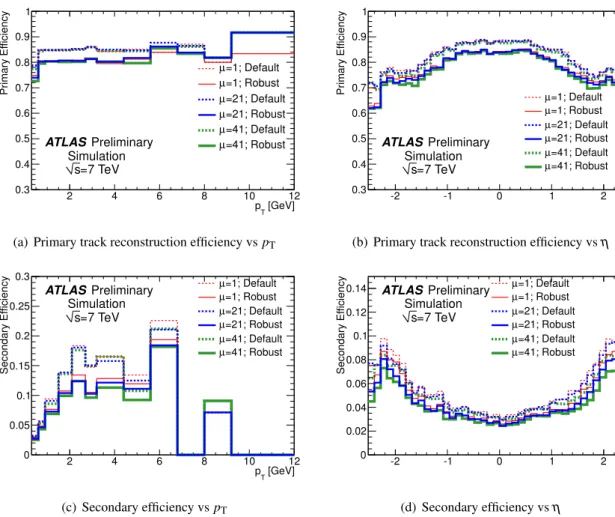
The track reconstruction efficiency is defined as the fraction of primary particles with p
T> 400 MeV and |η | < 2.5 matched to a reconstructed track. The matching criterion is based on the fraction of hits on the track in each sub-detector that were produced by the primary particle. The contributions from each sub-detector is weighted by a scale factor to account for the differences in the expected number of hits on track and the contribution of each hit to the reconstructed track parameter. Figures 2 (a) and (b) compare the track reconstruction efficiency as a function of p
Tand η between samples containing no pile-up (µ = 1) and samples containing significant pile-up. The dashed lines show the efficiency to reconstruct tracks with the default requirements, while the solid lines show the efficiency to reconstruct tracks with the robust requirements. In both cases, the efficiency changes with increasing pile-up by less than 1%. The robust requirements, however, reduce the efficiency by 5%. This efficiency loss is due to the increased hit requirement, which increases the chance that a track that undergoes a hadronic interaction is not found.
The efficiency to reconstruct secondary particles is shown in Figs. 2 (c) and (d). Secondary particles
[GeV]
pT
2 4 6 8 10 12
Primary Efficiency
0.3 0.4 0.5 0.6 0.7 0.8 0.9 1
=1; Default µ
=1; Robust µ
=21; Default µ
=21; Robust µ
=41; Default µ
=41; Robust ATLASPreliminary µ
Simulation
=7 TeV s
(a) Primary track reconstruction efficiency vspT
η
-2 -1 0 1 2
Primary Efficiency
0.3 0.4 0.5 0.6 0.7 0.8 0.9 1
=1; Default µ
=1; Robust µ
=21; Default µ
=21; Robust µ
=41; Default µ
=41; Robust µ
ATLAS Preliminary Simulation
=7 TeV s
(b) Primary track reconstruction efficiency vsη
[GeV]
pT
2 4 6 8 10 12
Secondary Efficiency
0 0.05 0.1 0.15 0.2 0.25
0.3 µ=1; Default
=1; Robust µ
=21; Default µ
=21; Robust µ
=41; Default µ
=41; Robust µ
ATLASPreliminary Simulation
=7 TeV s
(c) Secondary efficiency vspT
η
-2 -1 0 1 2
Secondary Efficiency
0 0.02 0.04 0.06 0.08 0.1 0.12
0.14 µ=1; Default
=1; Robust µ
=21; Default µ
=21; Robust µ
=41; Default µ
=41; Robust µ
ATLAS Preliminary Simulation
=7 TeV s
(d) Secondary efficiency vsη
Figure 2: The primary and secondary track reconstruction efficiency in minimum bias Monte Carlo sam- ples containing exactly one and on average 21 or 41 interactions. The distributions are shown for tracks passing the default (dashed) and robust (solid) requirements. Statistical uncertainties are not shown, but they are significant as there are few secondary particles at higher p
T.
are produced in decays of primary (or other secondary) particles. The secondary efficiency is stable with increasing pile-up in the central region, and decreases by at most 1% in the forward regions. The robust requirements decrease the secondary efficiency by 1-2%.
The fraction of non-primary tracks is shown in Fig. 3 (a) and (b) as a function of η and p
T. This non-primary fraction is the sum of the contribution from secondaries and combinatorial fakes. At µ = 1, the non-primary tracks consist entirely of secondaries and the fake contribution is negligible [16]. The non-primary fraction with the default requirements increases by a factor of 3-5 with increasing pile- up and has a strong dependence on p
T. As the secondary reconstruction efficiency decreases slightly with increasing pile-up (Fig. 2 (d)), this increase can be attributed to increasing fakes. The non-primary fraction is large at low p
T, falls to a minimum around 2 GeV and then rises again. In the central barrel region, the non-primary fraction increases from 10% to 25%, integrated over p
T, between µ = 1 and µ = 41. The increase in fakes with p
Tis due to a combination of a rapidly falling p
Tspectrum (Fig. 3 (c)) with the harder p
Tspectrum of the fake tracks. This leads to a rise in the fraction despite the fact that the absolute number of non-primary tracks is decreasing.
The robust requirements are extremely effective at controlling the non-primary fraction, which is
η
-2 -1 0 1 2
Non-primary Fraction
0 0.1 0.2 0.3 0.4 0.5 0.6 0.7 0.8 0.9 1
=1; Default µ
=1; Robust µ
=21; Default µ
=21; Robust µ
=41; Default µ
=41; Robust µ
ATLAS Preliminary Simulation
=7 TeV s
(a) Non-primary fraction vsη
[GeV]
pT
2 4 6 8 10 12
Non-primary Fraction
0 0.1 0.2 0.3 0.4 0.5 0.6 0.7 0.8 0.9 1
=1; Default µ
=1; Robust µ
=21; Default µ
=21; Robust µ
=41; Default µ
=41; Robust µ
ATLASPreliminary Simulation
=7 TeV s
(b) Non-primary fraction vspT
[GeV]
pT
2 4 6 8 10 12
TdN/dp
10-1
1 10 102
103
104
105
=1; Default µ
=1; Robust µ
=21; Default µ
=21; Robust µ
=41; Default µ
=41; Robust µ
ATLAS Preliminary Simulation
=7 TeV s
(c) TrackpTDistribution
Figure 3: The non-primary fraction in minimum bias Monte Carlo samples containing exactly one and on average 21 or 41 interactions (top and bottom left). The non-primary fraction is the sum of the contributions from secondaries and from fake tracks. The number of reconstructed tracks as a function of p
T(bottom, right). The distributions are shown for tracks passing the default (dashed) and robust (solid) requirements. Statistical uncertainties are not shown, but they are significant as there are few non-primaries at higher p
Tparticularly with the robust requirements.
reduced by a factor of 2-5 and becomes almost independent of the amount of pile-up. There is a small increase in the fraction of non-primaries, on the order of a few percent, in the forward regions. This reduction in the fake fraction does not come without cost: the primary efficiency has been reduced by
∼5%. This efficiency loss is global and largely independent of p
Tand η. While the robust requirements will be shown to improve overall performance in most cases, the corresponding 5% efficiency loss has a significant impact in certain specific topologies, such as electron and τ reconstruction. Due to the observed efficiency loss, these requirements are not currently applied directly during track reconstruction.
These findings are consistent with previous studies [2, 3], because the default requirements were
optimised for high tracking efficiency at low pile-up [16].
5 Vertex Reconstruction
Primary vertices are reconstructed using an iterative vertex finding algorithm [17]. Vertex seeds are obtained from the z-position at the beamline of the reconstructed tracks. An iterative χ
2fit is made using the seed and nearby tracks. Each track carries a weight which is a measure of its compatibility with the fitted vertex depending on the χ
2of the fit. Tracks displaced by more than 7σ from the vertex are used to seed a new vertex and the procedure is repeated until no additional vertices can be found. The beam spot position is used as a three-dimensional constraint. During reconstruction vertices are required to contain at least two tracks, but for the studies in Sections 6 and 7 vertices are required to have at least three tracks for robustness. Performance studies have been previously presented in low-multiplicity data [17] and in simulation with high pile-up [3]. This section extends these studies and focuses on effects that can lead to a loss of vertex reconstruction efficiency with pile-up.
The efficiency to reconstruct a vertex from a minimum bias interaction is shown in Fig. 4 (a) as a function of the average number of interactions per bunch crossing. This is shown both for vertices recon- structed from tracks passing the default requirements and for those reconstructed from tracks passing the robust requirements. The vertex efficiency is calculated with the same track-to-particle matching used to calculate the tracking efficiency. Vertices are matched to interactions by calculating the sum of the weights of the tracks in a vertex matched to each interaction. If the sum of the weights from the tracks from the interaction is greater than 50% the interaction is regarded as having been reconstructed. This requirement ensures that the vertex composition and hence position is dominated by tracks from particles coming from the given interaction.
The efficiency to reconstruct a single interaction is only ∼80% because the simulation includes the full spectrum of minimum bias interactions and, in particular, the single and double diffractive compo- nents. These components have a low particle multiplicity and soft p
Tspectrum in the inner detector acceptance and hence a low primary vertex reconstruction efficiency. The loss of such low multiplicity interactions is not critical, because they contain few particles. The vertex reconstruction efficiency for reconstructible interactions is also shown in Fig. 4 (a). Reconstructible interactions are defined as those interactions having at least two primary charged particles with |η| < 2.5 and p
T> 400 MeV. As expected the efficiency of reconstructible interactions is higher: ∼ 90% for a single interaction.
The vertex reconstruction efficiency decreases with increasing µ to ∼50% at µ = 41. The decreased efficiency is primarily caused by shadowing, when a nearby interaction prevents the reconstruction of the vertex. In these simulation samples the transverse beam spot size is similar to the vertex resolu- tion; therefore nearby vertices are mostly separated along the longitudinal direction. When two or more interactions are too close to be resolved, only one vertex is reconstructed leading to a decrease of recon- struction efficiency. The rate at which interactions are associated to multiple reconstructed vertices, or split vertices, has been studied and found to be less than 1%, with a mild µ -dependence.
The increasing number of fake tracks in a high pile-up environment increases the probability to
reconstruct a fake vertex. In simulation, a vertex is defined as fake if the leading contribution to the
total weight of the vertex is from fake tracks. The fraction of fake vertices reconstructed is shown in
Fig. 4 (b). While at low pile-up the value is below 0.1%, it increases up to 7% at µ = 41 when vertices
are reconstructed with tracks passing the default requirements. Applying the robust requirements to
the tracks eliminates the fake tracks and hence the fake vertices. With the robust requirements the vertex
reconstruction efficiency is reduced by 5% at low pile-up, but at high pile-up the efficiency is comparable
or slightly better than with the default track selection. The improvement to the efficiency at high pile-up
is due to the lower number of fake vertices reconstructed, which can prevent a clean reconstruction of a
real interaction.
µ
0 5 10 15 20 25 30 35 40 45
Vertex Reconstruction Efficiency
0 0.2 0.4 0.6 0.8 1
Minimum Bias interactions Default Robust
Robust (Reconstructible interactions)
ATLASPreliminary = 7 TeV s Simulation,
(a) Vertex reconstruction efficiency
µ
0 5 10 15 20 25 30 35 40 45
Fake Vertex Probability
0 0.01 0.02 0.03 0.04 0.05 0.06 0.07
Minimum Bias interactions Default
Robust ATLASPreliminary
= 7 TeV s Simulation,
(b) Fake vertex probability
Figure 4: The vertex reconstruction efficiency (a) and fake probability (b) as a function of the aver- age number of interactions in minimum bias Monte Carlo simulation. These are shown both using default track selection (blue, dashed) and with the robust track requirements (red, solid). The vertex reconstruction efficiency with the robust track requirements is shown for reconstructible interactions (green, dot-dashed), defined as having at least two stable charged primary particles with |η | < 2.5 and
p
T> 400 MeV.
6 Data-driven Study of Inner Detector Performance in Pile-up
The impact of pile-up in data can be studied directly by comparing the properties of events using the three data samples with medium and high pile-up introduced in Section 3. The number of channels read out in each sub-detector is directly proportional to the charged-particle multiplicity, with corrections for detector noise and track overlap. The occupancy of each detector is defined as the fraction of all channels with signal exceeding a threshold: i.e. for the pixel detector it is the number of pixels in which charge above the threshold was deposited divided by the total number of pixels. In silicon detectors, this does not correspond directly to the number of measurements as nearby pixels or strips are grouped together into clusters.
The TRT occupancy is calculated from all straws passing the out-of-time rejection requirement sim- ilar to the prescription in [18], but with no further selection applied. The fraction of TRT precision hits is discussed in Section 7. Precision hits are well-measured hits that agree with expectations from the combined track measurement. Non-precision hits are those for which the measured track position in the straw is more than 2.5σ from the position given by the combined track measurement.
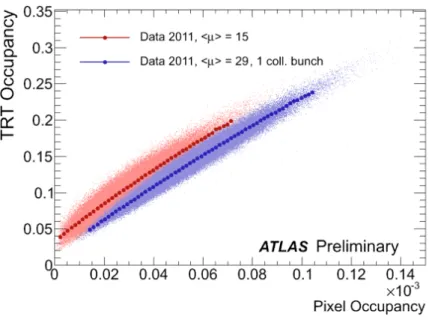
Figure 5 compares the occupancy of the TRT to that of the pixel detector. At a fixed value of µ the pixel occupancy is largely determined by the track multiplicity and the number of interactions. As a fill progresses, the average instantaneous luminosity decreases and the occupancy of each detector decreases. The occupancy distributions in these data have tails up to ∼ 0.012% in the pixel detector and
∼25% in the TRT.
The difference in TRT occupancy between the datasets at fixed pixel occupancy is due to the out- of-time pile-up. As the out-of-time pile-up has very little impact on the pixel detector occupancy, this 3% difference can be taken as a measure of the impact of out-of-time pile-up in the TRT. As the TRT occupancy increases, the signal from two or more particles can overlap in the same straw. At a 20%
detector occupancy, 10% of all hits are expected to be due to such multiple signals. The occupancy in data is consistent with expectations.
Section 4 demonstrated that in simulation with the robust requirements both the track reconstruc-
Figure 5: Comparison of the pixel detector and TRT occupancies in Dataset A and C. Dataset C had a bunch spacing such that the data include out-of-time pile-up, while Dataset A had a bunch spacing such that there were no effects from out-of-time pile-up. Dataset C had hµ i = 15, but µ
peak= 21.
tion efficiency and the non-primary fraction are stable up to µ = 41. In data it is not possible to look at the efficiency or fake rate directly. Given a constant track reconstruction efficiency and a constant fake fraction, the number of reconstructed tracks would be directly proportional to the charged particle multiplicity within the detector acceptance.
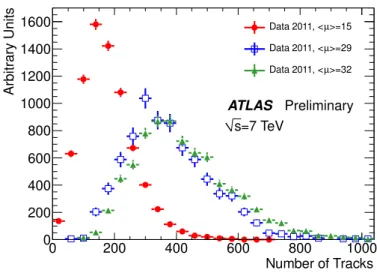
Figure 6 compares the number of tracks reconstructed by the inside-out algorithm in three data sam- ples. The average number of tracks per interaction is listed in Table 2. With the robust requirements the average number of tracks per interaction is stable. Without the robust requirements, the average number of reconstructed tracks has increased by 12%, demonstrating the increase of the fake fraction. As both the average number of particles and the average number of robust tracks per interaction is independent of the number of interactions, this indicates that both the efficiency and fake fraction are likely to be independent of the number of interactions.
Table 2: The average number of default and robust tracks per interaction in data with different amounts of pile-up.
Dataset hµ i Default Tracks/hµ i Robust Tracks/hµi
C 15 11.8 10.3
A 29 12.8 10.2
B 32 13.2 10.3
The quality of the tracks with the robust requirements is demonstrated in Fig. 7 where the number of
hits on track in the pixel detector, SCT and TRT is shown. No change is observed to the pixel and SCT
hit distributions between the datasets, however a small shift is observed in the number of TRT hits on
track. This is the result of changes to the beam spot and to the impact of pile-up. There is an increase at
the sub-percent level in the number of SCT holes (Fig. 7 (d)) as the high occupancy has resulted in some
loss of hits. This is most likely due to problems in the track pattern recognition algorithm or from cluster
Number of Tracks
0 200 400 600 800 1000
Arbitrary Units
0 200 400 600 800 1000 1200 1400
1600 Data 2011, <µ>=15
>=29 Data 2011, <µ
>=32 Data 2011, <µ
ATLAS Preliminary
=7 TeV s
Figure 6: Comparison of the number of reconstructed tracks per event in data containing different amounts of pile-up. The distributions are shown for all tracks meeting the default requirements.
merging.
The distributions of the transverse and longitudinal impact parameters with respect to the primary vertex with the highest Σp
2Tare shown in Fig. 8. Due to the small lateral size of the beam spot, additional interactions are nearby in the transverse direction, such that no change is observed in the transverse impact parameter distribution. The tails of this distribution are dominated by secondary tracks. The unchanged size of these tails indicates that there is no significant change to the secondary efficiency. The distributions of the longitudinal impact parameter, z
0sin θ, have been normalised in the peak region of
|z
0sin θ| < 0.2. The tails increase by a factor of two from Dataset C to Dataset A. As the beam spot has a size in the longitudinal direction of a few centimetres, these tails are due to tracks from additional interactions.
Figure 9 (a) compares the distribution of the number of reconstructed vertices with the robust track requirements in the three datasets. The distributions are approximately Poisson with the distribution in the highest pile-up data extending to 30 vertices.
The average number of reconstructed primary vertices as a function of the average number of interac-
tions per beam crossing is shown in Fig. 9 (b) using data collected throughout 2011 in addition to the high
pile-up datasets to cover a wide range of µ ; these data were reconstructed using the default requirements
on the tracks. A linear fit was made for 1 ≤ µ ≤ 11 and extrapolated to higher values of µ . For µ . 15
the dependence is close to linear, which demonstrates that the vertex reconstruction efficiency is stable in
this region. For µ & 15, the data lie below the fit, demonstrating a reduction of the vertex reconstruction
efficiency, as expected from simulation (see Fig. 4). Other effects, such as the reconstruction of multiple
vertices from one interaction (split vertices) and fake vertices are expected to have a small impact; the
small deviation from the linear extrapolation in Fig 9 (b) suggests that these effects are reasonably well
understood in data as well, and the algorithm is fairly robust even in the presence of pile-up.
Number of Pixel Hits
1 2 3 4 5 6 7 8 9
Number of Tracks
100 200 300 400 500 600 700 800
103
×
>=15 Data 2011, <µ
>=29 Data 2011, <µ
>=32 Data 2011, <µ
ATLASPreliminary
=7 TeV s
(a) Pixel hits
Number of SCT Hits
5 6 7 8 9 10 11 12 13 14
Number of Tracks
100 200 300 400 500 600 700
103
×
>=15 Data 2011, <µ
>=29 Data 2011, <µ
>=32 Data 2011, <µ
ATLASPreliminary
=7 TeV s
(b) SCT hits
Number of TRT Hits
10 20 30 40 50
Number of Tracks
0 10 20 30 40 50
103
×
>=15 Data 2011, <µ
>=29 Data 2011, <µ
>=32 Data 2011, <µ
ATLASPreliminary
=7 TeV s
(c) TRT hits
Number of SCT Holes
-0.5 0 0.5 1 1.5 2 2.5 3 3.5
Number of Tracks
104
105
106 Data 2011, <µ>=15
>=29 Data 2011, <µ
>=32 Data 2011, <µ
ATLASPreliminary
=7 TeV s
(d) SCT holes
Figure 7: Number of pixel, SCT and TRT hits and SCT holes for tracks meeting the robust requirements
in data taken at medium and high pile-up. The distributions are normalised to the same number of
reconstructed tracks. If the bin contents are identical, the markers are overlaid such that only those of
Dataset B are visible.
[mm]
d0
-2 -1.5 -1 -0.5 0 0.5 1 1.5 2
Number of Tracks
103
104
105
>=15 Data 2011, <µ
>=29 Data 2011, <µ
>=32 Data 2011, <µ
ATLASPreliminary
=7 TeV s
(a) Transverse impact parameter
[mm]
sinθ z0
-2 -1.5 -1 -0.5 0 0.5 1 1.5 2
Number of Tracks
103
104
>=15 Data 2011, <µ
>=29 µ Data 2011, <
>=32 µ Data 2011, <
ATLASPreliminary
=7 TeV s
(b) Longitudinal impact parameter
Figure 8: Impact parameter distributions at medium and high pile-up for tracks meeting the robust re- quirements. The transverse impact parameter distributions are normalised to the same total number of tracks. The distributions of the longitudinal impact parameter, z
0sin θ, have been normalised in the peak region of |z
0sin θ| < 0.2.
Number of Vertices
0 5 10 15 20 25 30
Arbitrary Units
0 0.02 0.04 0.06 0.08 0.1 0.12 0.14 0.16 0.18 0.2
> = 15 Data 2011, <µ
> = 29 Data 2011, <µ
> = 32 Data 2011, <µ ATLASPreliminary
= 7 TeV s
(a) Vertex multiplicity
µ
0 5 10 15 20 25 30
<Number of Vertices>
0 2 4 6 8 10 12 14 16 18 20
Data 2011 Linear extrapolation ATLASPreliminary
= 7 TeV s
(b) Vertex multiplicity vsµ
Figure 9: The number of reconstructed vertices with the robust track requirements in data containing
different amounts of pile-up (left) and the average number of reconstructed primary vertices with the
default track requirements as a function of the average number of interactions per beam crossing in data
collected through 2011 (right).
7 Pile-up in Simulation
The simulation and data-driven studies in the previous sections have demonstrated that the track and ver- tex reconstruction algorithms are robust in a high pile-up environment. It is also important to determine how accurately the ID reconstruction of the simulated data corresponds to that seen in the real data, as many physics analyses rely on simulation. A study was made using the simulation sample designed to match Dataset A1 as closely as possible. Due to current uncertainties on comparing µ between data and simulation (see Section 2) the comparisons are made as a function of the number of reconstructed vertices.
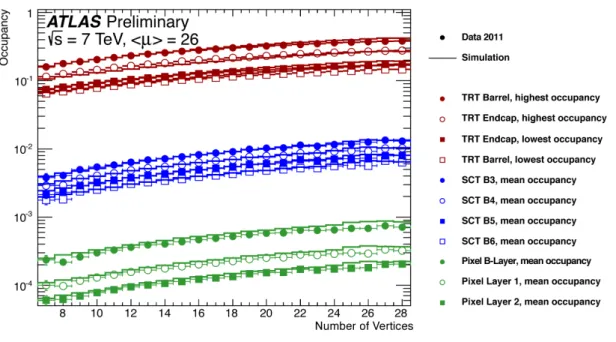
Increasing detector occupancy with pile-up is a limiting factor in the performance of ID reconstruc- tion. The occupancy is directly sensitive to detector effects such as noise as well as the accuracy of the description of particle multiplicities and the p
T-spectrum. Figure 10 shows the increasing occupancy in the inner detector as a function of the number of reconstructed vertices. The occupancy in the pixel detector in simulation is higher than in data. This could be due to limitations in the modelling of the very low- p
Tpart of the particle spectrum, which is most important in the pixel detector, as the minimum momentum a track needs to reach the SCT is larger. The simulation predicts a slightly lower average TRT occupancy at low number of primary vertices.
Figure 10: The occupancy of the inner detector as a function of the number of reconstructed vertices in Dataset A1 (solid markers) and simulation (line). The occupancy is shown separately for each layer in the barrels of the silicon detectors. For the TRT, the occupancy is shown separately for the three straw layers with the highest and lowest occupancy in order to provide an indication of the occupancy range.
The number of tracks in events containing between seven and 29 vertices is shown in Fig. 11. With the robust requirements, the average number of tracks increases linearly with the number of vertices in both data and simulation. The simulation has a small excess in the number of tracks. From studies in simulated samples containing significant pile-up, the fake fraction with robust requirements is expected to be negligible in data. This linear increase indicates that there is no significant increase to the fake fraction or change to the efficiency with pile-up, as expected.
In Section 4 it was shown that without robust requirements, the fraction of combinatorial fake tracks
increases with pile-up. The average number of tracks passing the default requirements is also shown in Fig. 11. In events with more than ∼10 reconstructed vertices, the number of tracks increases non- linearly and faster than with the robust requirements, which indicates the increasing fake fraction. As before, there are slightly more tracks in simulation than in data, however the increase with pile-up is very consistent. This demonstrates that the fake fraction is very similar between data and simulation.
Number of Vertices
0 5 10 15 20 25 30 35
< N u m b e r o f T ra c k s >
0 100 200 300 400 500 600 700 800 900
Data 2011, Default Simulation, Default Data 2011, Robust Simulation, Robust Data 2011, Default Simulation, Default Data 2011, Robust Simulation, Robust
ATLAS Preliminary
> = 26
=7 TeV, < µ s
Figure 11: The average number of tracks per event as a function of the number of vertices in Dataset A1 (closed markers) and simulation (open markers). This is shown for tracks meeting the default re- quirements (black) and the robust requirements (red). Linear fits to the track multiplicity with the robust requirements for events containing 10-17 vertices are indicated with solid red lines. These fits are ex- trapolated to events containing more reconstructed vertices with the dashed lines.
The number of hits on track is an important measure of the track quality. The number of active detector layers crossed by a particle depends on the particle origin and direction. Therefore the average number of hits as a function of η is shown in Fig. 12. These distributions are sensitive to the number of inactive modules and the detector material. For an accurate description in simulation, the beam spot needs to be well-modelled, as the expected number of hits depends on the origin of the particle in z and on the pseudorapidity η. In this dedicated sample, the z-vertex distribution was simulated to match the one observed in data. In addition, the p
Tspectrum of the tracks in simulation was reweighted to reproduce that observed in data. With this reweighting, the number of hits as a function of η is described to within 2%.
The transverse and longitudinal impact parameters with respect to the primary vertex after reweight- ing are shown in Fig. 13. The longitudinal impact parameter is described by the simulation to within 5%.
Discrepancies are observed in the tails of the transverse impact parameter distribution at the level of up to 15%. This could be due to uncertainties on the contributions from secondaries, cluster merging or lim- itations in the modelling of the detector material. Even in this high pile-up environment, the simulation describes the data quite well.
The fraction of tracks with successful extensions into the TRT is shown in Fig. 14 (a) as a function of
the number of reconstructed primary vertices. Only tracks with |η| < 2 are considered in order to avoid
a geometrical bias from tracks outside the TRT acceptance. The simulation slightly overestimates the
fraction observed in data, but agrees to better than 0.5%. The fraction of successful extensions into the
-2 -1 0 1 2
<Pixel Hits>
2 2.5 3 3.5 4 4.5
Simulation Data 2011 ATLASPreliminary
> = 26
=7 TeV, <µ s
η
-2 -1 0 1 2
Data/MC
0.98 1 1.02
(a) Pixel hits
-2 -1 0 1 2
<SCT Hits>
6 7 8 9 10 11 12
Simulation Data 2011 ATLAS Preliminary
> = 26
=7 TeV, <µ s
η
-2 -1 0 1 2
Data/MC
0.98 1 1.02
(b) SCT hits
-2 -1.5 -1 -0.5 0 0.5 1 1.5 2
<TRT Hits>
10 15 20 25 30 35 40 45 50
Simulation Data 2011 ATLAS Preliminary
> = 26
=7 TeV, <µ s
η -2 -1.5 -1 -0.5 0 0.5 1 1.5 2
Data/MC
0.98 1 1.02
(c) TRT hits
Figure 12: The number of pixel, SCT and TRT hits as a function of η for tracks passing the robust re- quirements in Dataset A1 and the corresponding simulation sample. The simulation has been reweighted to match the p
Tspectrum of the data.
TRT is independent of the number of vertices to within 0.5%. Figure 14 (b) shows the fraction of TRT
hits that are precision hits as a function of the number of reconstructed primary vertices. The simulation
overestimates the precision hit fraction by 2-3% due to small differences in the position resolution be-
tween data and simulation. As expected, the fraction decreases as the number of reconstructed primary
vertices increases, but the absolute decrease of ∼10% over the range 7-29 vertices is relatively small
despite the increase in occupancy.
[mm]
d0
-2 -1.5 -1 -0.5 0 0.5 1 1.5 2
Number of Tracks
105
106
107
Simulation Data 2011 ATLASPreliminary
> = 26
=7 TeV, <µ s
(a) Transverse impact parameter
[mm]
sinθ z0
-2 -1.5 -1 -0.5 0 0.5 1 1.5 2
Number of Tracks
105
106
Simulation Data 2011 ATLASPreliminary
> = 26
=7 TeV, <µ s
(b) Longitudinal impact parameter
Figure 13: The impact parameter distributions with respect to the primary vertex of tracks passing the robust requirements in Dataset A1 and the corresponding simulation sample. The simulation has been reweighted to match the p
Tspectrum of the data.
8 10 12 14 16 18 20 22 24 26 28
TRT Extension Fraction
0.88 0.9 0.92 0.94 0.96
Number of Vertices
8 10 12 14 16 18 20 22 24 26 28
Data/MC
0.98 1 1.02
Data 2011 Simulation
ATLAS
=7 TeV s
Preliminary
(a) TRT extension fraction
8 10 12 14 16 18 20 22 24 26 28
TRT Precision Hit Fraction
0.68 0.7 0.72 0.74 0.76 0.78 0.8 0.82
Number of Vertices
8 10 12 14 16 18 20 22 24 26 28
Data/MC
0.96 0.98 1
Data 2011 Simulation
ATLAS
=7 TeV s
Preliminary
(b) TRT precision hit fraction
Figure 14: (left) The fraction of tracks with good TRT extensions in Dataset A1 and simulation as a function of the number of reconstructed primary vertices. Only tracks with |η | < 2.0 are considered.
(right) The fraction of TRT hits on track in Dataset A that are precision hits .
8 Conclusion
As the average number of interactions in the data from the LHC has increased, understanding the per- formance in such high-occupancy scenarios has become a critical issue. A study of the inner detector performance in the presence of pile-up has been presented.
With the data delivered by the LHC to date (up to µ = 32), no evidence has been observed of detector saturation. The track reconstruction efficiency is unchanged. However, when using the track quality requirements developed for high efficiency in low pile-up conditions, the fraction of combinatorial fakes increases with µ . If robust requirements are placed on the tracks, the fake fraction does not increase with µ, but there is a decrease in the track reconstruction efficiency which is independent of µ . No significant changes are observed in the track quality or impact parameter resolution.
The increasing vertex density in events containing many interactions results in a decrease of the vertex reconstruction efficiency, due to interactions that are too close to be resolved. This is adequately described by the simulation, such that the number of reconstructed vertices is a good measure of the number of in-time interactions in the event. The probability to reconstruct fake vertices increases with pile-up but can be controlled with a negligible efficiency loss by applying robust requirements on the tracks used in vertex reconstruction.
Apart from differences noted in the track multiplicity, it has been shown that the simulation describes the impact of pile-up on the track and vertex reconstruction algorithms well. The dependence of the number of tracks on the number of vertices is described to within 10%, which indicates that both the efficiency and the fake fraction are well modelled. The track quality is well described, with the number of hits in each sub-detector as a function of η in data and simulation agreeing to within 2%. Discrepancies are noted in the impact parameter distributions.
The inner detector track and vertex reconstruction has been demonstrated to be robust even in data containing significant pile-up and hence is well prepared for data-taking in 2012.
References
[1] L. Evans and P. Bryant, LHC Machine, JINST 3 (2008) S08001.
[2] ATLAS Collaboration, ATLAS detector and physics performance: Technical Design Report, 1.
CERN, Geneva, 1999.
[3] M. Capeans et al., ATLAS Insertable B-Layer Technical Design Report, CERN-LHCC-2010-013.
ATLAS-TDR-019 (Sep, 2010) .
[4] ATLAS Collaboration, The ATLAS Experiment at the CERN Large Hadron Collider, JINST 3 (2008) S08003.
[5] ATLAS Collaboration, Luminosity Determination in pp Collisions at √
s = 7 TeV using the ATLAS Detector in 2011, ATLAS-CONF-2011-116 (Aug, 2011) .
https://cdsweb.cern.ch/record/1376384. The luminosity uncertainty for the full 2011 data period has been estimated to be 3.9%. The increase arises from the much higher µ values in the second half of the 2011 data sample, which was not covered in the CONF note cited here.
[6] T. Sjostrand, S. Mrenna, and P. Z. Skands, PYTHIA 6.4 Physics and Manual, JHEP 05 (2006) 026, arXiv:hep-ph/0603175.
[7] G. Antchev, P. Aspell, I. Atanassov, V. Avati, J. Baechler, et al., First measurement of the total proton-proton cross section at the LHC energy of √
s =7 TeV, Europhys.Lett. 96 (2011) 21002,
arXiv:1110.1395.
[8] ATLAS Collaboration, Measurement of the Inelastic Proton-Proton Cross-Section at √
s = 7 TeV with the ATLAS Detector, Nature Commun. 2 (2011) 463, arXiv:1104.0326.
[9] L. A. Tompkins, A Measurement of the proton-proton inelastic scattering cross-section at √ s =7 TeV with the ATLAS detector at the LHC. PhD thesis, UC, Berkeley, 2011.
https://cdsweb.cern.ch/record/1367400.
[10] ATLAS Collaboration, ATLAS tunes of PYTHIA 6 and Pythia 8 for MC11,
ATL-PHYS-PUB-2011-009 (Jul, 2011) . https://cdsweb.cern.ch/record/1363300.
[11] T. Sjostrand, S. Mrenna, and P. Z. Skands, A Brief Introduction to PYTHIA 8.1, Comput.Phys.Commun. 178 (2008) 852–867, arXiv:0710.3820 [hep-ph].
[12] ATLAS Collaboration, Further ATLAS tunes of PYTHIA6 and Pythia 8,
ATL-PHYS-PUB-2011-014 (Nov, 2011) . https://cdsweb.cern.ch/record/1400677.
[13] ATLAS Collaboration, √ Tracking Results and Comparison to Monte Carlo simulation at s = 900 GeV , ATLAS-CONF-2010-011 (Jul, 2010) .
https://cdsweb.cern.ch/record/1276323.
[14] ATLAS Collaboration, Performance of the ATLAS Silicon Pattern Recognition Algorithm in Data and Simulation at √
s = 7 TeV , ATLAS-CONF-2010-072 (Jul, 2010) . https://cdsweb.cern.ch/record/1281363.
[15] T. Cornelissen et al., Concepts, Design and Implementation of the ATLAS New Tracking (NEWT), ATL-SOFT-PUB-2007-007 . https://cdsweb.cern.ch/record/1020106.
[16] ATLAS Collaboration, Charged-particle multiplicities in pp interactions measured with the ATLAS detector at the LHC, New J. Phys. 13 (2011) 053033, arXiv:1012.5104.
[17] ATLAS Collaboration, Performance of primary vertex reconstruction in proton-proton collisions at √
s =7 TeV in the ATLAS experiment, ATLAS-CONF-2010-069 (Jul, 2010) . https://cdsweb.cern.ch/record/1281344.
[18] ATLAS Collaboration, ATLAS Inner Detector: Technical Design Report, 1. CERN, Geneva, 1997.
A Timing Performance
The increasing multiplicity with pile-up increases the event reconstruction time and inner detector recon- struction takes a significant fraction of the total reconstruction time. Dedicated studies were performed to tune tracking requirements to optimise the CPU time spent in inner detector reconstruction. These are distinct from the robust requirements described in Section 4 and were designed to optimise the recon- struction time without any performance impact.
The requirements were developed by optimising the early stages of the pattern recognition to reject seeds that never became track candidates. This optimisation reduced the total reconstruction time in the ID by ∼ 30% for the settings developed for the 2012 running as shown in Fig. 15. The reconstruction time was measured on an Intel(R) Core(TM)2 Duo CPU E8500 @ 3.16GH with 3881832 kB of memory. This was measured using a minimum bias signal sample, which has little impact at µ = 31, but a significant impact at µ = 1. The physics impact of these requirements has been studied and found to be well below the sub-percent level.
µ
0 5 10 15 20 25 30
Reconstruction Time [s/event]
0 2 4 6 8
10 2011 ID Reconstruction
2012 ID Reconstruction
2011 ID Reconstruction
2012 ID Reconstruction
ATLAS Preliminary Simulation