Research Collection
Journal Article
Hydrothermal pressure-temperature control on CO2 emissions and seismicity at Campi Flegrei (Italy)
Author(s):
Chiodini, Giovanni; Caliro, Stefano; Avino, R.; Bini, Giulio; Giudicepietro, Flora; De Cesare, Walter;
Ricciolino, Patrizia; Aiuppa, A.; Cardellini, Carlo; Petrillo, Zaccaria; Selva, Jacopo; Siniscalchi, Agata;
Tripaldi, Simona Publication Date:
2021-06
Permanent Link:
https://doi.org/10.3929/ethz-b-000478380
Originally published in:
Journal of Volcanology and Geothermal Research 414, http://doi.org/10.1016/
j.jvolgeores.2021.107245
Rights / License:
Creative Commons Attribution-NonCommercial-NoDerivatives 4.0 International
This page was generated automatically upon download from the ETH Zurich Research Collection. For more information please consult the Terms of use.
ETH Library
Invited Research Article
Hydrothermal pressure-temperature control on CO
2emissions and seismicity at Campi Flegrei (Italy)
G. Chiodini
a,⁎ , S. Caliro
b, R. Avino
b, G. Bini
c, F. Giudicepietro
b, W. De Cesare
b, P. Ricciolino
b, A. Aiuppa
d, C. Cardellini
e,a, Z. Petrillo
b, J. Selva
a, A. Siniscalchi
f, S. Tripaldi
faIstituto Nazionale di Geofisica e Vulcanologia, Sezione di Bologna, via D. Creti 12, 40128 Bologna, Italy
bIstituto Nazionale di Geofisica e Vulcanologia, Sezione di Napoli Osservatorio Vesuviano, via Diocleziano 328, 80124 Napoli, Italy
cInstitute of Geochemistry and Petrology, ETH Zürich, Clausiusstrasse 25, 8092 Zürich, Switzerland
dDipartimento di Scienze della Terra e del Mare (DiSTeM), Università degli Studi di Palermo, via Archirafi22, 90123 Palermo, Italy
eDipartimento di Fisica e Geologia, Università degli Studi di Perugia, via Pascoli snc, 06123 Perugia, Italy.
fDipartimento di Scienze della Terra e Geoambientali, Università degli Studi di Bari, Aldo Moro, via Edoardo Orabona, 4, 70125 Bari, Italy
a b s t r a c t a r t i c l e i n f o
Article history:
Received 16 December 2020
Received in revised form 19 March 2021 Accepted 27 March 2021
Available online 30 March 2021 Keywords:
Volcanic unrest Hydrothermal systems Campi Flegrei Fumarole compositions CO2emission Volcano seismicity
Fluids supplied by stored magma at depth are causal factors of volcanic unrest, as they can cause pressurization/
heating of hydrothermal systems. However, evidence for links between hydrothermal pressurization, CO2emis- sion and volcano seismicity have remained elusive. Here, we use recent (2010−2020) observations at Campi Flegrei caldera (CFc) to show hydrothermal pressure, gas emission and seismicity at CFc share common source areas and well-matching temporal evolutions. We interpret the recent escalation in seismicity and surface gas emissions as caused by pressure-temperature increase at the top of a vertically elongated (0.3–2 km deep) gas front. Using mass (steam) balance considerations, we show hydrothermal pressurization is causing energy trans- fer from thefluids to the host rocks, ultimately triggering low magnitude earthquakes within a seismogenetic volume containing the hydrothermal system. This mechanism is probably common to other worldwide calderas in similar hydrothermal activity state.
© 2021 Published by Elsevier B.V.
1. Introduction
The injection, ascent, storage and surface release of deepfluids in the upper crust are widespread phenomena in nature, and are recurrent drivers of geological catastrophes. Fluid pressure increase in the upper crust can trigger seismicity reducing the effective normal stress on fault planes (e.g., Hubbert and Rubey, 1959; Sibson, 1992;Miller, 2013), and the recurrently observed co-seismic variations in gasflux and composition (Fischer et al., 2017;Girault et al., 2018;Chiodini et al., 2020) are clear hints for a cause-effect link betweenfluids and earthquakes. It is also well-established that artificialfluid injection in the subsurface, and the consequentfluid pressure increase, can lead to seismicity (Ellsworth, 2013;Keranen and Weingarten, 2018).
Volcanoes make no exception, the most notable example being that of Mammoth Mt. (California), when the sudden surface burst (in 1990) of huge amounts of volcanic-hydrothermal CO2 associated to a seismic crisis killed a large portion of the forest (Farrar et al., 1995;
Sorey et al., 1998), and repeated increases in diffuse CO2emissions
accompanied seismic swarms in the subsequent years (Lewicki et al., 2014;Werner et al., 2014;Hotovec-Ellis et al., 2018;Pfeiffer et al., 2018).
Volcanoes are especially suitable natural laboratories for investigat- ingfluidflow - pressure - earthquake associations, because robust and relatively continuous geochemical and geophysical datasets are avail- able. One aspect that is especially relevant to restless volcanoes is that injectedfluids are generally hot and H2O-rich so that, upon ascent, can interact with, and condense into, hydrothermal aquifers: the heating and consequent volumetric expansion of the hosting rocks that result from condensation of such magmatic steam is a potential additional seismicity driver during volcanic unrest (Chiodini et al., 2015).
The relations among hydrothermal temperature-pressure,fluidflow and earthquakes are here investigated at Campi Flegrei (CFc,Fig. 1a), a restless resurgent caldera formed ~39 kyrs ago by the largest caldera- forming eruption in Europe in the last 200 kyrs (Costa et al., 2012).
CFc exhibits (since the 1950s) repeated inflation periods (Orsi et al., 1999;Del Gaudio et al., 2010) and seismic crises, which have worried the scientific community as much to suggest an eruption is approaching (Selva et al., 2012;Kilburn et al., 2017). The CFc is undergoing since 2004 a new inflation phase (total maximum vertical displacement of
~0.75 m by the time of writing), associated with frequent shallow seis- micity, part of which interpreted as originating fromfluid transfer Journal of Volcanology and Geothermal Research 414 (2021) 107245
⁎ Corresponding author.
E-mail address:giovanni.chiodini@ingv.it(G. Chiodini).
https://doi.org/10.1016/j.jvolgeores.2021.107245 0377-0273/© 2021 Published by Elsevier B.V.
Contents lists available atScienceDirect
Journal of Volcanology and Geothermal Research
j o u r n a l h o m e p a g e :w w w . e l s e v i e r . c o m / l o c a t e / j v o l g e o r e s
processes (Bianco et al., 2004;Saccorotti et al., 2007;D'Auria et al., 2011;Chiodini et al., 2017a;Giudicepietro et al., 2020). At the same time, large compositional variations are being observed in the fumarolic effluents (Caliro et al., 2014;Chiodini et al., 2016), and markedflux in- creases are being registered in hydrothermal CO2release from both fu- marolic vents (Tamburello et al., 2019) and soil diffuse degassing structures (Cardellini et al., 2017). The escalating CO2emissions, and the concomitant compositional changes in the fumaroles, have been interpreted as signs that magma degassing at depth may have reached a critical condition in which heating and pressurization of the shallower CFc hydrothermal system is occurring at accelerating rate (Caliro et al., 2014;Chiodini et al., 2015, 2016). In 2012, the evolution of the moni- tored geophysical and geochemical parameters induced the Italian Civil Protection (DPC) to raise the CFc alert level from green (calm) to yellow (attention).
Here, we characterise the recent pressure-temperature (P-T from here on) evolution in the CFc hydrothermal system, as inferred from geochemical modelling of fumarolic compositions, and to explore its
temporal link with the rates of deeply derived CO2emissions and seis- micity. To this aim, our multidisciplinary analysis combines results for the chemical compositions of the CFc fumaroles with a set of variables related to the gas emission, and the earthquakes. We exclude from our analysis the deformation signals, as their main source area is thought to be deeper than the hydrothermal system this work is focussed on (3–4 km;Amoruso et al., 2014a, 2014b).
Geochemical data (fumarolic compositions and CO2fluxes) refer to the hydrothermal sites of Solfatara and Pisciarelli (Fig. 1). Solfatara, a tuff cone formed about 4 ka ago (Smith et al., 2011), is the most active degassing zone of the CFc, being site of numerous fumarolic vents and of a widespread soil diffuse degassing of hydrothermal-volcanic CO2
(Chiodini et al., 2001;Cardellini et al., 2017;Fig. 1b). The most recent CO2flux measurements performed over the entire zone identify a ~ 1 km2wide area diffusively emitting deeply derived CO2(the so called Solfatara Diffuse Degassing Structure, Solfatara DDS,Chiodini et al., 2001; Fig. 1b). The typical CO2 flux sustained by the DDS was 1000–2000 t d−1in 2014–2016 period (Cardellini et al., 2017). Signifi- cant amounts of CO2are also emitted by fumarolic vents, the most active of which are located in the eastern slope of the Solfatara cone (Pisciarelli vents, CO2emission up to 600 t d−1in 2019 (Tamburello et al., 2019) and inside the Solfatara depression (BG and BN vents, CO2emission up to ~300 t d−1in 2013;Aiuppa et al., 2013;Pedone et al., 2014;
Fig. 1b).
After a description of the evolution over time of different parameters we attempt an integrated analysis aimed at understanding the impact of hydrothermalfluid P-T changes on earthquakes occurrence andfluid emissions.
2. Databases
The databases used in this work (Supplementary Data File S1) are here briefly described.
2.1. Chemical compositions of Solfatara fumaroles
The main and hottest fumaroles of Solfatara, BG (T= 150–165 °C) and BN (T 140–150 °C) (Fig. 1b), have been systematically sampled since 1983 and 1995, respectively. The dataset includes the temperature and chemical compositions (H2O, CO2, H2S, Ar, N2, H2, CH4and CO) of gas samples taken and analysed with similar procedures, from 1983 to 2020 (seeCaliro et al., 2007;Cioni and Corazza, 1981for the sampling and analytical methods). This Solfatara fumarolicfluid database is unique for the large number of samples (671), for its continuity (~ 35 years of observations) and for the homogeneity of the sampling and an- alytical methods used. Different laboratories contributed to this data- base: the laboratories of CNR of Pisa that started the work at the beginning of 1980's; the laboratory of University of Perugia that analysed the gas samples in the middle 1990's; and thefluid geochem- istry laboratory of Osservatorio Vesuviano from 1998 to 2020.
2.2. Diffuse CO2flux from the Solfatara crater target area
During April 2004–October 2020, 149 soil CO2flux campaigns have been performed inside the Solfatara crater. In total, the dataset consists of 9315 measurements performed with the accumulation chamber method (Chiodini et al., 1998) over a grid of 63 points whose location remained unchanged during the period (Fig. 1b). The data are reported in monthly surveillance reports of Osservatorio Vesuviano for the Civil Defence of Italy (http://www.ov.ingv.it/ov/it/bollettini/275.html). The results of the first 50 campaigns have already been published (Granieri et al., 2009), while the remaining are here reported for the first time. For each campaign, we computed the total CO2 output (FCO2 in t d−1) from the target area (Fig. 1b). The FCO2 and its uncer- tainty were computed by applying a geostatistical method based on se- quential Gaussian simulation (sGs;Cardellini et al., 2003) to the soil CO2 Fig. 1.Location map. a) Campi Flegrei caldera and location of the 2004–2020 earthquakes.
The A'-A" line refers to the vertical section reported inFig. 6. b) Map of the Solfatara diffuse degassing structure (DDS) showing the locations of the target area, the monitored 63 points and the main fumaroles. The map, based on 13,158 CO2flux measurements from 1998 to 2016 (Cardellini et al., 2017), illustrates the probability that the simulated CO2
flux is greater than 50 g m−2d−1, selected as the threshold for a pure biogenic CO2flux.
Coordinates are expressed in UTM-WGS84.
fluxes of the 149 campaigns. Specifically, we used thesgsimalgorithm (GSLIB software library;Deutsch and Journel, 1998). The CO2flux has been simulated on a of 4 m x 4 m grid starting from variogram models fitting the experimental variograms of the normal scores of the CO2
flux (for further details seeCardellini et al., 2003). For each campaign, 200 simulations were realised and the total CO2release was computed by summing the products of the simulated CO2flux value at each grid cell by the cell surface. The mean total CO2flux and its standard devia- tion, computed from the 200 realizations, are taken as FCO2 and its un- certainty for each campaign. As an example, Supplementary Fig. 1 illustrates the CO2flux map obtained considering at each location the mean of the CO2fluxes measured in the 149 campaigns. The target area to which each FCO2 estimate refers to (coloured area in Supple- mentary Fig. S1) was limited to the area within the outermost measur- ing points, in order to avoid uncertainties related to extrapolations to un-sampled zones.
2.3. Diffuse CO2flux from the Solfatara DDS
This dataset includes the total CO2output by diffuse degassing at Sol- fatara (FCO2-DDS) from 1998 to 2016 estimated from soil CO2flux mea- surements covering an area of 1.4 km2which includes Solfatara crater and Pisciarelli areas (Fig. 1b;Cardellini et al., 2017). The soil CO2fluxes were measured in 30 surveys using the accumulation chamber method (Chiodini et al., 1998) and the total CO2output was estimated applying a geostatistical method based on sGs (for further details seeCardellini et al., 2017).
2.4. CO2fluxes from Pisciarelli vents
This dataset is composed of twenty-one measurements of the CO2
flux from the Pisciarelli vents performed by different authors during 2012–2019 (Aiuppa et al., 2013;Pedone et al., 2014;Aiuppa et al., 2015;Queißer et al., 2017;Tamburello et al., 2019). Measurement methods are different and include: tunable diode laser absorption spec- troscopy (Pedone et al., 2014), differential absorption lidar (Aiuppa et al., 2015), laser remote-sensing spectrometry (LARSS;Queißer et al., 2017), multi-component gas analyzer system (MultiGAS;Aiuppa et al., 2013;Tamburello et al., 2019). The reader is referred to the original ar- ticles for the details on these different techniques.Tamburello et al.
(2019)report an overall consistency of the CO2fluxes obtained with the different measurement methods.
2.5. Fumarolic tremor at Pisciarelli
The fumarolic tremor is a continuous seismic signal recorded in the vicinity of the Pisciarelli fumaroles, currently the largest of the CFc. To record this signal, a seismic station was installed in 2010 about 8 m away from the main fumarolic vent. The fumarolic tremor, analysed in previous studies (Chiodini et al., 2017b;Giudicepietro et al., 2019, 2020), is polarized in the vertical direction and characterized by a spec- tral peak at around 10 hz. To represent the temporal evolution of the tremor amplitude, the Real-time Seismic-Amplitude Measurement (RSAM;Endo and Murray, 1991) was calculated on 30-min windows of the vertical component signal,filtered in 5–15 Hz frequency band.
2.6. Air CO2concentrations at Pisciarelli
Since April 2007, an automatic station measures soil temperature, soil CO2fluxes, and CO2concentrations in air, at 40 cm height, 20 m downwind of the main Pisciarelli vent (Chiodini et al., 2017b). The April 2007–October 2020 daily air CO2concentrations are systemati- cally higher than in ambient air (1000–5000 ppm vs ~ 400 ppm) due to persistent fumigation from the fumarolic plume.
2.7. Earthquakes
We used the CFc earthquake locations available in the public-access INGV- Osservatorio Vesuviano database (http://sismolab.ov.ingv.it/
sismo/index.php?PAGE=SISMO/last&area=Flegrei). Hypocentre loca- tions were obtained using a 1D layered velocity model. The dataset con- sists of 2026 located earthquakes with magnitude (Md) ranging between−1.1 and 3.3, representing about 47% of the total number of CFc earthquakes recorded by the INGV-Osservatorio Vesuviano perma- nent seismic network between January 2004 and October 2020. Seis- micity is mostly concentrated in the Solfatara-Pisciarelli area (Fig. 1a) at relatively shallow depth and the magnitude of the events is generally low with only 16 events with 2.0≤Md≤3.3. From 2005 to 2012, earth- quakes occurred mainly in swarms. Since 2012–2013, their occurrence rate has increased over time, both as swarms and as single events, with single events becoming more frequent in the last 2 years.
3. Results and discussion
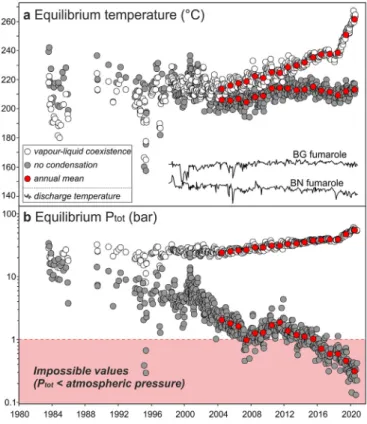
3.1. Pressure-temperature geoindicators based on fumarole compositions Solfatara fumaroles emit vapours characterized by the absence of acidic gas species (i.e., SO2, HCl, HF) that are typical of high-tempera- ture magmatic gas emissions. They also exhibit detectable amounts of species formed in the hydrothermal environment (e.g., CH4). These com- positions suggest fumarolic steam originates from a hydrothermal sys- tem in which the original magmatic acidic components have already been removed by scrubbing processes (Cioni et al., 1984;Caliro et al., 2007). Since 1984, the Solfatara compositional database was used to derive the T-P conditions of this hydrothermal system (e.g.,Cioni et al., 1984;Chiodini et al., 1996, 2015, 2016;Caliro et al., 2007). Recently, two different geochemical approaches have lead to contrasting results and different implications for the current CFc unrest, which has been interpreted as either driven by pressurization of the CFc system (Chiodini et al., 2015, 2017a), or associated with a general depressuriza- tion of the hydrothermal system (Moretti et al., 2017) (Fig. 2). We refer to the two approaches, which stand on different model assumptions, as theno-condensation(Moretti et al., 2017) andvapour-liquid coexistence (Chiodini et al., 2015) models.
3.1.1. The no-condensation model
Moretti et al. (2017) applied a model originally developed by Chiodini et al. (1996)and then refined byChiodini and Marini (1998).
The geobarometric and geothermometric relations are derived consid- ering the formation reactions of H2, CO and CH4from the main species H2O and CO2:
H2O↔H2þ1=2 O2 ð1Þ
CO2↔COþ1=2 O2 ð2Þ
CO2þ2 H2O↔CH4þ2 O2 ð3Þ
whose equilibrium constants are expressible as:
log KH2¼ log fH2þ1=2log fO2−log fH2O ð4Þ log KCO¼log fCOþ1=2log fO2−log fCO2 ð5Þ log KCH4¼log fCH4þ2 log fO2−log fCO2–2 log fH2O ð6Þ where log KH2=−12,707/T + 2.548, log KCO=−14,955/T + 5.033 and log KCH4=−42,007/T + 0.527 (thermodynamic data fromStull et al., 1969; T in Kelvin). Suitable combinations of eqs. 4, 5 and 6 allow to eliminate the log fO2 variable and to derive the following geothermometric and geobarometric functions:
G. Chiodini, S. Caliro, R. Avino et al. Journal of Volcanology and Geothermal Research 414 (2021) 107245
3
T¼−2248=ðlog Xð CO=XCO2Þ þlog Xð H2O=XH2Þ−2:485Þ ð7Þ log PH2O¼ 19:605−log XCO4
=XCH4XCO23
−17813=T
=2 ð8Þ
where the equimolar ratios of the measured fumarolic molar frac- tions (Xi) are assumed equal to the fugacities ratios and PH2O~ fH2O.
Finally considering the Dalton law,
PCO2¼PH2OXCO2=XH2O ð9Þ
PtotPCO2þPH2O ð10Þ
Relevant assumptions of this approach are: (i) the redox conditions are internallyfixed within the H2O-CO2-H2-CO- CH4gas system, an as- sumption that implies that CH4equilibrates at the same T-P conditions as the kinetically faster species H2and CO (Giggenbach, 1987); (ii) no secondary processes affect H2O (condensation and/or water addition).
Because the contrasting results with the model of Chiodini et al.
(2015)strongly depends on this last assumption, we name the model used byMoretti et al. (2017)as theno-condensationmodel.
3.1.2. The vapour-liquid coexistence model
Caliro et al. (2007), showed in a log H2/H2O vs log CO/CO2stability diagram (Fig. 5inCaliro et al., 2007) that Solfatara fumaroles plot close to a typical hydrothermal redox buffer (DP; D'Amore and Panichi, 1980) at temperature of 200–250 °C and far from the H2S-SO2
redox buffer of volcanic gases (Giggenbach, 1987). The same authors, considering the carbon isotopic exchange reaction between CO2and CH4, demonstrated that the CH4/CO2 ratio reflects temperatures (360–430 °C) much higher than those returned by the H2/H2O and CO/CO2ratios, a fact that in principle excludes the possibility of using CH4, CO and H2in a unique geothermometric function. Furthermore, starting from early 2000's, macroscopic evidences suggested the
occurrence of secondary processes (i.e., steam condensation) affecting the fumarolic H2O content: (i) the almost continuous increase in the non-condensable gas fraction relative to water (Chiodini et al., 2015);
(ii) a systematic increase of the CO/CO2ratio (an indicator of hydrother- mal temperature, and condensation is very efficient to heat a hydrother- mal system); (iii) the pervasive circulation of condensates underneath Solfatara crater, and in particular close to the main fumaroles BG and BN (Bruno et al., 2007;Byrdina et al., 2014;Gresse et al., 2017); (iv) the formation of strong boiling pool of condensates and repeated epi- sodes of liquid/mud emission at Pisciarelli (Chiodini et al., 2015).
In order to avoid the effects of these secondary processes affecting H2O, and in order to exclude CH4 from the model,Chiodini et al.
(2015)derived T-P functions from eqs. 4 and 5 based on equimolar ra- tios between non-condensable gases (H2, CO, CO2). The derivation of the geothermometric and geobarometric function was possible consid- ering (i) fH2Ofixed by the vapour-liquid coexistence and (ii) fO2as a function of the temperature. Redox conditions of Solfatara gases were assumed to be controlled by the DP buffer (log fO2= 8.20–23,643/T).
According toChiodini and Marini (1998), an alternative fO2-T function applicable to Solfatara fumarolic gases is the‘Campanian Volcanoes’ buffer (CV, log fO2= 7.75–23,169/T). The correspondent geotherm- ometric relations are:
T¼3133:5=ð0:933−log XCO=XCO2Þ ð11Þ
valid for redox conditions controlled by the DP relation, and T¼3370:5=ð1:158−log XCO=XCO2Þ ð12Þ
when considering the CV redox buffer.
The geobarometric functions are:
log PH2O¼5:510–2048=T ð13Þ
where the water pressure is assumed equal to water fugacity of sat- urated vapour (i.e., vapour-liquid coexistence for pure water (Giggenbach, 1980)),
log PCO2¼3:025þ201=T−Log XH2=XCO ð14Þ
derived by a linear combination of eqs. 4 and 5, and.
PtotPCO2þPH2O ð15Þ
Use of either the DP or the CV fO2-T relation results into different P-T estimations. In agreement withChiodini et al. (2015), we use the DP op- tion (eq. 11) that, for the post 2010 period considered in this work, out- puts T values from 218 °C to 267 °C and P from 27 to 60 bar; while the alternative eq. 12 (CV buffer) returns higher T andPvalues (238 °C - 287 °C, 37 bar - 78 bar). We stress, however, that these systematic dif- ferences do not affect the results and considerations of our work that is based on the relative variation of the normalized T-P values that are practically the same for both the DP and CV estimations.
We will refer to this model as thevapour-liquid coexistencemodel.
3.1.3. Temperature-pressure estimations
The T-P estimates, derived by the two models for the entire Solfatara fumaroles' database, are contrasted in the chronograms ofFig. 2.
Even though, any model can not be considered completely reliable because it is necessarily based on some a-priori assumptions, theno- condensation modelis certainly not reliable because the total estimated pressures (Ptot = PH2O+ PCO2) for the post-2015 samples are impossi- ble as systematically below atmospheric pressure (<1 bar,Fig. 2b).
The reliability of thevapour-liquid coexistencemodel is tested below by comparing the inferred P-T conditions with different independent fluidflow related variables, and with the earthquake occurrence at CFc.
Fig. 2.T-P estimates. a) Equilibrium temperatures and b) pressures estimated with two alternative geochemical models (see the text) from the 1983–2020 compositions of BG and BN fumaroles. The discharge temperatures of the fumaroles are reported in panel a.
3.2. Fluidflow related (FFR) variables
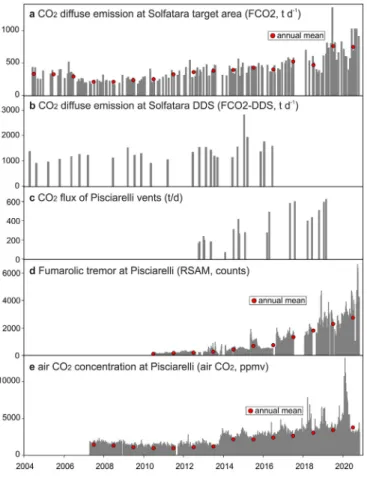
Figs. 3a, b,c, d and e are chronograms of the available FFR vari- ables that we take as proxies for the CO2degassing regime of the Solfatara-Pisciarelli area. In particular the CO2flux (FCO2,Fig. 3a) from the Solfatara target area (seeFig. 1b) and the total CO2flux from the entire Solfatara DDS (FCO2-DDS,Fig. 3b;Cardellini et al., 2017) are representative of the diffuse emission. Numerous FCO2 data (149) are available for the entire observation period (2004–2020) while
FCO2-DDS measurements are less frequent (Cardellini et al., 2017) and not available since 2017.
The CO2flux from Pisciarelli vents (Fig. 3c;Tamburello et al., 2019), the fumarolic tremor at Pisciarelli (RSAM,Fig. 3d) and the CO2concen- trations in air at Pisciarelli (air CO2,Fig. 3e) are taken as proxies of the vent emission in the area. Although not directflux measurements, RSAM and air CO2are almost continuously acquired, and their temporal fluctuations have previously been shown to scale with the intensity of hydrothermal activity at Pisciarelli (Fig. 4;Chiodini et al., 2017b;
Giudicepietro et al., 2019, 2020).
3.3. 2004–2020 earthquakes occurrence at CFc
We refer here to the earthquakes occurred at CFc from 2004 to October 2020 (Fig. 1a) whose locations and magnitudes are available in public databases of the Osservatorio Vesuviano (http://www.ov.
ingv.it/ov/it/banche-dati.html). It is worth to note that the events concentrate underneath the Solfatara-Pisciarelli (Fig. 1a) and are in general of low magnitude (maximum magnitude = 3.3) and of rela- tively shallow depths (Fig. 5a). The earthquakes' occurrence rate manifestly increases since 2017–2018 (Fig. 5b). Note thatFig. 5b Fig. 3.Chronograms of the FFR variables. Annual means are reported with red symbols.
(For interpretation of the references to colour in thisfigure legend, the reader is referred to the web version of this article.)
Fig. 4.Air CO2and RSAM vs CO2flux of Pisciarelli vents. RSAM and air CO2are reported as the mean values measured at the time of the CO2flux campaign ±30 days.
Fig. 5.CFc earthquakes from 2004 to October 2020. a) Chronogram of depths and magnitudes. b) Monthly (gray histogram) and annual (red symbols) number of earthquakes with Magnitude >0.1; the 2020 annual number of earthquakes has been scaled over the entire year. (For interpretation of the references to colour in thisfigure legend, the reader is referred to the web version of this article.)
G. Chiodini, S. Caliro, R. Avino et al. Journal of Volcanology and Geothermal Research 414 (2021) 107245
5
reports events with magnitude≥0.1, for which the catalogue is rea- sonably complete in the observation period. The absence of deep events at CFc (i.e., depth > 3–4 km) likely reflects the high tempera- tures expected at depth, and a very shallow brittle-ductile transition (3–5 km;Castaldo et al., 2019).
3.4. Comparison of the different datasets
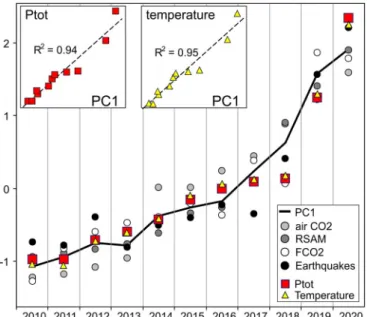
A multivariate time-series analysis is attempted to compare the dif- ferent observations. To this aim, we compute the annual mean (annual number for the earthquakes) of each variable (red points inFigs. 2, 3 and 5), focussing on the 2010–2020 period, for which most of the vari- ables are available. The approach based on the analysis of the annual values has the advantage offiltering out any seasonally controlled vari- ations. The multivariate analysis is not applied to the FCO2-DDS (Fig. 3b) and to the CO2flux from Pisciarelli vents(Fig. 3c) because these measurements are sporadic and not available for the entire pe- riod. In detail, a Principal Component Analysis (PCA; Everitt and Hothorn, 2011;James et al., 2013) was performed on the annual means of the other FFR variables (air CO2, FCO2, RSAM) and the annual number of earthquakes to simplify and summarize the relationships among the multivariate set of data. We used the functionprcompof the packagestatsof the R software (RCore Team, 2021), which performs PCA via a singular value decomposition of the centered and scaled data matrix. This technique derives a new set of uncorrelated variables (Prin- cipal Components, PC) using a linear combination of the original vari- ables, and ranks them in terms of their overall control on the variance.
PCA is therefore used to reduce the dimensionality of the data set, by choosing only those PC that explain most of the variance in the data.
In practice, the PCA applied to the 4-variables matrix returns 4 PC, which retain different proportions of the total variance: PC1 the 94.0%, PC2 the 3.6%, PC3 the 1.8%, and PC4 the 0.6% (Table 1). The scores of these new variables are calculated multiplying the matrix of the scaled original variables by the eigenvector matrix inTable 1(namely, the ei- genvectors of the correlation matrix of the original data set). These re- sults indicate that nearly the total (temporal) variability of the data (~94%) is explained by PC1 only, which is defined by an almost identical contribution of air CO2, RSAM, FCO2, and Earthquakes variables (see the coefficients of thefirst eigenvector inTable 1).
This suggests that a single driving mechanism controls the varia- tions of hydrothermalfluidflux and earthquakes (Fig. 6), and as such summarizes well the temporal evolution of the hydrothermal part of the CFc unrest. It is worth to note that PC1 is very well correlated with the Ptot and temperature, estimated using thevapour-liquid co- existencemodel (Fig. 6). We checked the reliability of this result by applying PCA to a larger number of observations, i.e., considering six months means of FFR variables and six months number of earth- quakes, obtaining again a PC1 that explains a large portion of the var- iance (87%) and well correlating with Ptot and temperature. These results indicate that the correlation structure in the data is very
strong and PCA, in the studied case, is stable also with a small num- ber of observations.
Summarising, PCA results support our hypothesis that increasing fluid pressure and temperature in the hydrothermal system, due to an increasing input of magmatic gases, is a causal factor in triggering the CFc seismicity, and is the driver for the observed escalation in hydro- thermalfluid release at the surface.
In contrast, theno-condensationmodel outputs unrealistic results, as post-2015 estimated pressures are unacceptably low (< atmospheric pressure, 1 bar) and decrease over the same temporal interval during which earthquake occurrence rate and surface hydrothermal fluid fluxes are both visibly increasing. This mismatch indicates that the as- sumption that fumarolic water concentrations are currently fully repre- sentative of the deep, equilibrium compositions (Moretti et al., 2017) is inconsistent with the observations.
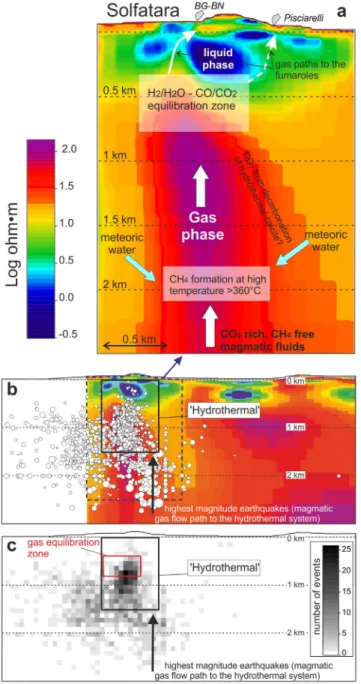
3.5. The conceptual model of the hydrothermal system and‘hydrothermal’ seismicity
The conceptual model based on thevapour-liquid coexistenceas- sumption is sketched inFig. 7a over a 2-D resistivity model of Solfatara, derived by AMT (AudioMagnetoTelluric) measurements (Siniscalchi et al., 2019). The section is dominated by a ~ 2 km long vertically elon- gated resistivity structure in axis with Solfatara. This is the core of the hydrothermal system feeding the Solfatara-Pisciarelli hydrothermal sites. It is interpreted as a permeable zone that favours gas ascent from the hottest and deepest portions of the system. Hot, methane- free magmaticfluids enter the base (>2 km depth) of the system, mix with and vaporize meteoric liquids, and ultimately create the condition for CH4formation at temperatures >360 °C (Caliro et al., 2007). From that zone, a gas plume rises up to 0.3–0.7 km where the resistive struc- ture is interrupted by conductive layers (green, cyan and blue colours) that reflect both hydrothermal altered zones and a liquid phase- dominated environment (Siniscalchi et al., 2019). It is worth noting that, assuming a hydrostatic control onfluid pressure, the inferred equilibration pressures of thevapour-liquid coexistencemodel (from 30 to 80 bar, considering both the DP and CV redox buffers, see section Table 1
Principal Component Analysis (PCA). Results of the PCA applied to the variables FCO2, RSAM, air CO2and earthquakes.
Variables Eigenvectors
PC1 PC2 PC3 PC4
FCO2 0.4993 0.3342 −0.7991 0.0215
RSAM 0.5100 −0.0659 0.2692 −0.8143
air CO2 0.4914 −0.7896 −0.0134 0.3672
earthquakes 0.4992 0.5103 0.5373 0.4491
Importance of components PC1 PC2 PC3 PC4
Variance 3.7591 0.1430 0.0736 0.0243
Proportion of variance 0.9398 0.0357 0.0184 0.0061
Cumulative proportion 0.9398 0.9755 0.9939 1.0000
Fig. 6.Chronograms of the z-scores of the FFR variables (air CO2, RSAM, FCO2), earthquakes occurrence, PC1, and the Ptot-temperature estimations based on the vapour-liquid coexistence model(all the variables are reported as annual means; the z- score is equal to the variable minus the mean divided for the standard deviation). The FFR variables and the Earthquakes occurrence were analysed with a PCA and PC1 is the resulting main component explaining their 94% total variance. PC1 is plotted against Ptot and temperature in the insets.
3.1.2) correspond to gas equilibration depths of 0.3–0.8 km, that coin- cide with the top of the resistive structure (Fig. 7). Here, at the interface with the overlying clay-altered zones, the gas phase is expected to accumulate and to reside for a sufficient time to allow the gas phase to re-equilibrate at the local T-P conditions. From that zone, the gas moves toward the surface trough fractures, shallow gas pockets and liq- uid bodies whose existence and complex geometry has been highlighted by detailed geo-electric surveys (Byrdina et al., 2014;
Gresse et al., 2017, 2018).
According to (Chiodini et al., 2016), an escalating magmaticfluid in- flow at the base of the hydrothermal system causes its heating and pres- surization, and in turn the increase of the CO2emission at the surface
and seismicity (Fig. 6). A dense earthquake cluster is observed at 0.5–1 km depth (Fig. 7b and c), and since this interval nicely corre- sponds to the gas equilibration depths inferred above (0.3–0.8 m) is here interpreted as the head of the gas front feeding the hydrothermal system. Thus, our inferred Ptot increase refers to such topmost portion of this seismogenetic vertical gas plume. It is also noteworthy the exis- tence of a second, deeper (>2 km) seismicity cluster that corresponds to the source area irradiating the highest magnitude earthquakes (Fig. 7b):
this structure has been interpreted as the root of the gas plume, in which larger events are likely caused by pulsed magmaticfluid injec- tions (e.g.,Giudicepietro et al., 2020).
Ultimately, the close spatial correspondence between the main seismogenetic volume (0.5–1 km) and the gas equilibration zone (0.3–0.8 km) supports the idea that, similarly to the seismicity induced by anthropogenicfluid injection, the generalised pressurization and heating of the CFc gas dominated-hydrothermal system act as the main seismicity trigger (Fig. 7b and c).
3.6. A mass balance of the steam associated with the CO2emission and hy- drothermal seismicity
The observed escalation in surface gas release at Solfatara and Pisciarelli is an additional evident sign for increased gas transport at depth, and of a generalised gas pressure build-up at source.
Using the numerous data of the CO2emission from the target area (FCO2,Fig. 3a) we compute that the total CO2emissions from Solfatara DDS increased from ~1000 t d−1in 2008–2010 up to 3000–4000 t d−1 in 2019–2020 (Fig. 8). Considering that similar increments also affected the fumarolic vents (Tamburello et al., 2019) we can roughly estimate the current total CO2emission from Solfatara-Pisciarelli at ~5000 t d−1. Thisflux ranks CFc among thefirst 8 top volcanic CO2emitters on Earth (Fischer et al., 2019;Werner et al., 2019). Such an unusually large gas supply implies pressure-build up in the gas source area (the hy- drothermal system), and suggests an increased potential for phreatic ex- plosions. Volatile supply must inherently be associated with a large thermal energy release (as steam and CO2are associated prior to con- densation). We stress that since gas pressurization is an exothermic pro- cess, it may itself be causing heating. In addition, the pressurization of a steam-rich gas phase can induce its condensation, a process that at CFc hydrothermal system is described by thevapour-liquid coexistencegeo- chemical model. Condensation can be shallow (forming the hot soils and mud pools that characterise the fumarolicfields) or relatively
Fig. 7.Conceptual model and seismicity. a) Geochemical conceptual model of the hydrothermal system feeding the Solfatara-Pisciarelli manifestations sketched over a resistivity section (redrawn fromSiniscalchi et al., 2019). b) section (A'-A" inFig. 1A) showing the relations between earthquake location (distance <0.6 km from the section) and resistivity. The dimension of the white circles is proportional to the magnitude of the events. c) 2 D density map of earthquakes in the A'-A" section (computed as the number of events projected on cells of 100 × 100 m2). The‘hydrothermal’box is a section of a parallelepiped of 1.2 × 1.2 × 1.5 km assumed to contain the hydrothermal system (see the text andFig. 9).
Fig. 8.CO2emission from diffuse degassing at Solfatara DDS during 2004–2020 The black dots refer to the emission from the target area (Fig. 1andFig. 3a) scaled over the entire DDS. This was possible by elaborating the data of the 30 campaigns reported in (Cardellini et al., 2017). From these data we computed the mean ratio between the DDS emission and that from the target area (4.7 ± 1.1), that is used as correction factor (error bars refer to the standard deviation of the correction factor).
G. Chiodini, S. Caliro, R. Avino et al. Journal of Volcanology and Geothermal Research 414 (2021) 107245
7
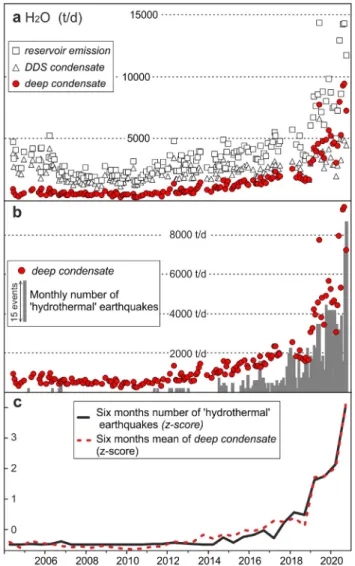
deep. We attempt at establishing a steam mass balance for the hydro- thermal systems by dividing it into 3 components (Fig. 9a):
- the original steam emission at reservoir conditions (reservoir emis- sioninFig. 9a); this is derived by multiplying the diffuse CO2flux (FCO2-DDS) by the H2O/CO2ratio in the gas equilibration zone (de- rived from PH2Oand PCO2estimates);
- the fraction of steam condensing in the sub-surface of the DDS (DDS condensateinFig. 9a); this computed by multiplying FCO2-DDS by the fumarolic H2O/CO2;
- the fraction of steam that condense at depth (deep condensatein Fig. 9a, b and c); given by the differencereservoir emission-DDS condensate.
It is worth to note that the inferred temporal evolution of thedeep condensatemass matches nicely that of‘hydrothermal’seismicity (Fig. 9b and c), i.e., of the events occurred in the volume containing the hydrothermal system (seeFig. 7b and c). In our interpretation, thedeep condensaterepresents the fraction of the original steam/
thermal energy budget that can potentially trigger earthquakes be- cause the condensed liquid can lubricate pre-existing fractures and because hydrothermal host rocks get hotter, increase in volume by
thermal dilatation, andfinally fracture as they reach a failure thresh- old. The total thermal energy involved indeep condensationfrom 2004 to 2020 is ~4 × 10¹⁴J (computed from the latent heat of con- densation), and is thus well enough to justify the observed seismic- ity (being 5 orders of magnitude higher than the cumulative energy of all the CFc earthquakes, ~ 1.5 × 109J,http://www.ov.ingv.it/ov/
bollettini-mensili-campania/Bollettino_Mensile_Campi_Flegrei_
2020_10.pdf).
4. Conclusions
We use a novel multidisciplinary approach to characterise the spatial-temporal evolution of the hydrothermal unrest currently af- fecting CFc. Use of such a multidisciplinary methodology at CFc is fa- cilitated by the especially robust and continuous records available for both geochemical parameters (including fumarolic composi- tions, soil CO2fluxes andfluidflow related variables), and seismicity.
Although these multiple dataset may not all simultaneously be avail- able at many of the degassing restless calderas worldwide, we yet conclude our approach is general, and mayfind application provided at least fumarolic gas compositions, soilflux emissions and seismic catalogues are available.
In the CFc example, a multivariate analysis shows that the different datasets share a common evolution during 2010–2020, and are fully de- scribed by a single component that explains 94% of their total variance.
This component, whose values exhibit a sharp increase from 2018 on- ward, is well correlated with escalating pressure and temperature of the hydrothermal system inferred from geochemical modelling of fu- marole composition. The P-T increase occurs in a gas-dominated zone, located at depths of <1 km below the main hydrothermal sites, which corresponds to the main cluster of low magnitude, post 2004 earth- quakes. This temporal and spatial association between hydrothermal P-T and seismicity brings compelling evidence for the role played by pressurising hydrothermalfluids in driving volcano seismicity at CFc.
Our results bring evidence for the seismogenetic role played by mag- matic gas injection into hydrothermal systems, and are thus of general relevance for other volcanoes in similar contexts.
Authors contribution
G.C. originally conceived the study and wrote the manuscript with the help of A.A., C.C., G.B., J.S., Z.P., F.G.;
F.G. and W.D.C. analysed RSAM;
R.A., S.C. and G.C. sampled and analysed the fumaroles and interpreted the compositions;
R.A. and C.C. measured gas diffuse emissions;
P.R. analysed the earthquakes;
G.B. and J.S. performed PCA;
A.S., S.T. and Z.P. measured and interpreted the AMT data;
All the authors contributed to the discussion.
Funding
This work was supported by MIUR, project n. PRIN2017- 2017LMNLAW“Connect4Carbon”. Most of the used data were acquired in the frame of the Campi Flegrei volcanic surveillance funded by the Italian Dipartimento della Protezione Civile, Presidenza del Consiglio dei Ministri (DPC). This paper does not necessarily represent DPC offi- cial opinion and policies.
Declaration of Competing Interest
The authors declare that they have no known competingfinancial interests or personal relationships that could have appeared to influ- ence the work reported in this paper.
Fig. 9.Deep condensation rate and hydrothermal earthquakes occurrence. a) results of the steam mass balance involved in the degassing process (see the text). b) Deep condensate rate vs the monthly number of ‘hydrothermal’ earthquakes (gray histogram).
c) Normalized‘hydrothermal’earthquakes occurrence and normalized mean of deep condensate rate (six month values). SeeFig. 7for the definition of‘hydrothermal’
earthquakes.
Acknowledgments
We would like to remember the researchers Roberto Cioni and Egizio Corazza who recently passed away: they began to sample and an- alyze Solfatara fumaroles in early 1980's, starting the Solfatara fuma- roles database. We thank Bruce Christenson and an anonymous reviewer for their insightful comments. This work is part of the INGV re- search project LOVE-CF (Linking surface Observables to sub-Volcanic plumbing-system: a multidisciplinary approach for Eruption forecasting at Campi Flegrei caldera (Italy)).
Appendix A. Supplementary data
Supplementary data to this article can be found online athttps://doi.
org/10.1016/j.jvolgeores.2021.107245.
References
Aiuppa, A., Tamburello, G., Di Napoli, R., Cardellini, C., Chiodini, G., Giudice, G., Grassa, F., Pedone, M., 2013. First observations of the fumarolic gas output from a restless cal- dera: Implications for the current period of unrest (2005-2013) at Campi Flegrei.
Geochem. Geophys. Geosyst. 14 (10), 4153–4169. https://doi.org/10.1002/
ggge.20261.
Aiuppa, A., Fiorani, L., Santoro, S., Parracino, S., Nuvoli, M., Chiodini, G., Minopoli, C., Tamburello, G., 2015. New ground-based lidar enables volcanic CO2flux measure- ments. Sci. Rep. 5.https://doi.org/10.1038/srep13614.
Amoruso, A., Crescentini, L., Sabbetta, I., 2014a. Paired deformation sources of the Campi Flegrei caldera (Italy) required by recent (1980–2010) deformation history.
J. Geophys. Res. 119 (2), 858–879.https://doi.org/10.1002/2013JB010392.
Amoruso, A., Crescentini, L., Sabbetta, I., De Martino, P., Obrizzo, F., Tammaro, U., 2014b.
Clues to the cause of the 2011–2013 Campi Flegrei caldera unrest, Italy, from con- tinuous GPS data. Geophys. Res. Lett. 41, 3081–3088.https://doi.org/10.1002/
2014GL059539.
Bianco, F., Del Pezzo, E., Saccorotti, G., Ventura, G., 2004. The role of hydrothermalfluids in triggering the July–August 2000 seismic swarm at Campi Flegrei, Italy: evidence from seismological and mesostructural data. J. Volcanol. Geotherm. Res. 133 (1), 229–246.
https://doi.org/10.1016/S0377-0273(03)00400-1.
Bruno, P.P.G., Ricciardi, G.P., Petrillo, Z., Di Fiore, V., Troiano, A., Chiodini, G., 2007. Geo- physical and hydrogeological experiments from a shallow hydrothermal system at Solfatara Volcano, Campi Flegrei, Italy: Response to caldera unrest. J. Geophys. Res.
112 (B6).https://doi.org/10.1029/2006JB004383.
Byrdina, S., Vandemeulebrouck, J., Cardellini, C., Legaz, A., Camerlynck, C., Chiodini, G., Lebourg, T., Gresse, M., Bascou, P., Motos, G., Carrier, A., Caliro, S., 2014. Relations be- tween electrical resistivity, carbon dioxideflux, and self-potential in the shallow hy- drothermal system of Solfatara (Phlegrean Fields, Italy). J. Volcanol. Geotherm. Res.
283, 172–182.https://doi.org/10.1016/j.jvolgeores.2014.07.010.
Caliro, S., Chiodini, G., Moretti, R., Avino, R., Granieri, D., Russo, M., Fiebig, J., 2007. The or- igin of the fumaroles of La Solfatara (Campi Flegrei, South Italy). Geochim.
Cosmochim. Acta 71 (12), 3040–3055.https://doi.org/10.1016/j.gca.2007.04.007.
Caliro, S., Chiodini, G., Paonita, A., 2014. Geochemical evidences of magma dynamics at Campi Flegrei (Italy). Geochim. Cosmochim. Acta 132, 1–15. https://doi.org/
10.1016/j.gca.2014.01.021.
Cardellini, C., Chiodini, G., Frondini, F., 2003. Application of stochastic simulation to CO2
flux from soil: Mapping and quantification of gas release. J. Geophys. Res. 108 (B9).
https://doi.org/10.1029/2002JB002165.
Cardellini, C., Chiodini, G., Frondini, F., Avino, R., Bagnato, E., Caliro, S., Lelli, M., Rosiello, A., 2017. Monitoring diffuse volcanic degassing during volcanic unrests: the case of Campi Flegrei (Italy). Sci. Rep. 7 (1).https://doi.org/10.1038/s41598-017-06941-2.
Castaldo, R., D'Auria, L., Pepe, S., Solaro, G., De Novellis, V., Tizzani, P., 2019. The impact of crustal rheology on natural seismicity: Campi Flegrei caldera case study. Geosci.
Front. 10 (2), 453–466.https://doi.org/10.1016/j.gsf.2018.02.003.
Chiodini, G., Marini, L., 1998. Hydrothermal gas equilibria: the H2O-H2-CO2-CO-CH4sys- tem. Geochim. Cosmochim. Acta 62 (15), 2673–2687.https://doi.org/10.1016/
S0016-7037(98)00181-1.
Chiodini, G., Cioni, R., Magro, G., Marini, L., Panichi, C., Raco, B., Russo, M., 1996.
Chemical and isotopic variations ofBocca Grande fumarole (Solfatara Volcano, PhlegreanFields). Acta Vulcanol. 8, 129–138.
Chiodini, G., Cioni, R., Guidi, M., Raco, B., Marini, L., 1998. Soil CO2flux measurements in volcanic and geothermal areas. Appl. Geochem. 13 (5), 543–552.https://doi.org/
10.1016/S0883-2927(97)00076-0.
Chiodini, G., Frondini, F., Cardellini, C., Granieri, D., Marini, L., Ventura, G., 2001. CO2
degassing and energy release at Solfatara volcano, Campi Flegrei. Italy. J. Geophys.
Res. 106 (B8), 16213–16221.https://doi.org/10.1029/2001JB000246.
Chiodini, G., Vandemeulebrouck, J., Caliro, S., D'Auria, L., De Martino, P., Mangiacapra, A., Petrillo, Z., 2015. Evidence of thermal-driven processes triggering the 2005-2014 un- rest at campiflegrei caldera. Earth Planet. Sci. Lett. 414, 58–67.https://doi.org/
10.1016/j.epsl.2015.01.012.
Chiodini, G., Paonita, A., Aiuppa, A., Costa, A., Caliro, S., De Martino, P., Acocella, V., Vandemeulebrouck, J., 2016. Magmas near the critical degassing pressure drive volca- nic unrest towards a critical state. Nat. Commun. 7.https://doi.org/10.1038/
ncomms13712.
Chiodini, G., Selva, J., Del Pezzo, E., Marsan, D., De Siena, L., D'Auria, L., Bianco, F., Caliro, S., De Martino, P., Ricciolino, P., Petrillo, Z., 2017a. Clues on the origin of post-2000 earth- quakes at Campi Flegrei caldera (Italy). Sci. Rep. 7 (1).https://doi.org/10.1038/
s41598-017-04845-9.
Chiodini, G., Giudicepietro, F., Vandemeulebrouck, J., Aiuppa, A., Caliro, S., De Cesare, W., Tamburello, G., Avino, R., Orazi, M., D'Auria, L., 2017b. Fumarolic tremor and geo- chemical signals during a volcanic unrest. Geology 45 (12), 1131–1134.https://doi.
org/10.1130/G39447.1.
Chiodini, G., Cardellini, C., Di Luccio, F., Selva, J., Frondini, F., Caliro, S., Rosiello, A., Beddini, G., Ventura, G., 2020. Correlation between tectonic CO2Earth degassing and seismic- ity is revealed by a 10-year record in the Apennines, Italy. Sci. Adv. 6 (35).https://doi.
org/10.1126/sciadv.abc2938eabc2938.
Cioni, R., Corazza, E., 1981. Medium-temperature fumarolic gas sampling. Bull. Volcanol.
44 (1), 23–29.https://doi.org/10.1007/BF02598186.
Cioni, R., Corazza, E., Marini, L., 1984. The gas/steam ratio as indicator of heat transfer at the Solfatara fumaroles, Phlegraean Fields (Italy). Bull. Volcanol. 47, 295–302.
https://doi.org/10.1007/BF01961560.
Costa, A., Folch, A., Macedonio, G., Giaccio, B., Isaia, R., Smith, V.C., 2012. Quantifying vol- canic ash dispersal and impact of the Campanian Ignimbrite super-eruption.
Geophys. Res. Lett. 39 (10).https://doi.org/10.1029/2012GL051605.
D'Amore, F., Panichi, C., 1980. Evaluation of deep temperatures of hydrothermal systems by a new gas geothermometer. Geochim. Cosmochim. Acta 44 (3), 549–556.https://
doi.org/10.1016/0016-7037(80)90051-4.
D'Auria, L., Giudicepietro, F., Aquino, I., Borriello, G., Del Gaudio, C., Lo Bascio, D., Martini, M., Ricciardi, G.P., Ricciolino, P., Ricco, C., 2011. Repeatedfluid-transfer episodes as a mechanism for the recent dynamics of Campi Flegrei caldera (1989–2010).
J. Geophys. Res. 116 (B4).https://doi.org/10.1029/2010JB007837.
Del Gaudio, C., Aquino, I., Ricciardi, G.P., Ricco, C., Scandone, R., 2010. Unrest episodes at Campi Flegrei: a reconstruction of vertical ground movements during 1905–2009.
J. Volcanol. Geotherm. Res. 195 (1), 48–56.https://doi.org/10.1016/j.jvolgeores.
2010.05.014.
Deutsch, C.V., Journel, A.G., 1998.GSLIB: Geostatistical Software Library and Users Guide.
Oxford Univerity Press, Oxford, New York 369 pp.
Ellsworth, W.L., 2013. Injection-Induced Earthquakes. Science 341 (6142), 1225942.
https://doi.org/10.1126/science.1225942.
Endo, E.T., Murray, T., 1991. Real-time Seismic Amplitude Measurement (RSAM): a vol- cano monitoring and prediction tool. Bull. Volcanol. 53 (7), 533–545.https://doi.
org/10.1007/BF00298154.
Everitt, B., Hothorn, T., 2011.An Introduction to Applied Multivariate Analysis with R.
Springer, New York 274 pp.
Farrar, C.D., Sorey, M.L., Evans, W.C., Howle, J.F., Kerr, B.D., Kennedy, B.M., King, C.Y., Southon, J.R., 1995. Forest-killing diffuse CO2emission at Mammoth Mountain as a sign of magmatic unrest. Nature 376 (6542), 675–678.https://doi.org/10.1038/
376675a0.
Fischer, T., Matyska, C., Heinicke, J., 2017. Earthquake-enhanced permeability–evidence from carbon dioxide release following the ML 3.5 earthquake in West Bohemia. Earth Planet. Sci. Lett. 460, 60–67.https://doi.org/10.1016/j.epsl.2016.12.001.
Fischer, T.P., Arellano, S., Carn, S., Aiuppa, A., Galle, B., Allard, P., Lopez, T., Shinohara, H., Kelly, P., Werner, C., Cardellini, C., Chiodini, G., 2019. The emissions of CO2and other volatiles from the world’s subaerial volcanoes. Sci. Rep. 9 (1), 18716.https://
doi.org/10.1038/s41598-019-54682-1.
Giggenbach, W.F., 1980. Geothermal gas equilibria. Geochim. Cosmochim. Acta 44, 2021–2032.https://doi.org/10.1016/0016-7037(80)90200-8.
Giggenbach, W.F., 1987. Redox processes governing the chemistry of fumarolic gas dis- charges from White Island, New Zealand. Appl. Geochem. 2 (2), 143–161.https://
doi.org/10.1016/0883-2927(87)90030-8.
Girault, F., Adhikari, L.B., France-Lanord, C., Agrinier, P., Koirala, B.P., Bhattarai, M., Mahat, S.S., Groppo, C., Rolfo, F., Bollinger, L., Perrier, F., 2018. Persistent CO2 emissions and hydrothermal unrest following the 2015 earthquake in Nepal. Nat. Commun. 9 (1), 2956.https://doi.org/10.1038/s41467-018-05138-z.
Giudicepietro, F., Chiodini, G., Caliro, S., De Cesare, W., Esposito, A.M., Galluzzo, D., Lo Bascio, D., Macedonio, G., Orazi, M., Ricciolino, P., Vandemeulebrouck, J., 2019. Insight into Campi Flegrei caldera unrest through seismic tremor measurements at pisciarelli fumarolicfield. Geochem. Geophys. Geosyst. 20 (11), 5544–5555.https://doi.org/
10.1029/2019GC008610.
Giudicepietro, F., Chiodini, G., Avino, R., Brandi, G., Caliro, S., De Cesare, W., Galluzzo, D., Esposito, A., La Rocca, A., Lo Bascio, D., Obrizzo, F., Pinto, S., Ricci, T., Ricciolino, P., Siniscalchi, A., Tramelli, A., Vandemeulebrouck, J., Macedonio, G., 2020. Tracking epi- sodes of seismicity and gas transport in Campi Flegrei caldera trough seismic, geo- physical and geochemical measurements. Seismol. Res. Lett., 1–11https://doi.org/
10.1785/0220200223in press.
Granieri, D., Avino, R., Chiodini, G., 2009. Carbon dioxide diffuse emission from the soil:
ten years of observations at Vesuvio and Campi Flegrei (Pozzuoli), and linkages with volcanic activity. Bull. Volcanol. 72 (1), 103.https://doi.org/10.1007/s00445- 009-0304-8.
Gresse, M., Vandemeulebrouck, J., Byrdina, S., Chiodini, G., Revil, A., Johnson, T.C., Ricci, T., Vilardo, G., Mangiacapra, A., Lebourg, T., Grangeon, J., Bascou, P., Metral, L., 2017.
Three-Dimensional Electrical Resistivity Tomography of the Solfatara Crater (Italy):
Implication for the Multiphase Flow Structure of the Shallow Hydrothermal System.
J. Geophys. Res. 122 (11), 8749–8768.https://doi.org/10.1002/2017JB014389.
Gresse, M., Vandemeulebrouck, J., Byrdina, S., Chiodini, G., Roux, P., Rinaldi, A.P., Wathelet, M., Ricci, T., Letort, J., Petrillo, Z., Tuccimei, P., Lucchetti, C., Sciarra, A., 2018. Anatomy of a fumarolic system inferred from a multiphysics approach. Sci. Rep. 8 (1), 7580.
https://doi.org/10.1038/s41598-018-25448-y.
G. Chiodini, S. Caliro, R. Avino et al. Journal of Volcanology and Geothermal Research 414 (2021) 107245
9
Hotovec-Ellis, A.J., Shelly, D.R., Hill, D.P., Pitt, A.M., Dawson, P.B., Chouet, B.A., 2018. Deep fluid pathways beneath Mammoth Mountain, California, illuminated by migrating earthquake swarms. Sci. Adv. 4 (8).https://doi.org/10.1126/sciadv.aat5258eaat5258.
Hubbert, M., Rubey, W., 1959.Role offluid pressure in mechanics of overthrust faulting.
Geol. Soc. Am. 70, 115–166.
James, G., Witten, D., Hastie, T., Tibshirani, R., 2013.An Introduction to Statistical Learning.
Springer, New York 426 pp.
Keranen, K.M., Weingarten, M., 2018. Induced Seismicity. Annu. Rev. Earth Planet. Sci. 46 (1), 149–174.https://doi.org/10.1146/annurev-earth-082517-010054.
Kilburn, C.R.J., De Natale, G., Carlino, S., 2017. Progressive approach to eruption at Campi Flegrei caldera in southern Italy. Nat. Commun. 8 (1), 15312.https://doi.org/10.1038/
ncomms15312.
Lewicki, J.L., Hilley, G.E., Shelly, D.R., King, J.C., McGeehin, J.P., Mangan, M., Evans, W.C., 2014. Crustal migration of CO2-rich magmaticfluids recorded by tree-ring radiocar- bon and seismicity at Mammoth Mountain, CA, USA. Earth Planet. Sci. Lett. 390, 52–58.https://doi.org/10.1016/j.epsl.2013.12.035.
Miller, S.A., 2013. The role offluids in tectonic and earthquake processes. In: Dmowska, R.
(Ed.), Advanc. Geophys. Advances in Geophysics, pp. 1–46https://doi.org/10.1016/
b978-0-12-380940-7.00001-9.
Moretti, R., De Natale, G., Troise, C., 2017. A geochemical and geophysical reappraisal to the significance of the recent unrest at Campi Flegrei caldera (Southern Italy).
Geochem. Geophys. Geosyst. 18 (3), 1244–1269.https://doi.org/10.1002/2016G C006569.
Orsi, G., Civetta, L., Del Gaudio, C., de Vita, S., Di Vito, M.A., Isaia, R., Petrazzuoli, S.M., Ricciardi, G.P., Ricco, C., 1999. Short-term ground deformations and seismicity in the resurgent Campi Flegrei caldera (Italy): an example of active block-resurgence in a densely populated area. J. Volcanol. Geotherm. Res. 91 (2), 415–451.https://
doi.org/10.1016/S0377-0273(99)00050-5.
Pedone, M., Aiuppa, A., Giudice, G., Grassa, F., Cardellini, C., Chiodini, G., Valenza, M., 2014.
Volcanic CO2flux measurement at Campi Flegrei by tunable diode laser absorption spectroscopy. Bull. Volcanol. 76 (4).https://doi.org/10.1007/s00445-014-0812-z.
Pfeiffer, L., Wanner, C., Lewicki, J.L., 2018. Unraveling the dynamics of magmatic CO2 degassing at Mammoth Mountain,California. Earth Planet. Sci. Lett. 484, 318–328.
https://doi.org/10.1016/j.epsl.2017.12.038.
Queißer, M., Granieri, D., Burton, M., Arzilli, F., Avino, R., Carandente, A., 2017. Increasing CO2flux at Pisciarelli, Campi Flegrei, Italy. Solid Earth 8 (5), 1017–1024.https://doi.
org/10.5194/se-8-1017-2017.
R Core Team, 2021.R: A Language and Environment for Statistical Computing. R Founda- tion for Statistical Computing, Vienna, Austria.
Saccorotti, G., Petrosino, S., Bianco, F., Castellano, M., Galluzzo, D., La Rocca, M., Del Pezzo, E., Zaccarelli, L., Cusano, P., 2007. Seismicity associated with the 2004–2006 renewed
ground uplift at Campi Flegrei Caldera. Italy. Phys. Earth Planet. Inter. 165 (1), 14–24.
https://doi.org/10.1016/j.pepi.2007.07.006.
Selva, J., Marzocchi, W., Papale, P., Sandri, L., 2012. Operational eruption forecasting at high-risk volcanoes: the case of Campi Flegrei. Naples. J. App. Volcanol. 1 (1), 5.
https://doi.org/10.1186/2191-5040-1-5.
Sibson, R.H., 1992. Implications of fault-valve behaviour for rupture nucleation and recurrence. Tectonophysics 211, 283–293.https://doi.org/10.1016/0040-1951(92) 90065-E.
Siniscalchi, A., Tripaldi, S., Romano, G., Chiodini, G., Improta, L., Petrillo, Z., D'Auria, L., Caliro, S., Avino, R., 2019. Reservoir Structure and Hydraulic Properties of the Campi Flegrei Geothermal System Inferred by Audiomagnetotelluric, Geochemical, and Seis- micity Study. J. Geophys. Res. 124 (6), 5336–5356. https://doi.org/10.1029/
2018JB016514.
Smith, V.C., Isaia, R., Pearce, N.J.G., 2011. Tephrostratigraphy and glass compositions of post-15 kyr Campi Flegrei eruptions: implications for eruption history and chrono- stratigraphic markers. Quat. Sci. Rev. 30 (25), 3638–3660.https://doi.org/10.1016/j.
quascirev.2011.07.012.
Sorey, M.L., Evans, W.C., Kennedy, B.M., Farrar, C.D., Hainsworth, L.J., Hausback, B., 1998.
Carbon dioxide and helium emissions from a reservoir of magmatic gas beneath Mammoth Mountain, California. J. Geophys. Res. 103 (7), 15303–15323.https://doi.
org/10.1029/98JB01389.
Stull, D.R., Westrum, E.F., Sinke, G.G., 1969.The Chemical Thermodynamics of Organic Compounds. Wiley, New York 865 pp.
Tamburello, G., Caliro, S., Chiodini, G., De Martino, P., Avino, R., Minopoli, C., Carandente, A., Rouwet, D., Aiuppa, A., Costa, A., Bitetto, M., Giudice, G., Francofonte, V., Ricci, T., Sciarra, A., Bagnato, E., Capecchiacci, F., 2019. Escalating CO2 degassing at the Pisciarelli fumarolic system, and implications for the ongoing Campi Flegrei unrest.
J. Volcanol. Geotherm. Res. 384, 151–157.https://doi.org/10.1016/j.jvolgeores.
2019.07.005.
Werner, C., Bergfeld, D., Farrar, C.D., Doukas, M.P., Kelly, P.J., Kern, C., 2014. Decadal-scale variability of diffuse CO2 emissions and seismicity revealed from long-term monitor- ing (1995–2013) at Mammoth Mountain, California, USA. J. Volcanol. Geotherm. Res.
289, 51–63.https://doi.org/10.1016/j.jvolgeores.2014.10.020.
Werner, C., Fischer, T.P., Aiuppa, A., Edmonds, M., Cardellini, C., Carn, S., Chiodini, G., Cottrell, E., Burton, M., Shinohara, H., Allard, P., 2019. Carbon dioxide emissions from subaerial volcanic regions: two decades in review. In: Orcutt, B.N., Daniel, I., Dasgupta, R. (Eds.), Deep Carbon: Past to Present. Cambridge University Press, Cam- bridge, pp. 188–236https://doi.org/10.1017/9781108677950.