1
Milankovitch frequencies in tephra records at volcanic
2
arcs: The relation of kyr-scale cyclic variations in
3
volcanism to global climate changes
4 S. Kutterolf1, J.C. Schindlbeck2, M. Jegen1, A. Freundt1, S.M. Straub3 5
6 1GEOMAR Helmholtz Centre for Ocean Research Kiel, 24148 Kiel, Germany 7 2University of Heidelberg Institute of Earth Sciences, 69120 Heidelberg, Germany 8 3Lamont Doherty Earth Observatory Columbia University, Palisades, USA
9
10 Abstract
11 The increase in volcanic activity after the last glacial maximum observed on Iceland 12 has led to one of the most fascinating hypothesis in science in the last decades: that 13 deglaciation may force volcanism. Consequently, tephrostratigraphic records of 14 sufficient length that cover multiple glacial cycles have been used to test whether 15 such relationships hold systematically through the Quaternary. Here we review such 16 tephra records that have been linked with climate proxy records such as δ18O in 17 marine sediments, which is a measure of sea-level change and which is thought to 18 be orbitally forced, as it exhibits the characteristic Milankovitch periodicities of 19 precession (~23 kyr), obliquity (~41 kyr) and eccentricity (~100 kyr).
20 Statistical analyses have identified these periodicities also in long tephra records 21 from different latitudes and geotectonic settings, as well as in compiled semi-global 22 records. These studies detect Milankovitch periods in their tephra record, and also a 23 phase shift relative to the δ18O record in such that periods of increased eruption 24 frequencies coincide with the deglaciation period at the glacial/interglacial transition 25 when ice and water loads on the lithosphere change most rapidly. However, there
26 are also disparities in results and interpretations, which may be attributable to the 27 different methods of analysis applied the studies.
28 We have therefore re-analyzed the four best-characterized tephra records by the 29 same methods. We distinguish between analysis in the frequency domain, a novel 30 approach, and analysis in the time domain, which has been used in previous studies.
31 Analysis in the frequency domain identifies harmonic frequencies that arise from the 32 binary nature of the tephra records and complicate the identification of primary 33 frequencies. However, we show that all four records show spectral density peaks 34 near the main Milankovitch periodicities of 41 and 100 kyr, and that they produce 35 meaningful and significant statistical correlations with each other and the global δ18O 36 record but not with random time series. Although the time-domain correlations with 37 δ18O roughly confirm phase shifts implying peak volcanism during deglaciation, 38 correlation coefficients arising from very noisy records are generally too low for 39 precise constraints on the relative timing.
40 These deficiencies presently hamper the recognition of the physical mechanisms 41 through which global climate changes affect volcanism at both, high-latitude glaciated 42 regions and low-latitude non-glaciated regions.
43
44 Keywords: Quaternary, eruption frequencies, cyclicities, climate, tephra time 45 series, Milankovitch, statistics
46
47 Introduction
48 It is well known that large explosive and effusive eruptions can have a global impact 49 on the climate through the injection of gas, aerosols and ash into the atmosphere 50 which can reduce average global surface temperature over a period of years 51 (McCormick et al., 1995; Robock, 2000; Miller et al., 2012). Some of these volcanic
52 impacts led to widespread droughts, crop losses, and famine causing dramatic 53 casualties (e.g., Oppenheimer, 2003; Lavigne et al., 2013, Manning et al. 2017). The 54 most prominent historic examples are the 1783-1784 Laki eruption on Iceland (e.g., 55 Highwood and Stevenson, 2003), the 1815 Tambora eruption in Indonesia (e.g., 56 Rampino et al., 1993; Rampino and Self, 1982) and the 1991 Mt. Pinatubo eruption 57 on the Philippines (e.g., Robock, 2000). Modern global measurement networks (for 58 example, see www.ncdc.noaa.gov) nowadays demonstrate the climatic effects of 59 volcanic eruptions, but for events in the distant past these relationships need to be 60 revealed by correlating volcanic and paleoclimate records. For example, tree rings of 61 the last 600 years record excursions in the average northern hemisphere surface 62 temperatures that can be related to large volcanic eruptions during this period (Briffa 63 et al. 2004) (Fig.1). Sigl et al. (2015) correlated Arctic and Antarctic ice core data and 64 lower latitude climate proxy records (such as tree cores) and identified global climate 65 forcings by volcanic events over the past 2500 years. On time scales of tens of 66 million years, geologic records reveal mass extinctions caused by the severe climate 67 disruption associated with formation of large igneous provinces and flood basalts 68 (Hofmann et al., 1997; McLean, 1985; Campbell et al., 1992; Courtillot and Renne, 69 2003; Bond and Wignall, 2014).
70 However, there is also another way to assess the relationships between paleoclimate 71 and volcanic records. Over past decades it has been recognized that variations in 72 global climate and in volcanic activity share some common periodicities, also known 73 as the Milankovitch periods, which led to the theory that global climate changes may 74 be a driver of volcanic activity (Paterne et al., 1990; Rampino et al., 1979). Cyclic 75 behavior of volcanoes and volcanic provinces can occur on a wide range of 76 timescales, from seconds over hours and days up to millions of years (e.g., Table 1, 77 Carey and Sigurdsson, 2000; Sigurdsson et al. 2000, Kutterolf et al. 2013; Sumita
78 and Schmincke, 2013; Scharff et al., 2015; Bredemeyer and Hansteen, 2014;
79 Schindlbeck et al., 2015, 2018; Tolstoy, 2015; Mahony et al., 2016). The reasons for 80 such temporal variations in volcanic activity can be internal drivers in volcano-magma 81 systems (e.g., mantle melting rates, magma storage and replenishment conditions, or 82 degassing processes) or external influences such as regional earthquakes, seasonal 83 climate variations, Earth tides, regional sea-level changes or ocean tides, or regional 84 tectonic rearrangements (e.g., Table 1; Schmincke, 2004; Johnston and Mauk, 1972;
85 Dzurizin, 1980; McNutt and Beavan, 1987; Patanè et al., 1994; Mason et al., 2004;
86 Sottili et al., 2007; Kasahara and Sato, 2001 Bredemeyer and Hansteen, 2014;
87 Tolstoy, 2015; Mahony et al., 2016). Sealevel change has in particular been invoked 88 as an external control on volcanism. For example, Steward (2018) links the sudden 89 change from fissure-type to central-type volcanism at Mt. Etna to a dramatic sealevel 90 rise. Sternai et al. (2017) propose that the dramatic sealevel drop of the Messinian 91 salinity crisis increased the productivity of the pan-Mediterranean volcanic provinces.
92 Jupp et al. (2004) developed a theoretical model to predict possible distributions of 93 response times of volcanism depending on magnitude and frequency of a periodic 94 stimulation.
95 Studies in Iceland (Sigvaldason et al., 1992; MacLennan et al., 2002) and other 96 glacier-covered regions (e.g., Praetorius et al., 2016; Rawson et al., 2016) showed a 97 significant increase in volcanic activity after the last glaciation, suggesting that 98 lithospheric unloading during glacier retreat may drive volcanism. Theoretical 99 modeling by Jull and McKenzie (1996) confirms that glacier unloading can 100 significantly increase mantle melting at Iceland. Nowell et al. (2006) observed 101 increased volcanic activity in young intraplate volcanic fields in France and Germany 102 during post-glacial warming periods and related this to distal effects of flexural (un- 103 )loading of the lithosphere in response to ice shield retreat.
104 A globally applicable proxy of global climate variations is the foraminiferal δ18O 105 record, which provides a measure of global ice volume and sea level change (Lisiecki 106 and Raymo, 2005). The δ18O record, as well as some other paleoclimate proxy 107 records, contains cyclic variations on periods that reflect orbital forcing of the climate 108 (Milankovitch cycles), of which the most prominent are precession (23 kyr) and 109 obliquity (41 kyr) of Earth’s rotation axis, and the eccentricity (100 kyr) of Earth’s 110 rotation around the sun; minor periodicities occur at 17-19 kyr and 400 kyr. The fact 111 that the major periodicities have also been recognized in various volcanic records in 112 geodynamic settings (Fig. 2) gave rise to the hypothesis that climate change drives 113 volcanism (e.g. McGuire et al. 1997, Jellinek et al. 2004, Huybers and Langmuir, 114 2009; Kutterolf et al. 2013, Schindlbeck et al. 2018). In this review we address the 115 results as well as commonalities and disparities between the various studies of 116 climate-volcanism relationships in order to provide a better basis for deducing the 117 physical mechanisms of that relationship, which remain poorly understood and for 118 which different processes have been suggested. Understanding such mechanisms is 119 relevant to the present-day because anthropogenically enforced deglaciation may 120 lead to increased volcanic activity and hazards (Tuffen, 2010; Pagli and 121 Sigmundsson, 2008; Albino et al., 2010).
122
123 Volcanic time series
124 The geologic investigation of volcanic systems on land is the most common way to 125 reconstruct time series of volcanic activity, typically involving a large number of 126 radiometric datings (e.g., Glazner et al., 1999; Nowell et al., 2006). Coverage by 127 younger deposits, erosion, or other reasons may render parts of the volcanic history 128 inaccessible. Kiyosugi et al. (2015) found an exponential trend of under-recording of 129 explosive eruptions with age in Quaternary Japanese tephra records, with stronger
130 under-recording of smaller eruptions. However, the mostly non-erosive conditions in 131 lakes or on the ocean floor facilitate the recovery of medial to distal tephra records 132 that approximate a continuous history of regional (e.g., Paterne et al., 1990), and 133 even global-scale volcanism (Kutterolf et al., 2013) (Table 1). It can be assumed that 134 the temporal variation in the frequency of explosive eruptions that produce 135 widespread tephra beds is an image of the temporal variation of the entire volcanism 136 because it has been shown that eruption magnitude and frequency are systematically 137 linked to each other (e.g. Pyle, 1995; Deligne et al., 2010). An advantage of 138 sedimentary tephra profiles is that there are often independent (mostly 139 micropaleontological) methods to establish high-resolution age models, a prequisit to 140 further study the time series statistical. Most of the studies that investigate volcanic 141 time series for Milankovitch frequencies build indeed on tephra successions, and in 142 this review we will further focus on results from marine tephra sequences.
143 However, it should be noted that correlations with climate signals have also been 144 observed in other volcanic records. For example, variations in crustal thicknesses in 145 seafloor bathymetry suggest a sensitivity of mid-ocean ridge systems to sea level 146 changes on Milankovitch time scales (e.g., Table 1; Tolstoy, 2015; Lund et al., 2011;
147 Crowley et al., 2015). Moreover, the peak of hydrothermal activity on the Mid-Atlantic 148 Ridge (Middleton et al., 2016), Juan de Fuca Ridge (Costa et al., 2017) and at the 149 East Pacific Rise (Lund et al., 2016) 15 kyr after the glacial maximum has been 150 interpreted as the delayed melt formation following the hydrostatic pressure 151 minimum.
152 The tephra time series can be distinguished into two categories: tephra successions 153 that cover single volcanic systems, or volcanic provinces (e.g., Paterne et al., 1990;
154 Schindlbeck et al., 2018), and compiled tephra records that include data from many 155 sites in order to approximate a semi-global tephra record (e.g., Huybers and
156 Langmuir, 2009; Kutterolf et al., 2013) (Table 1). Both types of data sets can 157 represent different age ranges. We will first summarize studies that investigate tephra 158 records since the last glaciation; these records are best accessible and provide the 159 best available time resolution. In a subsequent chapter we then discuss tephra 160 record spanning several glacial cycles as only these can provide a conclusive test of 161 the proposed climate-volcanism relationships.
162
163 Tephra studies covering the last glacial cycle
164 Especially in glaciated regions (e.g. Chile, Iceland, Alaska) several studies found an 165 increase in volcanic activity during the last deglaciation (e.g., Table 1; Praetorius et 166 al., 2016; Rawson et al., 2016; Sigvaldason et al., 1992; MacLennan et al., 2002). In 167 a combined tephra and lava study on Iceland, Sigvaldason et al. (1992) inferred that 168 ice unloading increased post-glacial magma production rates and eruptability of 169 Icelandic magmas following the last deglaciation. They note that a major problem is 170 the sampling and volume determination of layers that are buried under younger 171 deposits as well as the limitation of their data to the last deglaciation.
172 Figure 3a shows the temporal evolution of ice volume equivalent sea-level variation 173 across the last glaciation after Lambeck et al. (2014). Sea-level rise during 174 deglaciation is not steady but shows a significant pulse (meltwater pulse 1a, orange 175 box in Fig. 3a) during the Bølling-Allerød period. Interestingly, this pulse is almost 176 immediately followed by the period of postglacial rebound in Iceland (gray bar in Fig.
177 3a; MacLennan et al., 2002). The phase of increased postglacial volcanism in Iceland 178 largely overlaps with the postglacial rebound and the meltwater pulse (Fig. 3b).
179 Similarly, on the other side of the planet, the high-resolution postglacial volcanic 180 activity of Mocho-Choshuenco volcano at the glaciated southern Chilean arc 181 (Rawson et al.,2016) peaks during the same 13-8 ka period (Fig 3b). Rawson et al.
182 (2016) attributed this to changes in magma storage times that are caused by 183 deglaciation-related changes in the crustal stress field. They suggest that magma is 184 stored during the glaciation and erupts in a first explosive phase immediately after 185 the ice unloading. Praetorius et al. (2016) observed an abrupt increase in the 186 volcanic activity at the Mt. Edgecumbe Volcanic Field in Southeast Alaska between 187 14.6 and 13.1 ka, which coincides with the period of largest crustal uplift in response 188 to glacial ablation (Fig. 3c). Note that there is a time shift of about 2000 years in peak 189 rebound and peak volcanism between Alaska and Iceland.
190 A global increase of volcanic activity during the last deglaciation is also discussed. In 191 a 40 kyr compilation of subaerial eruptions from different latitudes Huybers and 192 Langmuir (2009) noticed an increase of volcanic activity during the last deglaciation 193 (12-7 ka) and into the Holocene that largely coincides with the period of high sea- 194 level stand (Fig. 3d). However, Watt et al. (2013) revised the work of Huybers and 195 Langmuir by distinguishing between glaciated and non-glaciated arc regions. They 196 conclude that the apparent increase in global volcanism during the last deglaciation 197 is mainly due to an increase in volcanism in glaciated regions.
198 Huybers and Langmuir (2009) and Praetorius et al. (2016) speculated that increased 199 volcanism may create a positive feedback on deglaciation by adding CO2 to the 200 atmosphere and by reduction of the albedo by ash mantling the ice sheets.
201
202 Tephra studies on longer time scales
203 The longest tephra records, covering up to 35 Myr, have been documented by 204 Kennett and Thunell (1975), and Kennett et al. (1977) who use the time distribution of 205 volcanic ash in 320 Tertiary to Recent deep-drilled sequences obtained by the Deep 206 Sea Drilling Project (DSDP) in combination with terrestrial data (Fig. 4). These data 207 were complemented by Cadet et al. (1982a,b) offshore Central America and by
208 Carey and Sigurdsson (2000) and Sigurdsson et al. (2000) for the Caribbean region 209 (Fig.4; Table 1). These studies identified several widely occurring cycles in volcanic 210 activity that each lasted several million years and which can be attributed to plate 211 tectonic processes. However, these tephra records did not have the temporal 212 resolution necessary to identify cyclic variations in the 10’s of kyr range. Prueher and 213 Rea (2001) obtained a higher resolution tephra record (450 ash beds in 5 Myr) from 214 the northern Pacific and detected episodes of increased explosive volcanism at 215 approximately 0.2–0.5, 0.7–0.9, 1.5–1.7, and 2.5–2.65 Ma in the Kamchatka arc, and 216 at 0.15–0.4, 1.7–1.8, 2.55–2.65, and at 3.0–3.1 Ma in the eastern Aleutian arc. These 217 periods correspond to those found throughout the Pacific (e.g., Cambray et al., 1995) 218 (Fig. 4). Prueher and Rea (1998) emphasize the synchronism of the ~2.5 Ma intense 219 volcanic period all around the North Pacific and agree with Cambray et al. (1995) 220 who suggest that the underlying mechanism operated on a much larger scale than 221 just a local change in subduction angle or rate. They suggest a link between intense 222 volcanism and Late Pliocene glaciation. Kennett et al. (1975) already hypothesized 223 that climatic (e.g., late Pliocene glaciation) rather than tectonic controls forced 224 periods of enhanced volcanic activity, but were unable to demonstrate this. In the 225 following we focus on studies that employed statistical methods to analyze volcanic 226 time series and their correlation with paleo-climate time series.
227 Paterne et al. (1990) studied the 190 kyr volcanic history of the Campanian province 228 (Italy) through the tephra inventory of central Mediterranean marine sediment cores.
229 Tephra layers were correlated between cores and dated by δ18O stratigraphy as well 230 as through correlation with dated tephras on land, providing a total of 151 volcanic 231 events (118 Campanian, 33 from other Italian volcanic systems). Using a sliding- 232 window technique, Paterne et al. (1990) generated a frequency distribution over time 233 that revealed five periods of enhanced volcanic activity (Fig. 5), which correlate with
234 compositional changes in the volcanic rocks. Moreover, power spectral analysis 235 shows that these pulses occur with a 23 kyr periodicity, which is close to the Earth’s 236 precession period.
237 McGuire et al. (1997) compiled an 80 kyr long succession of ash layers of the central 238 and eastern Mediterranean Sea including also the time series of Paterne et al.
239 (1990). They observed enhanced tephra accumulation at 8–15, 34–38, and 55–61 240 kyr BP and compared these intervals with the paleo-sea-level record. They applied 241 statistical methods to analyze the time series and noted that the around 22 kyr period 242 of relative volcanic quiescence correlates with the last low sea-level stand while the 243 volcanically intense period 8–15 kyr accompanied the very rapid post-glacial sea- 244 level rise (Fig. 5). By determining the first derivative of the sea-level variation 245 McGuire et al. (1997) showed that tephra frequency correlates with the rate of sea- 246 level change but lags behind by a few thousand years.
247 Glazner et al. (1999) investigated the distribution of radiometric ages of intraplate 248 volcanic events in eastern California over the last 800 kyr. Their smoothed age 249 distribution shows peaks at 10, 100, 185, 320 and 690 kyr, which visually 250 anticorrelate with interglacial maxima (Fig. 6). Subsequently, Jellinek et al. (2004) 251 statistically evaluated the first 400 kyr of the data set by 1) distinguishing between 252 basaltic and silicic volcanism, and 2) calculating power spectra for this volcanic time 253 series as well as for a comparative climate time series (SPECMAP) that serves as a 254 proxy for global glaciation (e.g., Shackleton, 1987), using a standard multi-taper 255 algorithm (Fig. 7a, b). They found a clear 40 kyr and less-well constrained 17 and 23 256 kyr periodicities (i.e., the well-known Milankovitch periods) in the volcanic record as 257 well as in the SPECMAP climate proxy data. Their advanced statistical treatment 258 also revealed a significant correlation between changes in eruption frequency and 259 the first derivative of the glacial time series, suggesting a response of volcanism to
260 the rate of ice-volume reduction that occurs with a time lag of 3.2 ± 4.2 kyr for silicic, 261 and 11.2 ± 2.3 kyr for basaltic magmas, respectively.
262 Schindlbeck et al. (2018) statistically analyzed the 1.1 Myr long tephra record of 263 IODP Hole U1437B at the Izu-Bonin arc (IB) and its relation to a) the planktonic 264 foraminifera δ18O profile of the core, and to b) the global benthic foraminifera δ18O 265 reference stack of Lisiecki and Raymo (2005) as climate and sea level proxy (Fig. 6).
266 Spectral analysis of the tephra dataset yields a statistically significant spectral peak 267 at the ~100 kyr period (the Milankovitch eccentricity period), which dominates global 268 climate cycles since the Middle Pleistocene (Fig. 7c, d). A time-domain analysis of 269 the tephra and δ18O records shows that volcanism peaks approximately 7 kyr after 270 the glacial maximum, which coincides with the period of the fastest rate of 271 lithospheric pressure change generated by deglaciation.
272 At Site U1437B, the best tephra- δ18O correlation obtained for the last 0.7 Myr. The 273 quality of the correlation is less for the period 0.7 – 1.1 Ma, also known as the Middle 274 Pleistocene Transition (MPT), a period during which the climate signal, expressed as 275 δ18O, the gradually changes from a 40 kyr dominant frequency to the 100 kyr 276 frequency (Fig. 7). Despite the decrease in spectral density of the 100 kyr periodicity 277 in the δ18O record during the MPT, the tephra record maintains its dominant 100 kyr 278 periodicity. Since this periodicity is associated with the formation of huge Northern 279 hemisphere continental ice sheets (Mudelsee and Schulz, 1997), Schindlbeck et al.
280 (2018) conclude that ice sheet formation persistent through the MPT, yet its 100 kyr 281 periodicity in the δ18O spectrum is largely obscured due to interference with other, 282 shorter periodicities. Differences in the correlation between volcanism and δ18O 283 record across the MPT were also observed by Nowell et al. (2006) in their analysis of 284 the 2 Myr eruption record of the western European volcanic fields. They note that 285 correlation results would be biased by the higher abundance of volcanic events
286 associated with higher oxygen isotope levels at <800 ka. However, comparison of 287 volcanic events with the contemporary slope in δ18O yielded best correlations as 288 volcanic activity lagged maximum warming rate 3-6 kyr.
289 While the above studies focused on geographically and geotectonically limited 290 regions, Kutterolf et al. (2013) compiled a tephra record from marine drill sites around 291 the entire Pacific Ring of Fire (ROF) (Fig. 6). This tephra record is assumed to 292 approximate the global temporal variation in eruption frequencies, since the ROF 293 accounts for about half of the global length of active plate subduction. Spectral 294 analysis identified a strong spectral peak for the obliquity period (41 kyr), while the 295 other Milankovitch periods are less significant or absent in that tephra record (Fig.
296 7e). Kutterolf et al. observed excellent correlation between the tephra record and the 297 first derivative of the δ18O record with a time lag of 4.0 ± 3.6 kyr, i.e. highest 298 frequency of volcanic eruptions is associated with the highest rate of rising eustatic 299 sea level (decreasing global ice volume). Numerical simulations quantify how 300 changes in eustatic sea level and glacial loading induced near-surface stress 301 variations during the last glacial cycle (Kutterolf et al., 2013). For Central America, 302 the most detailed ROF tephra record, maximum eruption frequency coincides with 303 the time of maximum rate of lithostatic pressure change after the last glaciation.
304 The baseline derived from these diverse regional and global studies is that periodic 305 pulses of volcanic activity are observed and that these periodicities correlate with the 306 Milankovitch periodicities of the global sea-level (δ18O) record with a certain phase 307 shift. However, the periodicities recognized differ between the tephra records, and no 308 tephra record contains the entire set of Milankovitch periodicities. These differences, 309 which may arise from the different lengths and event densities of the tephra records, 310 make it difficult to identify the underlying driving mechanisms by which climate affects 311 volcanic frequencies. We will further discuss these subjects in the following sections.
312
313
Discussion
314 While the studies summarized above all agree that global climate changes affect 315 volcanism and typically lead to increased volcanism during deglaciation, there are 316 also significant differences in the results (Table 1). For example, does peak 317 volcanism correlate with absolute sea-level/glaciation variations or with the rate of 318 change of sea-level? Why does each tephra record contain a different subset of the 319 Milankovitch periodicities? Why do the observed time lags in the volcanism-climate 320 correlations vary significantly? We now discuss two important issues that may be 321 responsible for the different results:
322 1) the nature of tephra time series, and 323 2) the methods of statistical treatment.
324 Understanding these aspects is important for deducing the physical mechanisms 325 through which climate changes may force volcanism.
326
327 The nature of tephra time series
328 The tephra time series are largely based on drill cores, in some cases also involving 329 data from geologic field studies. Uncompacted to little compacted sediments are 330 typically cored by gravity or piston coring including APC (advanced piston coring) 331 employed during deep sea drilling. These methods usually provide mostly full (100%) 332 recovery so that late Pleistocene through Holocene sequences can be recovered 333 almost completely. Harder rocks typically in deeper core sections require rotary 334 drilling, which yields much less recovery. Moreover, in highly compacted, altered and 335 cemented rocks the recognition of thin ash beds can become difficult, especially 336 when mineral-glass transitions as well as secondary mineral growth modify the 337 sediment and obscure tephra signals. Therefore early Quaternary to Tertiary tephra
338 sequences are expected to yield a lower event frequency. An increasing under- 339 representation of volcanic events with age in the geologic record has been 340 quantitatively analyzed for the Quaternary of Japan by Kiyosugi et al. (2015). This 341 effect can be observed in Figure 8b where the curves of cumulative event number 342 typically flatten to older ages. For instance, in the records of Glazner et al. (1999) and 343 Kutterolf et al. (2013) 85% and 70%, respectively, of the eruptive events are 344 concentrated within the first half of the length of the time series. In the 40 ka record of 345 Huybers and Langmuir (2009) 80% of the events occur in the last 1000 years, i.e. in 346 the first 1/40´s of the entire time series.
347 Where several cores from a given region are used to compile a tephra time series, it 348 is essential to correlate the ash beds between cores in order to avoid multiple 349 counting of single volcanic events. Even in single cores primary ash beds can appear 350 to occur multiply by reworking (e.g., Eisele et al., 2015), hence distinction between 351 primary and reworked ash beds is important. Another issue is different methods and 352 precision of tephra age dating and the respective data density within the time series.
353 Sources of variations and errors include: (1) Biostratigraphic and foraminiferal 18O 354 correlations determined at different decades may differ due to updating of methods.
355 (2) Preservation of datable calcareous fossils may vary due to fluctuations in 356 carbonate compensation depth (CCD). (3) Ash bed dating by linear interpolation 357 between age tie points in cores assumes constant accumulation rate of intercalated 358 sediments which may not be true; this risk increases the farther apart the tie points.
359 (4) Competing age models may exist for the same drill site (e.g. Schindlbeck et al., 360 2018). (5) Additionally radiometric age datings of tephra beds can have variably large 361 errors and are usually variably abundant across the entire age range (e.g., variable 362 age resolution in lacustrine records, Kutterolf et al., 2016). (6) The density of age
363 data throughout the time series that is variable and sometimes may not be high 364 enough to facilitate the detection of higher frequencies.
365 Tephra ages derived from an age model exclusively based on sediment correlation 366 with a global stable oxygen isotope record, which itself contains orbital tuning, carries 367 the risk that the fitting may “artificially” transfer that tuning to the tephra record.
368 Hence it would be better to use age models based on a combination of different 369 dating techniques.
370 Drill cores on oceanic plates have changed their position over time relative to 371 volcanic sources at subduction zones, typically moving closer to the arc. This 372 potentially causes an increase in recorded volcanic events to the younger core 373 sections (e.g., Kennett et al., 1977) particularly with fast plate motion such as in the 374 Pacific.
375 There are two ways by which tephra time series can be described, by tephra 376 thickness and by event number. Prueher and Rea (2001), for example, use the 377 variation in slope of a curve of cumulative thickness over age to distinguish times of 378 increased or reduced volcanic activity. However, in many records ash bed 379 thicknesses are not consistently reported, volcanic eruptions of a given magnitude 380 may be represented by variable thicknesses depending on position relative to source, 381 ash layer thickness may be reduced by erosion, many ash beds do not have a 382 sharply defined top but gradually change into ash-rich sediment, and cryptotephras 383 (ash dispersed in sediment) have no thickness at all. Therefore most tephra records 384 are described by event numbers, meaning they are binary records, where each point 385 in time has a value of either 0 or 1 (e.g., Fig. 8a).
386
387 Methods of statistical treatment
388 One way to investigate binary tephra records is to analyze curves of cumulative 389 event number over age (Fig. 8b). For example, McGuire et al. (1997) used this 390 approach to identify divergences from a straight line in cumulative number versus 391 age, which reflect times of increased or reduced rate in volcanism analogous to the 392 thickness approach mentioned above. More commonly, however, the binary series is 393 converted into a continuous series either by applying kernel methods (Newall et al., 394 2006) or by running a moving average over the data, whereby different time windows 395 and progression steps have been employed (Jellinek et al., 2004; Kutterolf et al., 396 2013; Schindlbeck et al., 2018). These authors as well as Paterne et al. (1990) then 397 used somewhat different techniques of spectral analysis to investigate the frequency 398 contents of the tephra time series. While each published approach certainly had its 399 justification and value, the diverse methods make it difficult to compare the results 400 and may lead, at least in part, to different results (e.g., observed periodicities).
401 Another problem is the different lengths of the records. The 23 kyr periodicity has 402 been observed in relatively short time series (e.g., Paterne et al., 1990), but was not 403 identified in longer records (e.g., Kutterolf et al., 2013). One cause for this may be - 404 next to required high data and age resolution - the increasing likelihood of missing 405 volcanic events with increasing age, which masks high frequency variations in 406 volcanic activity at age. It can therefore neither be proven nor disproven whether a 23 407 kyr periodicity existed consistently over the last millions of years.
408
409 In order to improve comparability between data sets, we re-analyzed the tephra time 410 series by the same approach. We chose records for which the individual data are 411 available, which are to our knowledge well dated, cover a sufficient length in time, 412 and presumably do not strongly suffer from sampling bias (Fig. 8a; Table 1). The re- 413 analyzed records are Jell04 with the East Californian data from Jellinek et al. (2004)
414 and Glazner et al. (1999), PR01 with the northwestern Pacific data from Prueher and 415 Rea (2001), the Pacific Ring of Fire tephra compilation K13 from Kutterolf et al.
416 (2013), and the Izu-Bonin-Japan tephra series Sch18 from IODP hole U1437B 417 recorded by Schindlbeck et al. (2018). Table 1 summarizes essential features of 418 these records such as their different age ranges and number of events, and their 419 cumulative number of events over time is displayed in Figure 8b.
420 The time series constitute binary time series equally sampled at 10 years intervals. A 421 value of 0 indicates that no eruption took place, a value of 1 indicates an eruption.
422 We limited longer records to the last 700 kyr; the McGuire et al. (1997) and Paterne 423 et al. (1990) data sets only cover the last 200 kyr and are therefore not included in 424 the following analyses despite high sample density and the presence of high- 425 frequency periodicities. The four records extend from before and across the post- 426 MPT period, and include multiple 100 kyr cycles.
427 The number of events in each record varies. The slope of the cumulative event 428 number curves in Figure 8b is proportional to the density of the eruption record and 429 typically deviate from a straight line, which represents a homogeneous time 430 distribution (which means no periodicities). For all time series, short and long term 431 deviations are visible. Particularly eye catching are the change from high to lower 432 slope at ~100 kyr in the K13 and ~200kyr in the Jell04 time series. Overall the K13 433 record exhibits the largest slope due to its highest event density (450 events in 1.2 434 Myr). A high density is also present in the McG97 record (107 events in 180 kyr). The 435 Sch18 time series has the lowest density (162 events in 1-1 Myr). Over the entire age 436 range, the slope of the cumulative curves slightly decreases as an artifact of 437 increasing under-recording of events to older ages (cf. Kiyosugi et al., 2015). On the 438 other hand, the PR01, Sch18 and Jell04 time series show an increase in slope 439 across the first 100-400 kyr where event density is relatively low.
440 In the following we do not apply a moving average to the data as it was done in the 441 previous studies, because this acts as a low-pass filter eliminating variations with a 442 period shorter than the moving-average time window. Instead we analyze the binary 443 data directly, which should lead to a better comparability between the different time 444 series. Moreover, unlike in earlier studies, we first perform the analysis in the 445 frequency domain rather than in the time domain; we will discuss the time domain 446 analysis in a later section.
447
448 Spectral density estimations in the frequency domain
449 In order to understand the behavior of binary data series in spectral analysis, we first 450 analyze an artificial binary sequence consisting of 10 events every 100 ka and 451 compare this to a time series consisting of a sine with a period of 100 kyr (Fig. 9a, b).
452 We calculate the spectra using the multi-taper spectral analysis method (Percival and 453 Walden, 1998; Thomson, 1982), which reduces the estimation bias in the power 454 spectra. It estimates the spectral density for each frequency by obtaining multiple 455 independent estimates from the same time series using a sequence of discrete 456 prolate spheroidal (DPSS) tapers. The resulting spectral resolution is determined by 457 the time-bandwidth product. A larger time-bandwidth product results in a smoother 458 spectrum, i.e. less resolution in the frequency domain. A smaller value gives higher 459 spectral resolution. Throughout this analysis we use a narrow time-bandwidth 460 product of 2.0.
461 The resulting spectrum of the sine wave consists of a single peak at a frequency of 462 1/100 kyr. Due to the pulsed nature of the binary sequence, the corresponding 463 spectrum shows a series of spikes of equal height, situated at the fundamental 464 frequency of 1/100 kyr and at the higher harmonic frequencies at 2/100 kyr, 3/100 kyr 465 etc. (Fig. 9b). Thus, a particular periodicity in volcanic eruptions manifests itself not
466 by a single peak at that frequency in the spectrum but by a series of peaks with 467 similar amplitudes at the harmonics of the fundamental frequency (Fig. 9b). This 468 renders it more difficult to identify different periodicities in the discrete, binary 469 volcanic records than, for example, in the more smoothly varying continuous 18O 470 record, where only one peak is associated with a particular frequency. The spectra 471 will be particularly difficult to interpret if more than one periodicity is present and the 472 resulting spectral patterns superimpose and affect each other. This is shown in 473 Figure 9c where we analyzed an artificial binary sequence consisting of 10 events 474 every 100 ka as well as every 41 ka. Evidently the overlay of just two periodicities in 475 the time series can generate an already fairly complex pattern of peaks in the 476 frequency spectrum.
477 In a further step, Figure 10 shows the spectra of the re-analyzed natural ash and 478 18O time series for the last 700 kyr compared with bars which indicate the expected 479 positions of peaks for the pure 100 kyr and 40 kyr periods derived from the artificial 480 time series as shown in Figure 9c. As a reference we also include the spectrum of an 481 artificial random binary sequence. The 18O time series, which is known to contain 482 the dominant 41 and 100 kyr periodicities, has spectral density peaks at the 483 corresponding primary frequencies indicated by the left-most blue and pink bars.
484 For some of the ash time series, a visually good agreement in frequency position is 485 seen at the expected peak positions for the pure 100 kyr and 40 kyr periodicities, 486 both for the primary (left-most) frequencies and for some of the harmonic 487 frequencies. In contrast, no systematic correlation is seen for the spectrum of the 488 random time series (Figure 10f). Figures 10b to 10e strongly suggest that all four ash 489 time series contain the ~40 kyr and ~100 kyr periodicities although these have not 490 always been found in the previous (time domain) studies (Table 1).
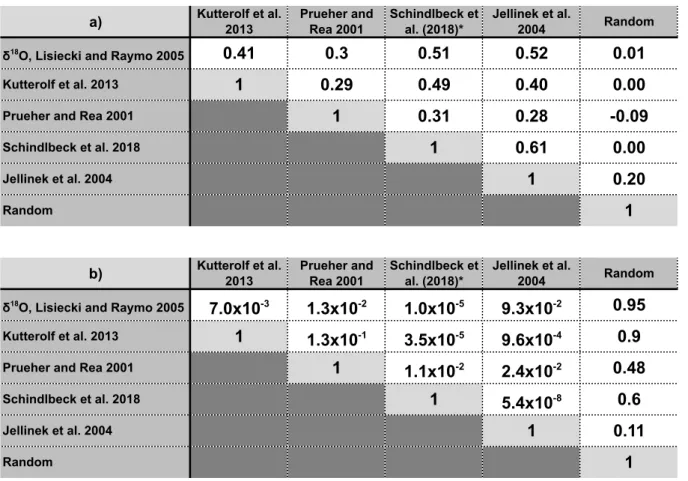
491 At first order, if an underlying global periodic physical process exists that influences 492 eruption frequencies next to the local effects, one would expect that the tephra 493 spectra are correlated with each other. This hypothesis is tested by calculating the 494 mutual correlations between the different ash record spectra. Table 2a shows the 495 correlation coefficients for correlation over a period range of 160 kyr to 10kyr. The 496 range was chosen since it encompasses the main Milankovitch periods of 100kyr, 497 41kyr and 23kyr. However, due to the decreasing density of volcanic events with 498 increasing age, we do not necessarily expect conclusive results for the 23kyr period 499 peak. The chosen range excludes longer periods, which are more strongly influenced 500 by long term sampling bias, and shorter periods, which may not be represented 501 adequately due to low sampling densities. Table 2b lists the probabilities that the 502 derived correlation coefficients may be reached by chance if the paired spectra were 503 actually uncorrelated. The spectra of K13, Sch18 and PR01 are statistically 504 significantly correlated, with probabilities of false correlations below <2%. The 505 spectra correlations with the Jell04 time series mostly do not yield statistically 506 significant correlation coefficients and higher (but still small) probabilities for a false 507 correlation; an exception is a weak correlation with Sch18 (probability of false 508 positive less than 4%). The observed correlation coefficients are generally not close 509 to one because all time series contain abundant “noise” from uncorrelated frequency 510 contents.
511 The lack of any statistically significant correlation between the tephra spectra and the 512 spectrum of a random time series indicates that the analysis is statistically valid, and 513 further verifies that correlations among the tephra spectra are significant. We can 514 thus conclude that there is a high probability that the eruption frequency variations 515 observed at different regions have a common underlying frequency component that 516 point to a global underlying mechanism.
517 We further correlate the tephra spectra with the 18O spectrum, bearing in mind that 518 the correlations may be biased by the existence of the harmonic peaks in the tephra 519 spectra. However, the coefficients of correlation are similar or even better than the 520 coefficients of correlation between the ash records (Table 2). They are again highest 521 and statistically most significant for K13, Sch18 and PR01 records, but low for the 522 Jell04 record. For our test case against the spectrum of a random time series the 523 coefficients are almost zero. These results further support the hypothesis that there is 524 a common underlying periodic mechanism that links eruption frequencies and 525 climate.
526 Correlations in the time domain
527 The approach in the frequency domain offers the opportunity to identify the frequency 528 distribution of the signal, yet it does not allow to identify the phase shift between the 529 time series. Therefore we now attempt to correlate the tephra time series with the 530 18O time series such that the correlation coefficient is determined as a function of 531 time lag. Positive lags in our definition are due to a shift of the ash record towards the 532 past and negative lags to a shift towards the present. The correlation tests how well 533 one record can be transformed into the other by a linear function and we expect a 534 maximum correlation (positive or negative) for a time shift that aligns variations in the 535 ash and 18O records.
536 To achieve meaningful values of the correlation coefficient, we cannot use the binary 537 series employed in the last section because the large number of zeros in the record 538 would result in very low correlation values. Instead, we need to create a continuous 539 time series and hence return to applying a 10 kyr phase-stable running average to 540 the ash record. Figure 11 shows the resulting smoothed time series in which 541 frequency peaks are mostly distributed along the age range. Only the Jell04 (~10 ka 542 and ~200 ka) and Sch18 (~340 ka) series contain unusually large peaks.
543 Figure 12 shows the correlations of these ash time series with the 18O time series as 544 a function of lag. Also included is the correlation of a random time series (which in 545 theory contains variations with all frequencies) with 18O, which can serve as a 546 threshold above which a correlation becomes statistically significant. The best 547 correlation is Sch18 with 18O. Sch18 attains the largest negative correlation 548 coefficient (~-0.5) at positive phase shift of +13.2 kyr. This implies that a maximum 549 eruption frequency occurs 13.5 ky before a minimum in 18O and 7 kyr after the 550 glacial maximum respectively, which places it in the transition from cold to warm 551 climate.
552 However, there are some critical issues of such time domain correlations. In contrast 553 to Sch18 the correlation coefficients for K13, Jell04, and PR01 are relatively low and 554 close to those for the random time series making it difficult to determine any phase 555 shift; this also implies a less clear correlation with sea-level change. Since Sch18 is 556 the only time series that is from a region completely unaffected by ice loading, it is 557 tempting to interpret these contrasting results to reflect some different driving 558 mechanism in glaciated and non-glaciated as well as oceanic and continental 559 regions. Yet our analysis in the frequency domain has demonstrated that all four 560 tephra series contain the important ~100 kyr and ~40 kyr periodicities that also 561 dominate the 18O record, which is the generally accepted sea-level proxy. The noise 562 from other frequencies is large in all tephra series and the 18O record, leading to 563 correlation coefficients generally well below 1 (table 2). The dominant frequencies in 564 18O are not precisely defined but form broad peaks over some frequency range 565 (e.g., the 100 kyr eccentricity does in fact range from 95 to 125 kyr), which introduces 566 relatively large errors for the calculated time lag. Moreover, the data density of the 567 time series poses a lower limit on the time lag that can be determined (Nowell et al.,
568 2006). Especially more evenly distributed and more precise high-resolution ages of 569 the tephra time series may also provide solutions for some of the above described 570 variations and problems. As a consequence, it remains difficult to judge whether or 571 not the periodicities in eruption frequency occur synchronously between the records, 572 and the precise relationshipwith the 18O record. In summary, we conclude that the 573 correlation in the time domain suffers from a number of uncertainties, which make it 574 difficult to interpret the results. The results of analysis in the frequency domain, 575 however, show that significant correlations exist even though correlation coefficients 576 in the time domain remain near the level for the random series.
577
578 Conclusions
579 The four re-analyzed tephra records cover a wide range in geographic latitudes and 580 include oceanic and continental settings, as well as glaciated and non-glaciated 581 regions. Three records represent from regional volcanic sources, and one record is a 582 semi-global compilation. Yet our analysis of the data in the frequency domain 583 demonstrated that all contain the ~40 kyr and ~100 kyr periodicities that also 584 dominate the 18O spectrum. The frequency spectra of the tephra and 18O records 585 are significantly correlated. This observation supports the hypothesis that orbital- 586 driven global climate changes interact with the volcanic eruption frequency regionally 587 and globally.
588 In order to investigate the relative timing or synchronicity of volcanic and climate 589 events, analysis in the time domain needs to be performed as was done in previous 590 studies (Jellinek et al., 2004; Nowell et al., 2006; Kutterolf et al., 2013). However, the 591 simultaneous analysis of the four best-characterized tephra records shows that 592 correlations suffer from a number of uncertainties and results should be used with 593 caution. For example, Jellinek et al. (2004) determined different time lags when
594 correlating silicic (3.2±4.2 kyr) and basaltic (11.2±2.3 kyr) tephra records separately 595 with the SPECMAP climate record (in fact, they correlated the first derivatives). But 596 are these different time lags the results of different physical processes or of the 597 different nature of the two data sets? Jellinek et al. (2004), Nowell et al. (2006), 598 Kutterolf et al. (2013) and Schindlbeck et al. (2018) consistently obtained time lags 599 that place the peak in volcanism in the deglaciation period. The observations from 600 Iceland and Alaska for volcanism since the last glacial maximum (Fig. 3) combined 601 with physical modeling results (e.g., Jull and McKenzie, 1996; Schmidt et al., 2013;
602 Albino et al., 2010) support such timing as plausible. However, considering the 603 uncertainties discussed above, can the time lags really be determined with such 604 precision to hit the deglaciation periods which typically last about 20 kyr for the 100 605 kyr cycles and are much shorter for the 41 kyr cycles? Moreover, most volcanoes 606 that contributed to the K13 and Sch18 tephra records lie well outside glaciated 607 regions. Is it plausible that volcanism increases at low latitudes where the rising sea- 608 level increases the lithospheric pressure while at the same time high latitude 609 volcanism increases presumably as consequence of the decreasing lithospheric load 610 as glaciers melt?
611 Most likely volcanic reactions to global climate changes are modulated by 612 geotectonic setting, regional geologic conditions, and geographic position but with 613 the presently available abundance and quality of the tephra and age records and the 614 associated uncertainties in the time domain analyses it is not yet possible to 615 disentangle these various influences. Therefore more precise tephra time series 616 (preservation and age optimized) from different regions (glaciated versus non- 617 glaciated) and geological settings (island arcs, continental arcs, intraplate) are 618 needed together with standardized statistical analysis to decipher the impact of these 619 factors on a global perspective of how climate may control volcanism. Disentangling
620 these influences will also provide better understanding of the physical processes that 621 regulate the feedback between global and regional volcanism and climate changes.
622
623 Acknowledgements
624 We would like to thank all colleagues that have been involved in creating the basic 625 literature for this review paper for doing a great job and keeping this topic running for 626 the last decades. We hope that this review encourages more work on precise tephra 627 time series needed to extend the statistical treatment to unravel the mystery of both, 628 the cyclicity in volcanic records and the coincidence with climate proxies. SK and 629 JCS want to thank the German Research Foundation (SCHI1349/1-1, KU2685/2-1, 630 2-2, 4-1) as well as IODP for providing support. In particular we also want to thank 631 two anonymous reviewers for their helpful comments and suggestions, which helped 632 to improve this paper.
633
634 References:
635 Albino, F., Pinel, V. and Sigmundsson, F., 2010. Influence of surface load variations 636 on eruption likelihood: application to two Icelandic subglacial volcanoes,
637 Grímsvötn and Katla. Geophysical Journal International, 181(3): 1510-1524.
638 Bond, D.P. and Wignall, P.B., 2014. Large igneous provinces and mass extinctions:
639 an update. Volcanism, Impacts, and Mass Extinctions: Causes and Effects, 640 505. Geological Society of America Special Papers.
641 Bredemeyer, S. and Hansteen, T.H., 2014. Synchronous degassing patterns of the 642 neighbouring volcanoes Llaima and Villarrica in south-central Chile: the 643 influence of tidal forces. International Journal of Earth Sciences, 103(7): 1999-
644 2012.
645 Briffa, K.R., Osborn, T.J. and Schweingruber, F.H., 2004. Large-scale temperature 646 inferences from tree rings: a review. Global and Planetary Change, 40(1): 11-
647 26.
648 Cadet, J.-P., Pouclet, A., Thisse, Y., Bardintzeff, J.M. and Azéma, J., 1982a. Middle 649 America Neogene explosive volcanism and ash layers: evidence from the 650 Middle America Trench transect, Deep Sea Drilling Project 67. In: J. Aubouin, 651 R. von Huene and e. al. (Editors), Init. Repts. DSDP. U.S. Govt. Printing Office, 652 Washington, pp. 475-491.
653 Cadet, J.-P., Thisse, Y., Pouclet, A., Bardintzeff, J.M. and Stephan, J.F., 1982b.
654 Tephra from Deep Sea Drilling Project Leg 66: Middle American Trench
655 Transect (Southern Mexico). In: J.S. Watkins, J.C. Moore and e. al. (Editors), 656 Init. Repts. DSDP. U.S. Govt. Printing office, Washington, pp. 687-698.
657 Cambray, H., Pubellier, M., Jolivet, L. and Pouclet, A., 1995. Volcanic activity 658 recorded in deep-sea sediments and the geodynamic evolution of western 659 Pacific island arcs. In: B. Taylor and J. Natland (Editors), Active Margins and 660 Marginal Basins of the western Pacific. Geophysical Monograph, American 661 Geophysical Union, Washington, pp. 97-124.
662 Cambray, H. and Cadet, J., 1994. Testing global synchronism in peri-Pacific arc 663 volcanism. Journal of Volcanology and Geothermal Research, 63(3-4): 145-
664 164.
665 Campbell, I.H., Czamanske, G.K., Fedorenko, V.A., Hill, R.I. and Stepanov, V., 1992.
666 Synchronism of the Siberian Traps and the Permian-Triassic Boundary.
667 Science, 258: 1760-1763.
668 Carey, S. and Sigurdsson, H., 2000. Grain size of Miocene volcanic ash layers from 669 Sites 998, 999, and 1000: Implications for source areas and dispersal. In: R.M.
670 Leckie, H. Sigurdsson, G.D. Acton and G. Draper (Editors), Proceedings ODP, 671 Scientific Results 165, pp. 101-110.
672 Costa, K.M., McManus, J.F., Middleton, J.L., Langmuir, C.H., Huybers, P.J., 673 Winckler, G. and Mukhopadhyay, S., 2017. Hydrothermal deposition on the 674 Juan de Fuca Ridge over multiple glacial–interglacial cycles. Earth and 675 Planetary Science Letters, 479: 120-132.
676 Courtillot, V.E. and Renne, P.R., 2003. On the ages of flood basalt events. Comptes 677 Rendus Geoscience, 335(1): 113-140.
678 Cronin, T.M., 2012. Rapid sea-level rise. Quaternary Science Reviews, 56: 11-30.
679 Crowley, J.W., Katz, R.F., Huybers, P., Langmuir, C.H. and Park, S.-H., 2015. Glacial 680 cycles drive variations in the production of oceanic crust. Science, 347(6227):
681 1237-1240.
682 Deligne, N.I., Coles, S.G. and Sparks, R.S.J., 2010. Recurrence rates of large 683 explosive volcanic eruptions. Journal of Geophysical Research, 115: doi:
684 10.1029/2009JB006554
685 Dzurisin, D., 1980. Influence of fortnightly Earth tides at Kilauea Volcano, Hawaii.
686 Geophysical Research Letters, 7(11): 925-928.
687 Eisele, S., Freundt, A., Kutterolf, S., Ramalho, R.S., Kwasnitschka, T., Wang, K.L., 688 Hemming, S.R., 2015. Stratigraphy of the Pleistocene, phonolitic Cão Grande 689 Formation on Santo Antão, Cape Verde. Journal of Volcanology and
690 Geothermal Research, 301: 204-220.
691 Glazner, A.F., Manley, C.R., Marron, J.S. and Rojstaczer, S., 1999. Fire or ice:
692 anticorrelation of volcanism and glaciation in California over the past 800,000 693 years. Geophysical Research Letters, 26: 1759-1762.
694 Hein, J.R., Scholl, D.W. and Miller, J., 1978. Episodes of Aleutian Ridge explosive 695 volcanism. Science, 199: 137-141.
696 Highwood, E.J. and Stevenson, D.S., 2003. Atmospheric impact of the 1783-1784 697 Laki eruption: Part II Climatic effect of sulphate aerosol. Atmospheric Chemistry 698 and Physics, 3: 1177-1189.
699 Hofmann, C., Courtillot, V., Féraud, G., Rochette, P., Yirgu, G., Ketefo, E. and Pik, 700 R., 1997. Timing of the Ethiopian flood basalt event and implications for plume 701 birth and global change. Nature, 389: 838.
702 Huybers, P. and Langmuir, C., 2009. Feedback between deglaciation, volcanism, 703 and atmospheric CO2. Earth and Planetary Science Letters, 286(3): 479-491.
704 Jellinek, A.M., Manga, M. and Saar, M.O., 2004. Did melting glaciers cause volcanic 705 eruptions in eastern California? Probing the mechanics of dike formation.
706 Journal of Geophysical Research, 109: doi: 10.1029/2004JB002978.
707 Johnston, M.J.S. and Mauk, F.J., 1972. Earth Tides and the Triggering of Eruptions 708 from Mt Stromboli, Italy. Nature, 239: 266.
709 Jull, M. and McKenzie, D., 1996. The effect of deglaciation on mantle melting 710 beneath Iceland. Journal of Geophysical Research: Solid Earth, 101(B10):
711 21815-21828.
712 Jupp, T.E., Pyle, D.M., Mason, B.G. and Dade, W.B., 2004. A statistical model for the 713 timing of earthquakes and volcanic eruptions influenced by periodic processes.
714 Journal of Geophysical Research: Solid Earth, 109(B2).
715 doi:10.1029/2003JB002584
716 Kasahara, J. and Sato, T., 2001. Tidal Effects on Volcanic Earthquakes and Deep- 717 sea Hydrothermal Activity Revealed by Ocean Bottom Seismometer
718 Measurements. Journal of the Geodetic Society of Japan, 47(1): 424-433.
719 Kennett, J.P., McBirney, A.R. and Thunell, R.C., 1977. Episodes of Cenozoic
720 volcanism in the circum-Pacific region. Journal of Volcanology and Geothemal 721 Research, 2: 145-163.
722 Kennett, J.P. and Thunell, R.C., 1975. Global increase in Quaternary explosive 723 volcanism. Science, 187(4176): 497-502.
724 Kiyosugi, K., Connor, C., Sparks, R.S.J., Crosweller, H.S., Brown, S.K., Siebert, L., 725 Wang, T. and Takarada, S., 2015. How many explosive eruptions are missing 726 from the geologic record? Analysis of the quaternary record of large magnitude 727 explosive eruptions in Japan. Journal of Applied Volcanology, 4(1): 17. doi:
728 10.1186/s13617-015-0035-9
729 Kutterolf, S., Jegen, M., Mitrovica, J.X., Kwasnitschka, T., Freundt, A. and Huybers, 730 P., 2013. A detection of Milankovitch frequencies in global volcanic activity.
731 Geology, 41(2): 227-230.
732 Kutterolf S., Schindlbeck, J.C., Anselmetti, F.S., Ariztegui, D., Brenner, M., Curtis, 733 J.H., Schmidt, D., Hodell, D.A., Müller, A.D., Peréz, L., Peréz, W., Schwalb, A., 734 Frische, M., Wang, K-L. (2016) A 400-ka tephrochronological framework for 735 Central America from Lake Petén Itzá (Guatemala) sediments, Quart Sci Rev., 736 150, 200-220, doi:10.1016/j.quascirev.2016.08.023
737 Lambeck, K., Rouby, H., Purcell, A., Sun, Y. and Sambridge, M., 2014. Sea level and 738 global ice volumes from the Last Glacial Maximum to the Holocene.
739 Proceedings of the National Academy of Sciences, 111: 15296-15303.
740 Lavigne, F., Degeai, J.-P., Komorowski, J.-C., Guillet, S., Robert, V., Lahitte, P., 741 Oppenheimer, C., Stoffel, M., Vidal, C.M., Surono, Pratomo, I., Wassmer, P., 742 Hajdas, I., Hadmoko, D.S. and de Belizal, E., 2013. Source of the great A.D.
743 1257 mystery eruption unveiled, Samalas volcano, Rinjani Volcanic Complex, 744 Indonesia. Proceedings of the National Academy of Sciences, 110(42): 16742;
745 doi: 10.1073/pnas.1307520110
746 Lewis, S.E., Sloss, C.R., Murray-Wallace, C.V., Woodroffe, C.D. and Smithers, S.G., 747 2013. Post-glacial sea-level changes around the Australian margin: a review.
748 Quaternary Science Reviews, 74: 115-138.
749 Lisiecki, L.E. and Raymo, M.E., 2005. A Pliocene-Pleistocene stack of 57 globally 750 distributed benthic d18O records. Paleoceanography, 20(PA1003):
751 doi:10.1029/2004PA001071.
752 Lund, D.C. and Asimow, P.D., 2011. Does sea level influence mid-ocean ridge 753 magmatism on Milankovitch timescales? Geochemistry, Geophysics, 754 Geosystems, 12(12): doi:10.1029/2011GC003693.
755 Lund, D.C., Asimow, P.D., Farley, K.A., Rooney, T.O., Seeley, E., Jackson, E.W. and 756 Durham, Z.M., 2016. Enhanced East Pacific Rise hydrothermal activity during 757 the last two glacial terminations. Science, 351(6272): 478-482.
758 MacLennan, J., Jull, M., McKenzie, D., Slater, L. and Grönvold, K., 2002. The link 759 between volcanism and deglaciation in Iceland. Geochemistry, Geophysics, 760 Geosystems, 3(11): doi: 10.1029/2001GC000282.
761 Mahony, S.H., Sparks, R.S.J., Wallace, L.M., Engwell, S.L., Scourse, E.M., Barnard, 762 N.H., Kandlbauer, J. and Brown, S.K., 2016. Increased rates of large-magnitude 763 explosive eruptions in Japan in the late Neogene and Quaternary.
764 Geochemistry, Geophysics, Geosystems, 17(7): 2467-2479.
765 Manning, J.G., Ludlow, F., Stine, A.R., Boos, W.R., Sigl, M. and Marlon, J.R., 2017.
766 Volcanic suppression of Nile summer flooding triggers revolt and constrains 767 interstate conflict in ancient Egypt. Nature Communications, 8(1): 900; doi:
768 10.1038/s41467-017-00957-y
769 Mason, B.G., Pyle, D.M., Dade, W.B. and Jupp, T., 2004. Seasonality of volcanic 770 eruptions. Journal of Geophysical Research: Solid Earth, 109(B4).
771 doi:10.1029/2002JB002293
772 McCormick, M.P., Thomason, L.W. and Trepte, C.R., 1995. Atmospheric effects of 773 the Mt. Pinatubo eruption. Nature, 373: 399-404.
774 McGuire, W.J., Howarth, R.J., Firth, C.R., Solow, A.R., Pullen, A.D., Saunders, S.J., 775 Stewart, I.S. and Vita-Finzi, C., 1997. Correlation between rate of sea-level 776 change and frequency of explosive volcanism in the Mediterranean. Nature,
777 389: 473-476.
778 McLean, D.M., 1985. Deccan traps mantle degassing in the terminal Cretaceous 779 marine extinctions. Cretaceous Research, 6(3): 235-259.
780 McNutt, S.R. and Beavan, R.J., 1987. Eruptions of Pavlof Volcano and their possible 781 modulation by ocean load and tectonic stresses. Journal of Geophysical
782 Research: Solid Earth, 92(B11): 11509-11523.
783 Middleton, J.L., Langmuir, C.H., Mukhopadhyay, S., McManus, J.F. and Mitrovica, 784 J.X., 2016. Hydrothermal iron flux variability following rapid sea level changes.
785 Geophysical Research Letters, 43(8): 3848-3856.
786 Miller, G.H., Geirsdóttir, Á., Zhong, Y., Larsen, D.J., Otto-Bliesner, B.L., Holland, 787 M.M., Bailey, D.A., Refsnider, K.A., Lehman, S.J., Southon, J.R., Anderson, C., 788 Björnsson, H. and Thordarson, T., 2012. Abrupt onset of the Little Ice Age 789 triggered by volcanism and sustained by sea-ice/ocean feedbacks. Geophysical 790 Research Letters, 39(2): doi: 10.1029/2011GL050168.
791 Mudelsee, M. & Schulz, M., 1997. The Mid-Pleistocene climate transition: onset of 792 100 ka cycle lags ice volume build-up by 280 ka. Earth Planet. Sci. Lett. 151,
793 117–123.
794 Nowell, D.A.G., Jones, M.C. and Pyle, D.M., 2006. Episodic Quaternary volcanism in 795 France and Germany. Journal of Quaternary Science, 21(6): 645-675.
796 doi:10.1002/jqs.1005
797 Oppenheimer, C. (2003). Climatic, environmental and human consequences of the 798 largest known historic eruption: Tambora volcano (Indonesia) 1815. Progress in 799 Physical Geography: Earth and Environment, 27(2), 230–259.
800 https://doi.org/10.1191/0309133303pp379ra.
801 Pagli, C. and Sigmundsson, F., 2008. Will present day glacier retreat increase 802 volcanic activity? Stress induced by recent glacier retreat and its effect on 803 magmatism at the Vatnajökull ice cap, Iceland. Geophysical Research Letters, 804 35(9):doi: 10.1029/2008GL033510.
805 Patanè, G., Montalto, A., Imposa, S. and Menza, S., 1994. The role of regional 806 tectonics, magma pressure and gravitational spreading in earthquakes of the 807 eastern sector of Mt. Etna volcano (Italy). Journal of Volcanology and
808 Geothermal Research, 61(3): 253-266.
809 Paterne, M., Labeyrie, J., Guichard, F., Mazaud, A. and Maitre, F., 1990. Fluctuations 810 of the Campanian explosive volcanic activity (South Italy) during the past
811 190,000 years, as determined by marine tephrochronology. Earth and Planetary 812 Science Letters, 98(2): 166-174.
813 Percival, D.B., Walden, A.T., 1998. Spectral Analysis for Physical Applications:
814 Multitaper and Conventional Univariate Techniques 2nd ed.; Cambridge 815 University Press, Cambridge.
816 Praetorius, S., Mix, A., Jensen, B., Froese, D., Milne, G., Wolhowe, M., Addison, J.
817 and Prahl, F., 2016. Interaction between climate, volcanism, and isostatic 818 rebound in Southeast Alaska during the last deglaciation. Earth and Planetary 819 Science Letters, 452: 79-89.
820 Prueher, L.M., Rea, D.K., 1998. Rapid onset of glacial conditions in the subarctic 821 North Pacific region at 2.67 Ma: clues to causality. Geology 26, 1027-1030.
822 Prueher, L.M. and Rea, D.K., 2001. Tephrachronology of the Kamchatka - Kurile and 823 Aleutian arcs: evidence for volcanic episodicity. Journal of Volcanology and 824 Geothermal Research, 106: 67-84.
825 Pyle, D.M., 1995. Mass and energy budgets of explosive volcanic eruptions.
826 Geophysical Research Letters, 22(5): 563-566.
827 Railsback, L.B., Gibbard, P.L., Head, M.J., Voarintsoa, N.R.G., and Toucanne, S., 828 2015. An optimized scheme of lettered marine isotope substages for the last 1.0 829 million years, and the climatostratigraphic nature of isotope stages and
830 substages. Quaternary Science Reviews 111, 94-106.
831 Rampino, M.R., Self, S., and Fairbridge, R.W., 1979. Can rapid climatic change 832 cause volcanic eruptions?: Science, v. 206, p. 826–829.
833 Rampino, M.R. and Self, S., 1982. Historic eruptions of Tambora (1815), Krakatau 834 (1883), and Agung (1963), their stratospheric aerosols, and climate impact.
835 Quaternary Research, 18: 127-143.
836 Rampino, M.R. and Self, S., 1993. Climate-Volcanism Feedback and the Toba 837 Eruption of ∼74,000 Years Ago. Quaternary Research, 40(3): 269-280.
838 Rawson, H., Pyle, D.M., Mather, T.A., Smith, V.C., Fontijn, K., Lachowycz, S.M. and 839 Naranjo, J.A., 2016. The magmatic and eruptive response of arc volcanoes to 840 deglaciation: Insights from southern Chile. Geology, 44(4): 251-254.
841 Robock, A., 2000. Volcanic eruptions and climate. Reviews of Geophysics, 38: 191-
842 219.
843 Robock, A., 2002a. The Climatic Aftermath. Science, 295: 1242-1244.
844 Robock, A., 2002b. Pinatubo eruption: The climatic aftermath. Science, 295: 1242-
845 1244.
846 Ryan, W.B.F., Carbotte, S.M., Coplan, J.O., O'Hara, S., Melkonian, A., Arko, R., 847 Weissel, R.A., Ferrini, V., Goodwillie, A., Nitsche, F., Bonczkowski, J. and 848 Zemsky, R., 2009. Global Multi-Resolution Topography synthesis.
849 Geochemistry, Geophysics, Geosystems, 10(3): Q03014.
850 Scharff, L., Hort, M. and Varley, N.R., 2015. Pulsed Vulcanian explosions: A 851 characterization of eruption dynamics using Doppler radar. Geology, 43(11):
852 995-998.
853 Schindlbeck, J.C., Kutterolf, S., Freundt, A., Straub, S.M., Wang, K.-L., Jegen, M., 854 Hemming, S.R., Baxter, A.T. and Sandoval, M.I., 2015. The Miocene
855 Galápagos ash layer record of Integrated Ocean Drilling Program Legs 334 and