Social background's effect on educational attainment:
does method matter?
Citation for published version (APA):
Büchner, C. I. R., van der Velden, R. K. W., & Wolbers, M. H. J. (2013). Social background's effect on educational attainment: does method matter? Maastricht University, Graduate School of Business and Economics. GSBE Research Memoranda No. 005 https://doi.org/10.26481/umagsb.2013005
Document status and date:
Published: 01/01/2013
DOI:
10.26481/umagsb.2013005
Document Version:
Publisher's PDF, also known as Version of record
Please check the document version of this publication:
• A submitted manuscript is the version of the article upon submission and before peer-review. There can be important differences between the submitted version and the official published version of record.
People interested in the research are advised to contact the author for the final version of the publication, or visit the DOI to the publisher's website.
• The final author version and the galley proof are versions of the publication after peer review.
• The final published version features the final layout of the paper including the volume, issue and page numbers.
Link to publication
General rights
Copyright and moral rights for the publications made accessible in the public portal are retained by the authors and/or other copyright owners and it is a condition of accessing publications that users recognise and abide by the legal requirements associated with these rights.
• Users may download and print one copy of any publication from the public portal for the purpose of private study or research.
• You may not further distribute the material or use it for any profit-making activity or commercial gain
• You may freely distribute the URL identifying the publication in the public portal.
If the publication is distributed under the terms of Article 25fa of the Dutch Copyright Act, indicated by the “Taverne” license above, please follow below link for the End User Agreement:
www.umlib.nl/taverne-license
Take down policy
If you believe that this document breaches copyright please contact us at:
repository@maastrichtuniversity.nl
providing details and we will investigate your claim.
Download date: 22 Dec. 2021
Charlotte Büchner, Rolf van der Velden, Maarten Wolbers
Social background’s effect on educational attainment: does method matter?
RM/13/005
Social Background’s Effect on Educational Attainment:
Does Method Matter?
Charlotte Büchner*, Rolf van der Velden*, Maarten Wolbers+
*Research Centre for Education and +Department of Sociology
the Labour Market (ROA), Radboud University Nijmegen
Maastricht University
Abstract
Social background directly impacts educational choice and attainment, but also influences choice and attainment indirectly by affecting school performance. Boudon (1974) described this relationship as primary (indirect) and secondary (direct) effects of social stratification. Based on this approach and Mare’s sequential transition model, we decompose this impact to analyze these effects’ relative importance at various stages over the school career. Using Dutch panel data of three school cohorts, we can assess whether primary and secondary effects’ relative importance has been stable over time. We use different statistical methods to assess the results’ robustness.
Our findings show secondary effects have a decreasing impact at the first transition over time but a rather stable and in some cases increasing impact at the educational career’s later stages. As a result, the cumulative share of secondary effects on educational attainment is stable over time, at least if one examines the last two cohorts. When using ordinary least squares (OLS) or counterfactual models, secondary effects amount to some 55% of social background’s total effect.
However, using structural equation modeling that allows for taking into account measurement error in performance tests and social background, secondary effects’ relative importance amounts to some 45%. This result suggests method does matter for numerical closeness. Nevertheless, the findings of all models used in this study point in the same direction and suggest that preferences and expectations of aspiring higher educational levels remain strongly associated with social background.
JEL classification: C12, I21, I24
Keywords: Hypothesis Testing, Schooling, Education, Inequality
1 Introduction
Research has found a strong relationship exists between the parent’s social status and the offspring’s educational achievement (e.g., Bourdieu, 1973; Mare, 1981; Shavit and Blossfeld, 1993). A child’s social background directly impacts available educational choice and attainment but also indirectly influences choices and attainment by affecting pre-school cognitive-skills development as well as subsequent school performance. Boudon (1974) described this relationship as primary (indirect) and secondary (direct) effects of social stratification, as they explain inequality of educational opportunity (IEO) across social strata. Thus, throughout the educational career, primary effects reflect differences in performance at a given point, and secondary effects reflect differences in choices made at different branches or transition points. In Boudon’s model, primary effects occur at the first transition, for example, the transition from primary to secondary education but not at later transitions. At the first transition, primary effects clearly outweigh secondary ones. At later transitions, however, secondary effects continue exerting influence. The cumulative effect of these differential choices may well outweigh performance’s differential effects if enough branches occurred, necessitating numerous such choices.
Mare (1979, 1980, 1981) has taken this notion a step further and developed a model that considers sequential transitions from compulsory until tertiary education, conditional on choices made at previous stages of the educational career. At each stage, the probability of entering or leaving the next higher educational level is dependent on the social background. Moreover, Mare (1981) adds an important aspect by explicitly distinguishing between two - possibly offsetting - trends in IEO. One concerns changes in transition probabilities: IEO has declined, as a result of educational expansion, leading to higher transition rates of all social classes but more rapidly for the lower than for the higher classes (due to ceiling effects). The other trend is social background’s effect on transition probabilities, which may decrease or increase over time. Failing to properly distinguish this tendency in the statistical model may obscure these two different trends. Mare demonstrates the logistic response model adequately captures the “true” socioeconomic effect, while the linear model combines the two effects, noting: “No model or measure is the best or correct way to represent [IEO]” (Mare 1981:83), but the two do imply distinct conceptions of inequality. The linear model focuses more on absolute changes in IEO, for example, by showing that the lower classes’ transition probabilities have greatly expanded. The logistic model concentrates on relative chances, showing, for example, that for the few students who have not made this transition, probability has become more dependent on social background.
Both Boudon’s and Mare’s publications have been very influential in IEO research. Several studies have examined IEO changes over time (e.g., De Graaf and Ganzeboom 1993; Jackson,
Erikson, Goldthorpe, and Meir 2007; Raftery and Hout 1993; Schindler and Reimer 2010) or IEO differences across countries (Blossfeld and Shavit 1993). With few exceptions, however, most work has concentrated on one transition only. For example, Erikson et al. (2005), Jackson et al. (2007), Kloosterman et al. (2009), and Schindler and Reimer (2010) applied a counterfactual model to analyze the relationship among social background, school performance, and educational attainment at one specific transition in the educational career. While Erikson and Jonsson (1996) do estimate the transition probability for different transitions (the transition to higher secondary and university education) in Sweden, they do not explicitly examine these tracks’ completion rates. Such a focus thus limits our analysis to Boudon’s claim that secondary effects resume their importance at later transitions, and whether or not primary and secondary effects’ relative importance varies at different transition and completion stages during the educational career.
Moreover, almost all authors use only one statistical method to assess primary and secondary effects’ relative contributions and – even more important – do not clearly outline their model’s assumptions and the implications it has for measuring either primary and secondary effects’ relative weight or IEO.
Therefore, in this paper, we aim to shed more light on two issues. First, we decompose both primary and secondary effects to estimate their relative importance at an educational career’s various stages in the Netherlands over a 25-year period. We explicitly distinguish between four stages of said educational career: transitioning from primary to secondary education tracks, completing the secondary track, transitioning from secondary to post-secondary education tracks, and completing the post-secondary track. As far as we know, with the exception of Mare’s, no study has systematically explored these stages’ completion. Previous studies on the second transition ignore the fact that this results from two different processes: successfully completing a previous track and choosing a post-secondary track. We cannot take for granted that merely choosing a secondary educational academic track will automatically lead to its successful completion. Moreover, the factors affecting completing a track may be quite different from those affecting its choice, for the former can be a function of performance and thus related to primary effects, while the latter can be a function of secondary effects.
Second, we systematically apply and compare different statistical methods. Two of these methods are commonly used: the counterfactual model and the linear regression model. We explore these models’ basic assumptions and relate them to different IEO concepts. Next to these two models, we apply structural equation modeling, which offers as an attractive feature in that it explicitly separates structural relations between variables from the measurement model. This is important, because the way previous studies have estimated secondary effects’ relative weight
depends on a precise measurement of both performance and social background. Any noise in these measures will underestimate social background’s total effect and bias the relative weight of secondary effects. Such biases can lead to the wrong policy implications. If policy makers want to reduce IEO, they need to know how strong the effect is and whether social class differentials are primarily performance-related or choice-related.
We use panel data from three large school cohort surveys from Statistics Netherlands that provide information about students’ social background and cognitive skills at the beginning of secondary education and, on an annual basis, their school progress until the end of formal education.
The data allow for a 25-year-long observation period, covering 1977 through 2004. Based on the theoretical approach of Boudon and Mare’s sequential transition model, we will decompose primary and secondary effects to estimate their relative importance at different stages in the educational career. The first stage studies the choice of an academic or vocational track when entering secondary education. The second stage examines the successful completion of a secondary educational track, given that a track has been attended. The third stage considers the transition to a post-secondary education academic or vocational track, given that secondary education has been completed. The fourth stage focuses on the completion of a track in post-secondary education, given that a track has been attended. Furthermore, we will estimate an unconditional model in which we look at social background’s total effect on the highest educational level attained. We will systematically compare the results for the three different analytical models.
The related research questions are:
1. To what extent does the relative importance of primary and secondary effects change in the Netherlands during the observation period, 1977–2004?
2. To what extent does the relative importance of primary and secondary effects change over different stages in the educational career?
3. To what extent are the results dependent on specific methods that were used:
counterfactual model, linear regression model, and structural equation model?
Our findings show secondary effects’ diminishing impact at the first transition over time with a 4% to 10% decline – depending on the method – but a rather stable and, in some cases, expanding impact of secondary effects at the education career’s later stages. As a result, the cumulative share of choice-related differences in social background’s effect on educational attainment remains stable over time, at least if one examines the last two cohorts. The declining trend of secondary effects at the first transition is consistent with modernization theory assumptions, which suggest an overall higher demand for education. The linear regression models, however, show that in the last stage, at the successful completion of post-secondary education, the relative importance of secondary effects
show movement in the opposite direction that rises over time. This suggests that preferences and expectations of aspiring higher education at the post-secondary level remain increasingly associated with social background.
Our findings indicate that applying different methods affects primary and secondary effects’
relative magnitude: namely, method matters. Secondary effects are assessed to be some 43% of social background’s total effect at the first transition and some 55% at the final obtained degree if one uses linear regression models or counterfactual models. However, if one uses structural equation modeling that allows taking into account measurement error in the performance and the social background measures, the secondary effects’ relative importance declines to some 32% at the first transition and to some 47% at the final grade completed. In other words, the most commonly used methods (the counterfactual model and the linear regression model) overestimate choice-related class differentials’ relative weight by some 8% to 11%. Nevertheless, even the structural equation model illustrates that preferences and expectations of aspiring higher educational levels remain strongly associated with social background.
The remainder of this paper is organized as follows. Section 2 gives an overview of the educational system in the Netherlands. Section 3 discusses the theoretical background and formulates hypotheses with regard to the empirical analysis. Section 4 introduces the three statistical methods that are used to test the hypotheses and discusses their assumptions and their pros and cons.
Section 5 describes the data and operationalization of the variables. Section 6 presents the empirical findings in detail. The last section summarizes the main results and draws conclusions.
2 The Dutch school system
This section provides an overview of the formal school system in the Netherlands. Figure 1 illustrates the design of the educational system and the regular transitions, aligned with school years and age of the students.
Since the Mammoth Law came into effect in 1968, the secondary education system in the Netherlands turned into a more integrated system. It kept the different hierarchical school types, but facilitated transitions to secondary education by orientation classes (brugklas), and school communities in which different types of secondary education were included. Furthermore, nationwide standardized and compulsory skills tests as well as recommendations of the class teacher at the end of primary school were introduced to facilitate the decisions for a secondary school type (Dronkers 1993:262f.).
As shown in Figure 1, compulsory education starts with primary education at the age of four and generally ends at the age of 16. Primary education, organized in the so-called “basisschool”, is an all-day school and takes eight years, until the age of 12. The subsequent secondary education is divided in general education and pre-vocational education. The general education schools consist of pre-university education (VWO), higher general secondary (HAVO) and intermediate general secondary education (MAVO). The VBO-track provides pre-vocational education. IBO, as the lowest category, offers individual pre-vocational education for students with learning problems.
Only the two higher levels of secondary school prepare for tertiary education; that is HAVO for higher vocational education (HBO) and VWO for university education (WO). Both MAVO and VBO prepare for upper secondary vocational education (MBO). In general, MAVO aims to prepare for the long (3 or 4 years) tracks in MBO, while VBO aims to prepare for the short (1 or 2 years) tracks and the apprenticeship training. Each school track after primary education follows a certain pathway to the next higher track. Vertical upward transitions to the higher school tracks are allowed when appropriate levels beneath them have been completed. Downward transitions to lower tracks are possible at any time.
> Figure 1 about here <
3 Theoretical background
In this section, first we provide background information about the theoretical concept and discuss its related advantages and issues. Next, we introduce our hypotheses for the empirical analysis.
Decomposing social background into primary and secondary effects helps determine the ways the two effects have an impact on educational choices and attainment. According to Boudon (1974), primary effects reflect children’s cognitive and non-cognitive abilities, inherent with family background. Secondary effects reflect educational preferences that are chosen in reference to a certain social environment and previous cognitive performance.
Recent studies on child development show that abilities are highly correlated with both the family’s genetic background and the child’s environmental conditions. Differences in ability show up at early ages and manifest differently across socioeconomic groups (e.g., Carneiro and Heckman 2003; Gluckman and Hanson 2005; Heckman 2007). Better-educated parents tend to provide more intellectual stimulation, which results in more ambitious educational choices and successful achievement of their children (Erikson and Goldthorpe 2002; Shavit and Blossfeld 1993).
Choosing a specific type of educational path, however, is not only dependent on endowments but also on preferences, as well as on constraints imposed by a family’s cultural and economic
resources. Boudon defines these (class) differences as secondary effects of social stratification; that is, how individuals evaluate the costs and benefits of pursuing higher education, including financial and social costs and expectations of educational success. Assumptions of cultural capital theory (Bourdieu 1973; Bourdieu and Passeron 1964, 1977), cultural reproduction theory (e.g., Collins 1971), and rational action theory (e.g., Breen and Goldthorpe 1997) all point in the same direction.
Higher-status families choose more demanding tracks for their children, since they do not want to risk social demotion: They want to provide their children with enough opportunities so that their offspring might be able to maintain the socioeconomic status they have attained themselves. Cultural reproduction theory argues educational certificates thereby serve to both exclude members of lower- status groups from desirable positions in the occupational structure and keep higher education and higher-level job positions as privileges of dominant social groups (cf. Blossfeld and Shavit 1993:217). Rational action theory suggests the effort higher-status families make is less costly than the same would be for lower-status families. Lower-status families, in contrast, must make more burdensome sacrifices and therefore must have relatively stronger ambitions when they send their children to school for longer periods (Gambetta 1987). Socioeconomic differences thus are driven by rational decisions of rational actors at various transitions in the educational career (Breen and Goldthorpe 1997).
With respect to changes over time, modernization theorists argue that, due to industrialized societies’ requirements of an educated labor force, the educational qualifications’ importance rises in the labor market where educational expansion serves as a tool that responds to these requirements.
The theory goes that with increasing modernization, socioeconomic differences should diminish and educational selection will become more meritocratic (Parsons 1970; Treiman 1970). Indeed, ever since enhanced expansion and access to the educational system in the 1960s, educational participation of less-privileged groups has improved throughout all Western societies. In countries like the Netherlands, the educational system’s restructuring was part of the attempt to mitigate ascriptive criteria’s influences in favor of more meritocratic structures. This was conducted by introducing nationwide compulsory skills tests, primary school teachers’ school-type recommendations, and orientation classes at the transition to secondary education (Dronkers 1993:262f.). Several studies about the Netherlands (e.g., Bosma, Dronkers, and Hagenaars 1991; De Jong 1982; De Jong, Dronkers, and Saris 1982; Dronkers and Bosma 1990) pointed out these measures reduced social background’s effect on educational attainment at the transition from primary to secondary education.
Within our conceptual framework, we thus have two different time perspectives. One is the perspective within a school cohort looking at an individual’s school career and analyzing to what
extent social background’s effect changes at various school transitions. The other perspective is between school cohorts where we compare social background’s effects on particular school transitions over time.
Regarding our perspective within a school cohort, we hypothesize primary effects are stronger at the first transition (H1), while secondary effects are stronger at the second transition (H2). Current theory is not specific enough to allow a hypothesis on the relative weight of primary versus secondary effects on the completion of the secondary and post-secondary track.
Regarding the perspective of changes between cohorts, we follow modernization theory, which claims the educational expansion assigned greater weight to meritocratic selection with increasing graduation rates in higher secondary education. We therefore hypothesize secondary effects have diminished over our observation period for the transition to secondary as well as to post-secondary education (H3). We also assume completing these tracks increasingly will be determined by primary effects (H4).
4 Analytical strategy
In this section, we introduce the statistical techniques and their implications for the theoretical model. The statistical techniques under use are a counterfactual model, a linear regression (ordinary least squares or OLS) model, and a structural equation model using LISREL. The first two models have often been used in stratification research but have seldom been directly compared, while the third model is less often used but in our view, offers important advantages over the other two methods.
All three estimation methods as well as the way they are modeled come with different assumptions about the underlying concepts and mechanisms. The main differences relate to the concept of IEO, the concept of social background and educational attainment, the use of conditional or unconditional models, and the treatment of measurement error.
Absolute or relative IEO?
As indicated by Mare (1981), the main difference between the logistic response model and the linear model is how they view IEO. The logistic response model (and thus the counterfactual model) concentrates on socioeconomic background effect, given a certain overall transition probability, while the linear model (and the same applies for the structural equation model in our analysis) examines the combined effect of these two on IEO. The difference can be expressed that in terms of absolute IEO, transition probabilities for lower classes have greatly expanded, while for the few
students who have not made this transition, the probability has become more dependent on social background.
Continuous or categorical concepts of social background and educational attainment?
The counterfactual model uses a class approach toward social stratification where the main dividing lines are situated between a limited number of rather homogeneous classes, with respect to both social background and educational attainment. This is congruent with a view on the Dutch educational system as a construct supporting (self-reproducing) social class patterns.
The OLS and LISREL models basically view social background and educational attainment as continuous variables, rather than categorical variables, which is more in line with a social status approach. It is congruent with a view on social stratification in which the division of social positions can be depicted as a ladder and where acquiring resources, such as education and social capital, enables one to ascend that ladder.
Conditional or unconditional models?
In both the counterfactual model as well as the OLS model, we will use conditional models to examine stratification effects at each stage of the educational career. The conditional model implies at each stage, the group under analysis becomes smaller, as we look at only those who passed a certain transition. This is in accord with a view on education that regards the selection regime as a form of contest mobility (Turner 1960), meaning a limited number of transitions exist and at each transition, a selection is made between a higher and a lower track. This selection takes place based on performance and social background. Once a person is referred to a lower track, (s)he cannot return to a higher track. We will also estimate unconditional models in all three analyses by examining the highest degree obtained for the whole group. This is more consistent with a view on the education system as a permeable strata system providing alternative pathways to higher education throughout the school career.1
The treatment of measurement error
In the OLS and counterfactual models, primary effects are defined by the effect of school grades or performance tests on transitions to higher education. Secondary effects are then defined as the remaining effect of social background, after controlling for socioeconomic differences in
1 Breen and Jonsson (2000), who analyzed the Swedish educational system, which is comparable with that of the Netherlands, suggest different pathways that can be chosen in a parallel educational track system affect the probability of making subsequent educational transitions to a great extent (p. 754). In our analysis, we will take into account the different educational tracks in the Dutch school system and also systematically distinguish between vocational and academic school tracks at the secondary and post-secondary levels.
performance. School grades and performance tests, however, measure the “true” skills with measurement error. The more noise they produce, the lower the estimated primary effects will be and hence the higher the secondary effects will be. The same holds for measuring social background.
Usually estimated by the parents’ educational level or occupational status, the social background’s overall effect on educational attainment is likely to be underestimated in linear and counterfactual models.2 We assume that secondary effects in the OLS and counterfactual models are generally overestimated. The structural equation model explicitly accounts for this measurement error and allows for a more unbiased estimate of the secondary effects of social stratification.
4.1 Counterfactual model
The counterfactual model has recently been introduced by Erikson (2007) and Jackson et al. (2007) to estimate factual and counterfactual transition probabilities to higher secondary education, conditional on average school performances across social classes and over time. The model is based on the logistic response model and has as an attractive feature directly comparing what would happen to the transition probability of a certain status group if they would have the cognitive abilities or the preferences of a different group. The counterfactual method has successfully been applied in several studies to disentangle preferences and endowments and to measure social class differences in educational attainment (Erikson 2007; Jackson et al. 2007; Kloosterman et al. 2009;
Schindler and Reimer 2010). We adopt the method for the Netherlands to measure the average scholastic performance and transition and completion probabilities to academic tracks in secondary and post-secondary education for children from three different social class backgrounds. We group our social background variable into lower-educated parents (6-10 years of schooling), medium- educated parents (14 years of schooling), and higher-educated parents (17-19 years of schooling).
Primary effects of social stratification will be estimated by the mean and the standard deviation of the school performance scores, separately for each social class. The school performance scores are assumed to be normally distributed. For the transition probability to higher (post-) secondary education, we estimate binary logistic regressions measuring the effect of scholastic performance per social class.
To measure the relative importance of primary and secondary effects, we apply the method of numerical integration (cf. Jackson et al. 2007). For each social class, we calculate the proportion of students’ transition probability to academic tracks in secondary and post-secondary education, given their (normally distributed) performance scores per class. The integral is written as
2 This issue of measurement error is seldom explicitly discussed. Jackson et al. (2007), for example, focus on the issue of anticipatory decisions (the effect of preferences on the test itself), but leave aside the—probably more important—issue of measurement error in the test.
e dx
e e a bx
bx a
x
4 ( ( ) )4
2 / ) (
2 1
1 2 2
where µ indicates the mean of the performance scores and σ the standard deviation; a is the constant and b the logit coefficient that indicates the performance of a student of a certain social class. The term within the first parenthesis refers to the normalized distribution of the average performance score per social class, while the term in the second parenthesis indicates the transition probabilities obtained by the logistic regression. The advantage of numerical integration is that the two components can be separately calculated for any class transition and therefore enables to carry out counterfactual models (cf. Jackson et al. 2007:218f). That means that, ceteris paribus, combinations of class-specific performance distributions with performance-specific transition propensities of any other social class are possible. To give an example, we can combine the distribution of performance scores of children from higher-educated parents with the performance-specific transition probability of children from lower-educated parents.
4.2 Linear Regression Model
Using a linear regression model, we assume a linear relation between social background, test scores, and the school track choice or completion. We decompose the effects by estimating the total effect of parental background and the secondary effect of social background, controlling for cognitive skills.3 The equation for the total effects of social background can be written as
ij i ij
ij PED
Y1 0 1 (1)
where i denotes the individual and j the transition to or completion of a certain school track. Y1ij is the probability for the transition to, or completion of a certain (post-) secondary educational track, respectively. α0ij denotes the constant and β1jPEDi the coefficient for the effect of parents’ education at a certain stage (transition/completion) within the school career, while εij denotes the error term.
The estimation of secondary effects of social background is done in two variants, an unconditional estimation of the cumulative secondary effects, and an estimation of direct secondary effects that are conditional on the previous tracks that an individual has chosen. Regarding the cumulative secondary effects, we write
3 See also Buis (2010) for the definition of direct, indirect, and total effects of social background.
ij i i
ij
ij PED PERF
Y2 0 1 2 (2a)
where β2jPERFi denotes performance scores of a student obtained at the end of primary education.
Regarding direct secondary effects of social background we additionally control for previous transitions within the educational career, i.e.
ij ij i
i ij
ij PED PERF STRACK
Y3 0 1 2 3 1 (2b)
where STRACK denotes the school track at time t-1. By subtracting the estimated coefficients of social background either of equation (2a) or (2b) from the estimated coefficient of social background of equation (1), we obtain an estimate of the secondary effects.
4.3 Structural equation model
As indicated above, both the counterfactual and the OLS model simply assess the secondary effects as the effects of social background after controlling for cognitive skills. This way of decomposing the total social background effect into primary and secondary effects is vulnerable to measurement error, especially of cognitive skills. We thus apply a structural equation model with latent variables that allows to capture measurement error and to estimate the structural relations between the latent variables more accurately. In a first model we treat cognitive skills as a latent variable that is defined by the CITO math and language scores measured at age 12 (for a detailed explanation, see data section below). The lambda parameter of the math score is fixed to one, while the lambda parameter of the language score is kept free. The latent variable cognitive skills is our main interest, since estimating performance scores from a relatively short test is most vulnerable to measurement error.
The latent variable social background is defined by the average of parents’ education, first choice secondary education is defined by the first school track students enter at age 12, and final educational degree is defined by the overall years of schooling observed per student. In this first model, all lambda parameters for the latent variables, except cognitive skills, are fixed to one and the measurement error is fixed to zero.
In a second model we also take measurement error in the latent social background-variable into account, as the average of parents’ education is also sensitive to measurement error and thus likely to underestimate the total effect of social background on educational attainment. We re-define the latent variable social background by single measures for father’s and mother’s education,4 fixing
4 This model could still improve, if we would add parents’ occupational status to the latent variable social background.
Unfortunately, this information was not available in the data.
the lambda parameter of father’s education to one, and keeping the lambda parameter of mother’s education free. This new latent variable replaces the former latent variable for social background in the first model.
5 Data
The analysis uses panel data of three school cohorts provided by Statistics Netherlands (Centraal Bureau voor de Statistiek, CBS). Each cohort is a national representative sample of students at age 12 who enter secondary education. The three cohorts have the same design. Data has been collected in 1977 (N=37,280), 1989 (N=19,524) and 1993 (N=20,331), respectively.5 At the start of the cohort, at age 12, information is gathered on performance in language, math and some other personal characteristics for all students in the class as well as a large number of background characteristics through interviewing the parents. Annual information about subsequent school track choices and completion is collected until the end of full-time education for almost all students in the sample.6 Each cohort is analyzed separately on the basis of comparable information available in all cohorts.
5.1 Dependent variables
As mentioned above, we want to investigate the influence of primary and secondary effects at four different stages during the educational career: at the transition from elementary school to secondary education (t1), at the completion of secondary education, given secondary education has been entered (t2), at the transition to post-secondary education, given secondary education has been completed (t3)7, and at the completion of post-secondary education, given post-secondary education has been attended (t4).8 The dependent variables include the choice or completion of school tracks in secondary and post-secondary education levels, respectively. In addition, we calculate an unconditional model of the highest degree that a student obtained.9
5 For this analysis we leave out the cohort that started in 1982. The sample design and the parental questionnaire of that cohort differ too much from the three other cohorts to make them really comparable, especially as we will use different statistical methods.
6 If a pupil drops out of the survey before he or she has finished a (final) grade, we use the last information available about the educational choices and attainment.
7 A student has completed the secondary education level successfully, if he or she passed a final exam and/or proceeded to post-secondary education. If a student is observed at a certain track at post-secondary education level but leaves this track without a passed exam, he/she will be allocated to the exam passed before at secondary education level. If no exam was passed at all or the information is missing, this student will not be taken into account, with regard to the unconditional model and the conditional model on completing post-secondary education.
8 For cohort 1993 information is collected until school year 2003/2004, when students are aged 22. Some respondents may not have finished education at higher levels at that time and thus cannot be considered at stage t4.
9 Based on our school continuation model we only consider students who stay in education. Persons who drop out from school after secondary education are not taken up in the subsequent analysis. We assume that this will have a downward bias on the estimation of the secondary effects.
For the linear regression and structural equation model, we will use a detailed measure of these tracks, distinguishing all possible tracks in the Dutch school system. These tracks are coded into a specific years of schooling scale (the so-called ‘years of schooling ladder’, cf. Van der Velden 1991), which measures all educational positions as a function of how many years it will take to reach the top of the educational system, i.e. completing university education. The choice of tracks in secondary education is assigned the following scores: VWO (9), HAVO (8), MAVO (7), VBO (6), and IBO (5). Students who start in orientation classes of mixed school forms are assigned to one of these tracks as soon as they change to a single school type. The completion of these tracks is assigned the scores: VWO (15), HAVO (13), MAVO (11), VBO (10), and IBO (9). In post- secondary education the following scores are assigned to the choice of a particular school type: WO (15), HBO (13), 3 or 4 years MBO (11), and 1 year or 2 years MBO (10). Completing the tracks in postsecondary education is scored as: WO (19), HBO (17), 3 or 4 years MBO (14), and 1 year or 2 years MBO (12). For the counterfactual model we simply distinguish between academic tracks and vocational tracks in secondary and post-secondary education. We combine HAVO and VWO as the academic tracks in secondary education and HBO and WO as the academic tracks in post-secondary education. All other tracks are labeled as vocational tracks.
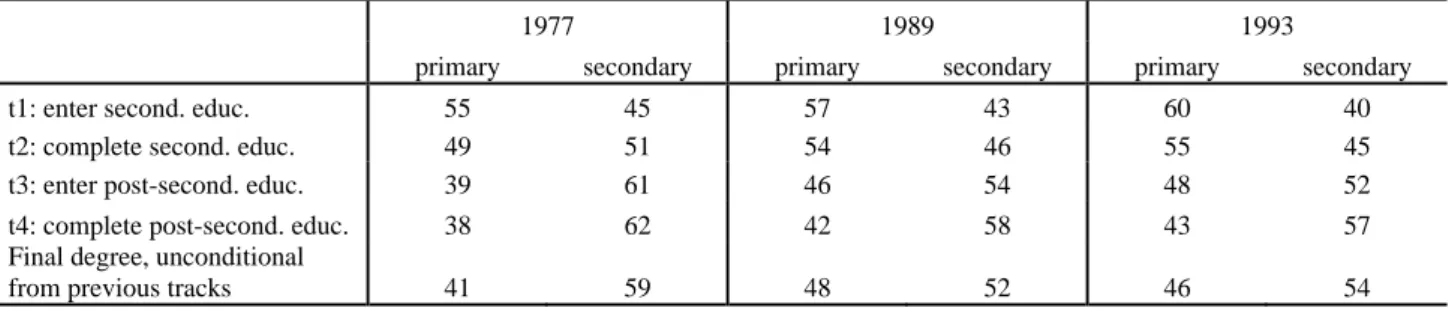
Figures 2a–2c illustrate the transitions in the Dutch school system, divided into vocational and academic tracks for each cohort, starting from primary education to entering and completing secondary education, until the entry to post-secondary education. The share of transitions to vocational and academic tracks in secondary education hardly changed over time. Some 30% of all students of each cohort chose a general academic track after primary education. The vast majority of them, i.e. more than 90%, also complete an academic track in secondary education. The vocational track is chosen by 70% of the students of each cohort and also completed by almost 90% of them.
Clear changes over time occur at the transition to post-secondary education. Whereas more than half of the students with a vocational degree in secondary education enter a vocational track in post- secondary education, the share of students with a vocational degree in secondary education who subsequently follow an academic track in post-secondary education, has increased by ten percentage points, from 4% in cohort 1977 to 14% in cohort 1993. Furthermore, students who completed an academic track in secondary education have increasingly continued with an academic track in post- secondary education over time, from 51% in cohort 1977 to 81% in cohort 1993. As a consequence, the share of students who – after completing secondary education – do not continue with post- secondary education has fallen drastically over time. For those who completed a vocational track, the share decreased from 48% in the oldest cohort to around 35% in the two younger cohorts. For the students who completed an academic track in secondary education the decrease in the share not
following post-secondary education is even more impressive, with a steady decline from 35% for the 1977 cohort to 11% for the 1993 cohort.
> Figures 2a-2c about here <
5.2 Independent variables
Social background. As a measure for social background, we take the average of the highest educational level attained by the parents, again coded in the ‘years of schooling’ scale.10 We distinguish parental education into primary education (6 years), lower secondary education (MAVO or VBO: 10 years), higher secondary education (VWO, HAVO or MBO: 14 years), lower tertiary education (HBO: 17 years) and higher tertiary education (WO: 19 years). Across the cohorts, the share of parents with only primary and lower secondary education decreased, while the shares of parents with higher secondary education or tertiary education increased (not illustrated).
Cognitive skills/scholastic performance. As an indicator for cognitive skills, we use test scores based on standardized compulsory tests in mathematics and language, which are provided by the Dutch Central Institute for Test Development, the so-called CITO tests. Usually conducted at the end of primary education, the CITO tests estimate the state of knowledge, development and capability level of each student, before they enter secondary education. The tests provided in the data are conducted about half a year later and differ in the length and the scaling format from the regular CITO tests.
They are constructed as repeated tests exclusively for the survey. Hustinx et al. (2005) found that the test results in the surveys are comparable with those of the original CITO tests and serve as good proxies. Anticipatory decisions in terms of affecting the performance level in successive examinations are not an issue here, since decisions already have been made on the basis of the regular CITO tests at the end of primary education.11 The tests were measured somewhat differently over the cohorts; therefore we normalized the scores on a scale from 1 to 100.12 Correlations between test scores and social background are between 0.32 (cohort 1977) and 0.37 (cohorts 1989 and 1993).
10 Most studies on primary and secondary effects (e.g., Erikson et al. 2005; Jackson et al. 2007; Schindler and Reimer 2010) use the occupational status of the parents, but this information is not available in our data. However, De Graaf and Ganzeboom (1993) show for the Netherlands that the educational attainment of the father is a better indicator in terms of predicting educational success of the offspring and is more resistant to changes over time, than the father’s occupational status.
11 For more information about anticipatory decisions, see Erikson et al. (2005), and Jackson et al. (2007).
12 Note that we standardize the test scores to make the results comparable across cohorts. In a pooled analysis however, this would be an issue, as the ‘wrong’ standardization can have peculiar effects on other parameters.
6 Results
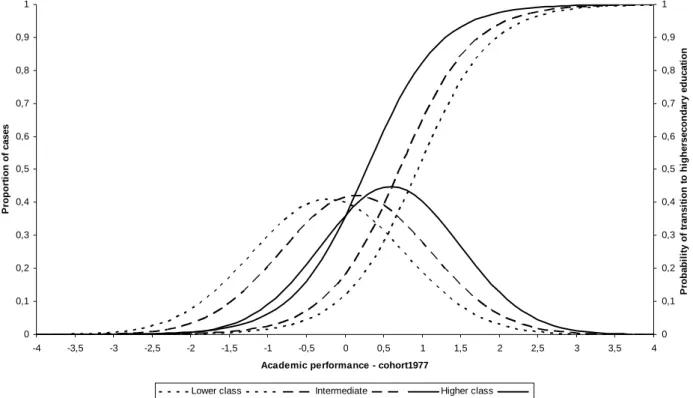
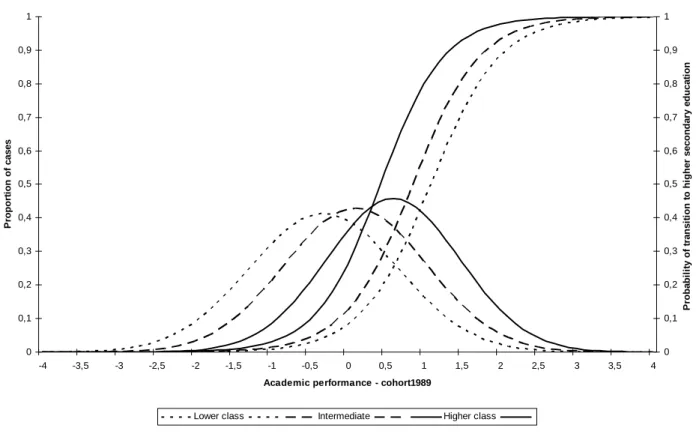
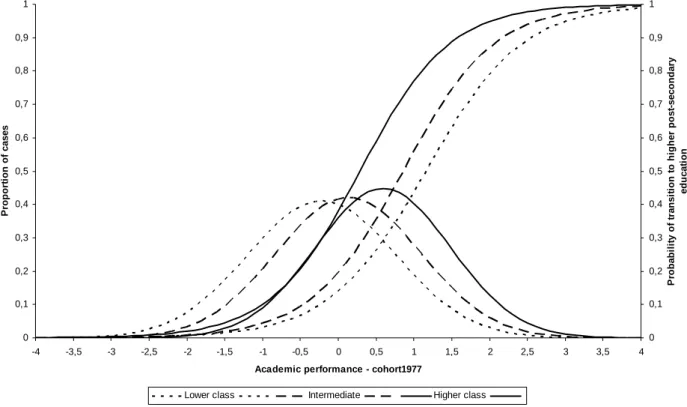
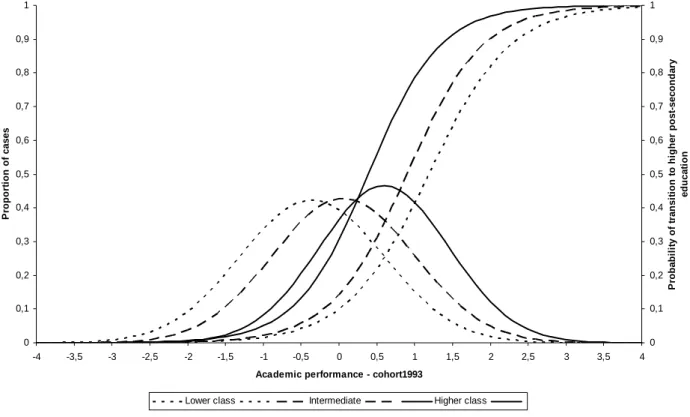
For an initial descriptive view on primary and secondary effects, Figures 3a–3f show the distributions of scholastic performance and the logistic curves for making the transition to academic tracks in (post-) secondary education for each cohort separately.
> Figures 3a–3f about here <
The figures show the performance distribution of students from higher-educated parents is always found situated far more to the right; that is, this group on average performs higher on performance tests than do the other two groups. Students from lower-educated parents on average perform the lowest of all groups, while the children from medium-educated parents fall in-between.
These differences in primary effects are consistent over the whole observation period. Moreover, the distance between the socioeconomic groups has widened over time: The difference in the average performance scores between children from higher- and medium-educated parents has increased from Cohort 1977 to the youngest cohort. A similar picture can be seen when comparing children from higher- and lower-educated parents. The difference in average performance scores between children from medium- and lower-educated parents is less evident, but the results indicate primary effects increase over time.
With regard to the logistic curves of Figures 3a–3f, we observe several features about social class-specific transition propensities: Given a certain performance level, students from higher- educated parents are most likely to continue in academic tracks in secondary and post-secondary education over all cohorts, followed at some distance by children from medium- and lower- educated parents. Although children from higher-educated parents perform better on average, their transition propensity-curve also is located far more to the left, which signals that secondary effects already work at the performance distribution’s lower end. The average academic performance distribution of children from higher-educated parents remains at a fairly stable level over time, while children from lower- and medium-educated parents fared worse over time.
6.1 Primary and secondary effects’ relative importance using counterfactual models
Table 1a shows the combinations of class-specific performance distributions with performance- specific transition propensities for the transition to academic tracks in secondary education. Table 1b shows the actual and counterfactual combinations for completing an academic track in secondary education, given that an academic track has been chosen. Table 1c continues with the combinations for the transition to academic tracks in post-secondary education, given that an academic track has
been completed, and Table 1d reports the combinations for completing an academic track in post- secondary education, given that an academic track has been chosen. Table 1e presents the combinations for the unconditional model of obtaining an academic degree in post-secondary education.
The tables’ rows refer to each social class’s performance distribution and the columns to each social class’s performance-specific transition probability. The diagonal from top left to down- right in each cohort reports each social class’s observed, actual transitions. For example, in Table 1a, 14.2% of the children from lower-educated parents of Cohort 1993 advanced to an academic track in secondary education, whereas 61.6% of the children from higher-educated parents did so, given the average academic performance of their social class. Now, suppose that children from lower-educated parents had the same average performance as children from higher-educated parents but kept their own group’s performance-specific transition propensities. In that case, the proportion of children who would proceed to higher secondary education would rise from 14.2% to 38.4% (down-left corner). Conversely, if they kept their performance level but had the same transition propensity as children from higher-educated parents, the proportion would rise from 14.2% to 30.0% (upper-right corner).
> Tables 1a–1e about here <
These counterfactual combinations give some insight concerning primary and secondary effects’ relative importance, according to social background differences. They suggest children from lower social classes may catch up to some extent if they exhibit either the average performance or the transition propensity of the highest social class, but they never achieve or exceed this group’s proportions.
We further estimate secondary effects’ relative importance in class differentials as proportions of log odds ratios; that is, actual log odds of a certain social class i are compared with a counterfactual case where either the performance distribution or the transition probability of social class i is replaced by that of social class j (see Jackson et al. 2007:220f.). Tables 2a and 2b display secondary effects’ relative importance at the transition to academic tracks in secondary and post- secondary education as a percent of log odds ratios for each cohort. Regarding entering the highest tracks at both transitions, Table 2a shows that secondary effects declined over time, from 45% to 41% at the first transition and from 51% to 45% at the second transition. Note that secondary effects’ relative importance is greater for the transition to academic tracks in post-secondary education than for the transition to academic tracks in secondary education.
At each transition, the larger differences can be found between children from higher- and medium-educated parents, and between children from higher- and lower-educated parents, compared with differences between children from medium- and lower-educated parents. Secondary effects’
total contribution thereby increases a minor amount. For Cohort 1993, it starts with 41% at the secondary education entry, rises to 45% at completing secondary education, stays at this level when entering post-secondary education, and increases again when completing this level (55%). This shows that social background’s effect is cumulative, and there is no possibility for remediation later in the career. The only exception is for Cohort 1977, which shows a higher percentage at the point of completing the secondary track (54%) than for choosing a post-secondary educational academic track (51%).
Secondary effects’ overall importance, as shown in the unconditional model, is nearly the same as in the conditional model for completing post-secondary education. This illustrates there are no major alternative pathways in the education system that children from lower-educated parents can pursue to remediate or otherwise improve on their earlier educational choices.
With regard to our hypotheses, the counterfactual model’s findings suggest the following: The first hypothesis can be confirmed, as primary effects are more important than secondary effects at the first transition to higher secondary education. The second hypothesis, however, is only confirmed for the oldest cohort, with secondary effects outweighing primary effects. For the two youngest cohorts, however, the primary effects remain dominant, even at this career stage.
Furthermore, the decrease in secondary effects’ relative importance over time, both at the first transition to secondary education and at the transition to post-secondary education, confirm the third hypothesis and accord with modernization theory, suggesting that these transitions become more meritocratic. In addition, when completing secondary education, we observe secondary effects decreasing, which partly confirms Hypothesis 4. However, at the last stage, completing post- secondary education, as well as in the unconditional model, secondary effects are relatively more important than primary effects, with a stable share over time. This finding refutes modernization theory’s assumptions and is more in agreement with those of reproduction theory. In line with the maximally maintained inequality theory (MMI), a strong form of reproduction theory (Raftery and Hout 1993), the results can be interpreted in the following way: Although educational expansion improved less-privileged children’s educational opportunities of over time, more-privileged children’s demand for higher post-secondary education has not yet been saturated. The overall picture shows that average scholastic performance is highly correlated with social background, while social background’s direct effects on final educational attainment are stable over time.
> Tables 2a and 2b about here <
6.2 Primary and secondary effects’ relative importance using linear regression models (OLS)
Tables 3a–3d show the results for attending and completing school career stages for the three school cohorts. The unstandardized regression coefficients are statistically significant at 1 percent level.
Each Model 1 in Tables 3a–3d reports social background’s total effect on educational attainment at each stage. The coefficients indicate an increasing effect of social background over time. Within a school career, social background’s total effects are higher at the completion point than at the entry of secondary and post-secondary levels.
Model 2 in Tables 3a–3d shows the cumulative secondary effects when controlled for school performance. At each stage, these effects are rather stable over time. Within a cohort, however, these effects almost double over the educational career, from some 0.050 for the transition to secondary education to some 0.115 for completing the post-secondary education track. The increase of secondary effects at later transitions is flawed, since Model 2 does not control for previous decisions on track placement or track completion. Model 3 includes previous tracks and shows direct secondary effects at completing secondary education and entering post-secondary education decreased, while they increased at completing post-secondary education. In sum, secondary effects at the first transition are fairly high and stable over time, but they decrease in magnitude at subsequent transitions, mediated by previous school decisions. Model 3’s explanatory power has clearly improved by 30 to 40 percentage points, compared with Model 2’s; that is, much of the variance is explained by constraints of previous decisions.
> Tables 3a–3e about here <
Table 3e shows the results for the unconditional model. The coefficients are higher in magnitude than in the conditional model. However, their direction over time does not differ substantially from those of the conditional model. The unconditional model confirms a rather stable secondary effects’ impact over time, while the results for the total effect of social stratification indicate an increase over time in all models.
Table 4 shows primary and cumulative secondary effects’ relative importance, according to the OLS models. Secondary effects’ relative impact is rather strong at the beginning of secondary education but diminishes over time, from 45% to 40%. As a result, the cumulative secondary effects at completing the post-secondary education track, both in the conditional and unconditional models, also diminish over time, from 62% to 57% and from 59% to 56%, respectively. Throughout the
school career, cumulative secondary effects increase over its different stages, by some 16 percentage points. This illustrates that even at the school career’s later stages, secondary effects remain important and have a cumulative effect outweighing primary effects.
Similar to the counterfactual model’s results, the OLS models’ findings support both Hypotheses 1 and 3: Primary effects are more important at the first transition (H1), and they become more important over time at both transitions (H3). In contrast to the counterfactual model, we also find clear support for the other two hypotheses. The secondary effects are more important at the second transition (H2), while completing each stage becomes more meritocratic over time (H4).
> Table 4 about here <
6.3 Primary and secondary effects’ relative importance using structural equation models (LISREL) In a first step, we performed two analyses on the transition and attainment processes, controlling for measurement error only in school performance tests. Figure 4a shows the path model with the first track in secondary education as the dependent variable, and Figure 4b with the final education degree as the dependent variable.13 For illustration purposes, we present the results for the two models for Cohort 1993.
> Figures 4a and 4b about here <
All models show an acceptable fit. The root mean square of error approximation (RMSEA) is lower than 0.05 for all models, which is an indication of a good model fit (Browne and Cudeck 1993), while the chi-square is not significant for the models of Cohorts 1989 and 1993. This indicates a good fit between data and models.14 The LISREL results obtained for the first transition (Figure 4a) indeed reveal clear differences, compared with results obtained using the former methods. Primary effects are much more important than secondary effects if one accounts for measurement error in the performance tests: 76% of the social background effect is due to performance differences, compared with 24%, which is related to differential choices. Over time, the
13 We also performed an additional analysis in which we include both first choice in secondary education and final obtained degree, but this does not yield substantially different results. Note that a conditional model over all transitions is not applicable here. The high correlations between the educational career’s four stages impair a robust simultaneous estimation in LISREL.
14 The only exception is the chi-square for Cohort 1977, which is significantly different from zero (First choice: chi- square = 13.19, df = 1, p < 0.01; Final degree: chi-square = 24.70, df = 1, p < 0.01). This indicates the assumption that the model of Cohort 1977 is not significantly different from the one in the population does not hold. We have decided not to change the model for this cohort, however, as it fits the data of the other two cohorts quite well, and it is theoretically sound and straightforward. Moreover, the RMSEA indicates a good model fit. We will exercise caution, though, with interpreting results for Cohort1977.
relative importance of secondary effects at the first transition has slightly declined from 28% to 24%
(see Table 5). Even if we omit the results of Cohort 1977, this decrease is clearly visible.
Figure 4b shows that choice-related differences continue to have an effect. The cumulative secondary effects on the final obtained degree amount to 38%. Over time, the relative importance of secondary effects on the final obtained degree also seems to decrease, although this holds when we compare only the oldest cohort with the two younger cohorts. Bearing in mind the model fit for Cohort 1977 is not optimal, we can at least state secondary effects remained stable over the two last cohorts.
> Figures 4c and 4d about here <
In a second step, we also control for measurement error in the latent variable social background by using both father’s and mother’s educational levels as separate indicators. Figure 4c shows the path model for Cohort 1993 when the first transition to secondary education is made, while Figure 4d, the path model for Cohort 1993 on the final education degree. Again, we have good model fits for all our models of Cohorts 1989 and 1993.15
The first observation we make when comparing the parameter estimates in Figures 4c and 4d with those of Figures 4a and 4b is that social background’s effects clearly increase. The effect on cognitive skills increases from 1.95 to 3.26, the effect on first choice increases from 0.03 to 0.06, and the effect on final degree increases from 0.12 to 0.24. This means the previous models seriously underestimated social background’s total effects—both primary and secondary.
Compared with Figure 4a, the path model of Figure 4c indicates secondary effects’ relative importance is somewhat higher, 27% at the first transition. Secondary effects’ higher relative magnitude is also displayed for the other two cohorts at the first transition (see Table 5), while they show a more apparent decrease from 37% to 27% over time (or from 31% to 27% if we omit Cohort 1977).
Similar to Figure 4b, Figure 4d shows that secondary effects increase again when we examine the final educational degree. However, the relative importance of secondary effects exceeds that of Figure 4b and amounts to 45%, lower than the estimations of both the counterfactual and linear regression models. Regarding changes over time, the findings confirm a decrease when Cohort 1977 is taken into account or at least a stable pattern in secondary effects’ relative importance when considering only the two younger cohorts (see Table 5).
15 The exception is Cohort 1977, with a chi-square for the first transition of 19.06, df = 3, p < 0.01; and for the final degree with a chi-square of 27.76, df = 3, p < 0.01.
The LISREL results strongly confirm our first hypothesis, showing that primary effects are much more important than secondary effects at the first transition. At the stage of highest educational degree attained, while secondary effects’ importance rises, primary effects remain relatively more important. Although this is not a direct test of the second hypothesis, it surely does not indicate that secondary effects at later stages are strong enough to offset the primary effects at the first transition, as they did in the counterfactual and linear regression models. Comparing the results over time (see Table 5), we find support for the modernization hypotheses, indicating more meritocratic selection for the first transition. For the final educational attainment, results indicate more meritocratic selection only if we examine the difference between the oldest and the two youngest cohorts. As indicated above, however, the results for Cohort 1977 should be interpreted with caution. We therefore conclude the modernization hypothesis is not confirmed for the later stages.
That secondary effects’ importance rises cumulatively at the final educational stage weakens modernization theory and the expectation of a clear performance-related process. Secondary effects may no longer dominate, after controlling for measurement error, but their relatively high share at the last stage indicates parents’ direct impact on educational attainment at least does not decline as the child ages. This is in accordance with Boudon’s assumption on economic constraints and related preferences and risks.16
Moreover, the path model in Figure 4d indicates that social background’s “true” effect on cognitive skills is substantially higher than estimated in the previous LISREL model, without correcting for measurement error in social background. It suggests social background’s overall effect is underestimated in linear regression models, and that including father’s and mother’s occupational status may yield even stronger social background effects on a child’s educational performance and attainment.
6.4 Comparing the findings from the three statistical methods
Table 5 summarizes the proportions of secondary effects’ relative importance obtained by the different statistical methods. If we compare the OLS results with the results from the counterfactual model, we find much consistency in the proportions. At the first transition to secondary education (t1), the OLS results reproduce the same or similar average values as in the counterfactual analysis.
In addition, for the unconditional model with the final degree, the results do not differ significantly, with a slight exception for Cohort 1977, which shows a higher share of secondary effects in the OLS
16 Boudon (1974) argues that secondary effects have an equal share at each transition. They thus increase cumulatively until the last educational stage.
model, compared with the counterfactual model. Secondary effects amount to some 55% of social background’s total effect if one uses linear regression or counterfactual models. The main difference between the two models concerns secondary effects’ importance when entering post-secondary education. At this point, the OLS model consistently produces higher estimates than the counterfactual model does.
The largest differences are found—not unexpectedly—between the LISREL model and the two other models. The results clearly indicate two conclusions. One is that social background’s overall effects are underestimated if one does not properly control for measurement error in the social background indicators. The other conclusion is secondary effects’ relative importance is overestimated if one does not properly control for measurement error in the tests assessing cognitive skills. For the two youngest cohorts, the difference between the counterfactual model and the OLS model amounts to about 10 percentage points for both the first transition and the final obtained degree. Using structural equation models, secondary effects’ relative importance declines to some 45%. Furthermore, the decrease over time in secondary effects at the first transition appears to be stronger in the structural equation model than in the two other models (10% compared with 5%).
The findings of all statistical methods show secondary effects’ relative importance at the first transition has decreased over time. For the final obtained degree, most of the models display a high stability over time, with the exception of Cohort 1977 in the LISREL model, which we should treat with some caution. This would mean that although secondary effects have decreased at the first transition, the total cumulative effect demonstrates considerable stability over time. This is partly caused by secondary effects’ increasing at later stages. The OLS models show in the last stage, at the successful completion of post-secondary education, direct secondary effects of social stratification exhibiting the opposite trend, and increasing over time.
> Table 5 about here <
7 Conclusion
This paper has examined the relative importance of primary and secondary effects of social stratification at different stages during the educational career using data from three school cohorts in the Netherlands. An important analytical aspect was the use of three different statistical models to test for the findings’ robustness. In the following section, we will divide the discussion of our conclusion into two parts—substance and method.
Substantively, the findings of all our methods show a decreasing impact of secondary effects at the first transition over time. At later stages of the educational career, secondary effects’ impact is