Selection and tracking in secondary education; A cross country analysis of student performance and educational opportunities
Citation for published version (APA):
Korthals, R. A. (2013). Selection and tracking in secondary education; A cross country analysis of student performance and educational opportunities. Maastricht University, Graduate School of Business and Economics. GSBE Research Memoranda No. 054 https://doi.org/10.26481/umagsb.2013054
Document status and date:
Published: 01/01/2013
DOI:
10.26481/umagsb.2013054
Document Version:
Publisher's PDF, also known as Version of record
Please check the document version of this publication:
• A submitted manuscript is the version of the article upon submission and before peer-review. There can be important differences between the submitted version and the official published version of record.
People interested in the research are advised to contact the author for the final version of the publication, or visit the DOI to the publisher's website.
• The final author version and the galley proof are versions of the publication after peer review.
• The final published version features the final layout of the paper including the volume, issue and page numbers.
Link to publication
General rights
Copyright and moral rights for the publications made accessible in the public portal are retained by the authors and/or other copyright owners and it is a condition of accessing publications that users recognise and abide by the legal requirements associated with these rights.
• Users may download and print one copy of any publication from the public portal for the purpose of private study or research.
• You may not further distribute the material or use it for any profit-making activity or commercial gain
• You may freely distribute the URL identifying the publication in the public portal.
If the publication is distributed under the terms of Article 25fa of the Dutch Copyright Act, indicated by the “Taverne” license above, please follow below link for the End User Agreement:
www.umlib.nl/taverne-license
Take down policy
If you believe that this document breaches copyright please contact us at:
repository@maastrichtuniversity.nl
providing details and we will investigate your claim.
Download date: 22 Dec. 2021
Selection and tracking in secondary education:
A cross country analysis of student performance and educational opportunities
Roxanne Korthals
Research Centre for Education and the Labour Market | ROA
Research Centre for Education and the Labour Market Maastricht University
P.O. Box 616, 6200 MD Maastricht, The Netherlands T +31 43 3883647 F +31 43 3884914
secretary-roa-sbe@maastrichtuniversity.nl www.roa.nl
ROA-RM-2012/14
ROA Research Memorandum
Selection and tracking in secondary education:
A cross country analysis of student performance and educational opportunities
Roxanne Korthals
ROA-RM-2012/14
*Updated version:
September 2013
* The ROA Research Memorandum Series was created in order to make research results available for discussion, before those results are submitted for publication in journals.
Research Centre for Education and the Labour Market Maastricht University
P.O. Box 616, 6200 MD Maastricht, The Netherlands T +31 43 3883647 F +31 43 3884914
secretary-roa-sbe@maastrichtuniversity.nl www.roa.nl
Abstract
Selection and tracking in secondary education: A cross country analysis of student performance and educational opportunities**
This paper examines the effect of tracking in secondary school on student performance and educational opportunities, taking into account whether prior performance is considered when students are selected in the different tracks. The sample consists of data from the Programme for International Student Assessment 2009 for around 185,000 students in 31 comparable countries. The results are controlled for student- and school-level confounders. The results indicate that when tracking is implemented, it does not have a direct relation with performance. However, system and school interactions reveal that a highly differentiated system is best for student performance when schools always take into account prior performance to decide on student acceptance. In systems with a few tracks, admission rules have less of an impact and tracking is only mildly associated with performance. Equality of opportunity is best provided for in a system with many tracks, especially when schools always consider entrance requirements.
However, caution is warranted in interpreting these results since selection issues could play a role.
JEL classification: I20, I21, I24
Keywords: economics of education, tracking, equality of opportunitie, education, PISA Roxanne Korthals
ROA
Maastricht University P.O. Box 616
6200 MD Maastricht The Netherlands
r.korthals@maastrichtuniversity.nl
** I would like to thank Jaap Dronkers for his valuable comments and fresh perspective. Furthermore, I would like to thank Rolf van der Velden, Hans Heijke, Olivier Marie and Andreas Ammermüller for a number of useful comments and suggestions. I would also like to thank the seminar participants of the CPB Netherlands Bureau for Economic Policy Analysis, the Journées Louis-André Gérard-Varet 2012, ESPE 2012, the Maastricht University School of Business and Economics education lunch and the NWO-PROO discussion group for fruitful discussions which improved the paper.
1 Introduction
Separating secondary school students into different educational tracks based on ability is a common practice in the Western world. Some countries have national policies regarding tracking, while others let schools decide whether and how to implement informal tracking. This paper studies the effect of nationwide tracking policies on academic performance and inequality.
While there are numerous papers on the effects of tracking, most (e.g., Hanushek and Woessmann, 2006 and Ariga and Brunello, 2007) do not consider the school level, while schools could potentially have a strong influence on the implementation of education policies. In the case of tracking, however, one characteristic seems particularly important: whether schools track students based on prior performance.
When the implementation of tracking at the school level is not in line with the idea of grouping students of different abilities (e.g., tracking by socioeconomic background, tracking is not implemented efficiently and the effect of tracking may not be accurately estimated. In other words, students and school charac- teristics, such as entry requirements, interact with system characteristics, such as tracking. It is therefore not straightforward to determine the effect of tracking on student performance.
A related issue is whether tracking changes educational opportunities, that is, whether it alters the effect of family background (FB) on performance. Tracking may be beneficial for certain student groups but may affect others negatively.
Determining the association of tracking with student achievement is important for two reasons: First, ba- sic economic theory predicts that institutions, which influence incentives, have large effects on outcomes.
Thus, tracking has a large potential impact on achievement and is therefore important in studying student performance. The second reason is that all students who receive formal education do so within a given education system. To fully understand the mechanisms behind the effects of FB and school characteristics on performance, it is important to consider the effect of education system characteristics on performance and possible interactions between school and system characteristics.
The results presented in this paper indicate, consistent with the literature, that tracking does not have a significant direct relation with performance. However, system and school interactions reveal that in a system with four or five tracks, it is best for student performance that schools always consider prior performance when selecting students. For systems with only two or three tracks, the use of entry re- quirements does not alter the association between tracking and performance. Thus, tracking only has a significant relation with performance when school characteristics are taken into account. This finding indicates that it is important to consider school characteristics when analysing education systems.
Equality of opportunity is best provided by a system with four or five tracks, especially when schools always consider entrance requirements. In these systems, tracking mitigates the positive relation of FB
for higher FB students, while it seems to have no effect on the association between FB and performance for students with a lower FB. Due to these opposing effects, the performance differences between students with high and low FB is lowest in a more differentiated system.
However, caution is warranted in interpreting the above-mentioned results since the selection of stu- dents into schools with entrance requirements may play a role.
The structure of this paper is as follows: Section 2 reviews the tracking literature. Section 3 discusses theoretical insights in tracking and how schools can affect tracking. Section 4 describes the data used in the analysis, while Section 5 lays out the empirical strategy. Sections 6 and 7 present the results and discuss possible selection problems, respectively. Section 8 discusses some robustness checks. Finally, the last section concludes the paper.
2 Literature
Although the separation of students into different tracks in secondary school has a bad reputation, the literature shows conflicting results on the effect of tracking on performance in secondary school. This pa- per most closely relates to the work of Hanushek and Woessmann (2006), Fuchs and Woessmann (2007), Ariga and Brunello (2007), Pekkarinen (2008), Pekkarinen, Uusitalo, and Kerr (2009), Horn (2009), and van Elk, van der Steeg, and Webbink (2011).1
Hanushek and Woessmann (2006) use a difference-in-differences technique to study the effects of the timing of tracking. They find that early tracking increases distributional inequality and reduces mean performance. Thus, ultimately, nobody gains from tracking: Students in the lower percentiles of educa- tional achievement do lose more than those in the high percentiles relative to students in non-tracking countries, but high-achievement students are also disadvantaged by early tracking.
Fuchs and Woessmann (2007) look at the relation between a number of institutional characteristics and student performance, taking into account school variables. The authors include the age of selection in their robustness checks but find no significant relation between age at first selection and performance.
Ariga and Brunello (2007) argue that the effects of tracking have not fully materialised for youngsters yet, especially in countries that start tracking when students are older. The authors use cross-country differences in tracking length, using variation due to age, curriculum differences, and drop outs, as well as reasons to drop out, as instrumental variables. They find a positive and significant local average treatment effect of time spent tracked on test scores for individuals between 16 years and their mid-20s.
1Instead of focusing on formal tracking measured at the country level, studies often focus on informally grouping students into different classes within tracks, measured at the school level. This ’ability grouping’, or ’streaming’, however, is not the focus of this paper since its informal nature makes it more difficult to compare over multiple systems. For more on ability grouping, see, for instance, Figlio and Page (2002), Betts and Shkolnik (2005), or Duflo, Dupas, and Kremer (2011).
Pekkarinen (2008) and Pekkarinen et al. (2009) use the change of the Finnish education system from a system with multiple tracks and selection at the age of 10–11 to a system with one track and selection at the age of 15–16 as a natural experiment. The curriculum was also changed in the reform. Since not all municipalities in Finland implemented the change at the same time, both papers use differences in differences across municipalities and across time. Pekkarinen (2008) looks at the effect of this reform on educational choice but find no effect on the probability of choosing the academic track, the probability of continuing onto tertiary education, or taxable income. Pekkarinen et al. (2009) use army entrance test scores to estimate the effect of the system shift on performance and find no effect of the reform on test scores. Analysing subsections of the tests, they find that the policy shift improved performance on verbal test scores but had no effect on arithmetic or logical reasoning test scores. The authors show that the policy shift improved the test scores of mostly students with low parental education.
Horn (2009) examines the effectiveness and distributional inequality of institutional characteristics and finds that early selection is related to higher educational inequality. Both early selection and a high number of tracks in a system are related to lower effectiveness. These relations are in line with the causal effects found by Hanushek and Woessmann (2006).
Van Elk et al. (2011) use within-country variations in the age of selection into tracks to look at the performance of low-ability Dutch students. The authors control for delayed selection into tracking by instrumenting the age of selection into tracks by the regional variation in school availability. Early track- ing has a negative effect for low-ability students on secondary school completion rates when controlled for by socioeconomic status and test scores, while the inclusion of the low-ability students in the track for high-ability students, resulting in a lower-ability peer group for high-ability students, has no effect on the high-ability students’ completion rates.
In general, negative effects of tracking on performance are documented in the literature. However, these results are contradicted by certain positive effects or, most often, insignificant effects, especially when school factors are considered.
Regarding the possible trade-off between efficiency and equality due to tracking, this study is related to the work of Ammermueller (2005), Walldinger (2006), Brunello and Checchi (2007), and Schuetz, Ursprung, and Woessmann (2008). This paper defines inequality as the existence of FB influence on student performance.2 Ammermueller (2005) finds that the more tracks available to students, the higher the positive effect of FB on performance growth from primary to secondary school. Walldinger (2006) finds that in the educational opportunities are lower in early tracking countries. However, this effect
2A second type of inequality is inequality in test scores, which arises when the test score distribution widens. Hanushek and Woessmann (2006) find that early tracking has negative effects on the variance of student test scores, consistent with the results of Horn (2009).
disappears when the effect of FB in primary schools is controlled for. Thus early tracking does not decrease educational opportunities. Brunello and Checchi (2007) find that the length of tracking does not reinforce the effect of FB on later (literacy) performance and may even diminish it. However, since they measure performance for individuals aged 17 and above, any reinforcing effect of tracking may have disappeared over time. In addition, the authors find that regarding educational attainment and later earnings, tracking does decrease educational opportunities. Schuetz et al. (2008) find that the effect of FB on performance is stronger when countries track early and that these countries do not perform better, on average. In other words, there is no trade-off between efficiency and equality: Tracking affects both negatively.
In general, it seems that the FB effect is stronger in countries that track early or that have multiple tracks and thus there is less equality of opportunity. However, this reinforcing effect of tracking could be explained by a larger effect of FB in primary school in these countries or its disappearance over time.
This paper contributes to the literature as follows. First, by studying the number of tracks available to students, it examines the extent of tracking, whereby students are placed into more or less homoge- neous peer groups. Since I expect the possible effects of tracking to be strongest due to its influence on the homogeneity of classes, this tracking characteristic, as opposed to the year of first selection, is especially interesting.
Second, building on the work of Dunne (2010) and Dronkers (2010) but unlike most other studies, this paper measures tracking at the country level but also includes school-level variables. Since I use a country-level measure of tracking, I capture the effect of tracking as a formal education system charac- teristic. A consequence of including school-level variables is that part of the effect of tracking is captured by these variables Although this weakens the country-level effect of tracking, this approach provides a more accurate investigation of tracking since schools can have a large impact on student performance (see, e.g., Hoxby (2001) for the impact on peers and Fryer (2011) for the impact on teacher incentives).
Therefore the effects of school and system characteristics on performance also provide insights for com- paring the effects of school characteristics across education systems and thus across countries. By looking at schools and education systems, it is possible to analyse the relation between school policies and per- formance,given system characteristics. This method facilitates the comparison of the effect of tracking across countries.
A third, related contribution is that by including school policies, I can study whether the association of tracking with performance changes when school policies intervene with system characteristics, in other words, when tracking is not effectively implemented. I show that system characteristics such as tracking cannot be considered separately from school entrance selection practices. The omission of school practices in previous studies may explain their inconclusive results obtained. This paper tries to bridge this gap.
3 Tracking
In a sense, tracking is a form of imposing peer homogeneity on students. Tracking separates students into groups based primarily on ability and thus each track consists of a more or less homogeneous student population, depending on the number of tracks available. However, the effect of imposing peer homo- geneity is not theoretically straightforward. First, by removing the better-performing students from the lower tracks, the mean performance of the lower tracks decreases and the resulting lower level of peer achievement can harm the performance of the lower-ability students. In contrast, the performance of the high-ability students, who are now surrounded by more high-ability peers, improves with positive spillovers. If peer effects work through mean performance, as described above, I would expect to find no country effect of tracking since the positive and negative peer effects on performance cancel each other out. Tracking can then be seen as a zero sum game, although it may alter the distribution of performance.
On the other hand, when peer effects are non-linear, tracking can have nationwide effects. The theoretical models of non-linear peer effects support either positive or negative effects of tracking.3 For instance, when especially high-ability students benefit from high-ability peers, tracking has a positive effect; when especially low-ability students benefit from high-ability peers, tracking has a negative effect.
Second, performance homogeneity in tracks can be good for both high- and low-ability students when teachers adjust their teaching to the average performance of the class. In highly differentiated systems (i.e., systems with a large number of tracks), the top and bottom pupils are closer to the average and can thus benefit from peer homogeneity when it allows them to learn more from the teacher.
In addition to imposing peer homogeneity on students, tracking subjects students to specialised cur- ricula, which means that students in different tracks are taught different things at different levels of difficulty. As long as the specialised curricula are optimally designed for the average characteristics of the students in the track, they should increase performance.4
Overall, I would expect a positive effect of tracking due to improved teaching strategies and adjusted curricula. The effect of tracking due to more homogeneous peer groups is theoretically uncertain; how- ever, the above arguments assume that the tracking is implemented efficiently. The inadequate allocation of students to tracks, that is, not based on ability or with selection taking place before ability can be observed, can lead to lower performance Dustmann (2004) shows that parental background is a strong predictor of track choice and that there is strong intergenerational immobility in track choice. When par- ents are free to send their child to any of the available tracks, they may choose the track they attended and/or the track they are familiar with. When this happens, however, tracks are no longer homogeneous in ability. Thus I would expect that schools using an objective measure to select students would improve
3For an overview of these models, see Sacerdote (2011).
4Whether specialised curricula increase the minimum level of general knowledge society expects all students to have is unclear. Thus there are no focused theoretical expectations on the effect of specialised curricula on performance when performance is measured by comparable international test scores in reading, mathematics, and science.
homogeneity in tracks and thus the efficiency of tracking.
Theoretically, the selection of students into multiple tracks has a positive effect on performance, dis- regarding uncertain peer effects. This positive effect is expected to be strongest in systems with more tracks since the classes are then even more homogeneous and the curricula and teaching are even more within reach for all students than in systems with fewer tracks. However, if tracking is not implemented efficiently (i.e., not based on observed ability), this positive effect cannot (fully) manifest itself or tracking can even have a negative effect. Depending on the cause of the inefficient student allocation, tracking can increase the effect of FB and thus decrease equality of opportunity.
3.1 Tracking and schools
School selection of students into different tracks can be done efficiently if based primarily on performance (i.e., ability and motivation). The fact that selection by schools can be efficient or inefficient reveals two potential problems with the selection process: First, when students are not selected based only on observed ability, they can be assigned to the wrong tracks. Second, since ability is difficult to observe, not all students are correctly classified. The first problem can be mitigated by ensuring that the selection of students is always based primarily on observed ability. A proxy for ability can be prior performance and/or the previous (primary school) teacher’s opinion of the student’s ability. Test scores and the teacher’s assessment of the student are the best available but still imperfect measures of student ability.
Naturally, I do not assume when schools use test scores and teacher assessments that parents have no influence on school choice or performance. Parents always influence a child’s ability, directly through genes and/or indirectly through the environment they create for their children.5 However, I assume that as long as objective ability measures limit non-ability–related parental influence on track choice, tracking efficiency in improved.
The implementation of tracking is most efficient when schools use objective student entrance require- ments. Schools placing students in different tracks without an awareness of their abilities or basing their selection on non-academic criteria can severely limit the possible positive effects of tracking.6
5This environment created by parents includes choices made earlier in the child’s life, such as those on pre-school attainment and in primary school.
6The analogue of tracking in schools is ability grouping, where schools can groups students based on ability within classes or tracks for some or all subjects. This informal tracking allows schools to differentiate between students with different abilities. Especially in a comprehensive system, ability grouping is often used to prepare certain students for tertiary education. However, since ability grouping is not a formal part of the education system, the manner in which students are grouped differs across schools. These differences are often unobservable in ability grouping measures, which complicates the analysis of the effects of ability grouping. Since ability grouping may have an influence, this study includes it as a control variable; however, since ability grouping is subject to differences in interpretation, it is not part of the main discussion.
3.2 Tracking and equality of opportunity
FB combined with tracking can influence student performance in a number of ways. First, as mentioned above, when ability is not perfectly observable or ability measures are not consulted by schools, parents may have a large influence on a child’s track placement. High FB students are then more likely to be placed in the higher tracks and being in the higher tracks can increase student performance, irrespective of ability, since students are exposed to more demanding curricula. A comprehensive education system could then be expected to lessen the impact of FB on student performance since there is no track choice to be selected into. However, if selection into schools takes place in a comprehensive system (e.g., when parents move to neighbourhoods with good schools or send their children to private schools), thereby grouping together students with high FB, the effect of FB can remain strong.
Second, peer effects may increase or decrease the effect of FB on student performance. For instance, being surrounded by high-ability or high FB peers can compensate for a student’s lower FB when there is a spillover effect of positive FB across students. In a tracked system, such circumstances would then increase the positive FB effect on student performance. Since FB is positively correlated to performance, this increased effect would be positive for students in the higher tracks, who are more often surrounded by high FB students, and negative for low-ability students, who are more often surrounded by low FB students. In a comprehensive system where all students from different socioeconomic backgrounds and ability levels are grouped together, there is less chance of being surrounded by only high or low FB peers and thus the beneficial or negative effects of peers’ FB are mitigated.7
4 Data
The student- and school-level data used in this paper are from the 2009 wave of the Programme for International Student Assessment (PISA 2009), executed by the Organisation for Economic Co-operation and Development (OECD). These data include internationally comparable test scores in reading, math- ematics, and science and information on students FB and schools. The country-level data are from the OECD and the World Bank.
The first wave of PISA was presented in 2000 and, since then, every three years a representative sample from all participating countries is subjected to tests on reading, mathematics, and science. The test results are standardised to a mean of 500 and a standard deviation of 100 for the OECD countries. In addition to the tests, the students and school principals (and in some countries also the parents) are surveyed. A total of 34 OECD countries and 41 partner countries participated in PISA 2009. Since these countries are very diverse in their economic development, this paper uses a selection of comparable countries to limit country heterogeneity that may influence the results. Of the 75 countries in PISA 2009, this study covers 31. All 31 countries have a gross domestic product (GDP) per capita above the
7The peer effect of FB may still exist to a lesser extent due to spatial segregation, whereby high and low FB families live in separate areas (see also the argument above).
minimum of the OECD (i.e., Turkey, with $11,655.23) and available data on tracking.8
A representative sample from each participating country is obtained by the OECD in two stages: First, schools are selected and, then, students of target age are selected within these schools. The target age is set to a range of 15 years and three months to 16 years and two months (OECD, 2010). Since not all selected schools and students were willing to participate and some schools and students were oversampled to obtain extra information on these groups, the OECD provides weights to ensure sample representation.
The student sample in this analysis consists of all native students in (pre-)vocational or general education who were in schools where more than five students participated in PISA 2009.9 This amounts to 187,768 students in 7,489 schools in 31 countries.10
4.1 Tracking and selection by schools
This paper defines tracking as the separation of students into tracks that differ in ability levels and curricula. The measure of the extent of tracking is the ’number of school types or distinct educational programmes available to 15-year-olds’, taken from OECD (2007).11 Table 1 shows the number of tracks for the sample of countries. This measure of tracking is different from those used in other papers. For instance, Fuchs and Woessmann (2007) and van Elk et al. (2011) use the age at which a student is first selected into a track as a measure of tracking, while Hanushek and Woessmann (2006) and Schuetz et al.
(2008) divide countries into early versus late trackers. The advantage of using the number of tracks available to students is that it better captures the possible effects due to the degree of class homogeneity.
This consequence of tracking is expected to have the largest effect on performance. Its disadvantage, however,is that it does not take into account the amount of time students spend in the tracks. Section 8.2 addresses this issue. However, the correlation between the age of first selection and the number of tracks in a system is very high, around -0.80 among the countries in this analysis. These results could thus be extrapolated to age of first selection.
Efficient implementation of tracking is proxied by an index of academic school selectivity. This index is based on a PISA 2009 question for school principals on how often consideration was given to a student’s record of academic performance (including placements tests) and to feeder school recommendations in admitting the student to the school. Schools are divided into three categories: schools where neither of the two factors is considered, schools where at least one of these factors is sometimes used to decide ac-
8Countries such as Australia, Canada, France, and the United Kingdom, are not included since these have missing country-level data or too much missing school-level data. I could have included Mexico but since many of its school variables have very different distributions from those of the other countries, I excluded it.
9This paper includes only native students because previous literature has shown that native and migrant students react differently to system characteristics (e.g., Dronkers, van der Velden, and Dunne, 2012.
10The 31 countries included in this analysis together tested 214,302 students. Of those 214,302, 25,404 individuals were first- or second-generation immigrants, 1,046 were students in schools where fewer than five students participated in PISA 2009, and 84 students in Luxembourg were in modular education. Excluding these students in this order leads to a sample of 187,768 individuals in 7,489 schools in 31 countries.
11This variable is given in table 5.2 of OECD (2007).
ceptance, and schools where at least one of the two factors is always considered. Table 1 gives an overview of school policies with respect to entrance requirements per country. Countries differ substantially on the percentage of schools that use entry requirements, from 79.6% of students in schools in Spain that never use entrance requirements to 93.5% that always use them in Croatia. The type of school that has entry requirements also differs across countries: for instance, in the Czech Republic and Hungary schools that select are often upper secondary schools, while in Austria and Poland it are mostly schools that students with a high FB attend. Overall, no large correlations exists between entry requirements and school characteristics. Appendix A provides more information on the type of school that has entrance requirements per country.
As can be seen from Table 1, in almost every country there are schools in all three categories, that is, schools that never, sometimes, and always abide by the admission rules. Thus, even in systems with a high number of tracks, some schools do not use prior academic achievement or teacher recommendations to decide school admittance. In the seven countries with four tracks, only 55% of the students go to schools that always consider prior performance; in the two countries with five tracks, 18% of students go to schools that never use entry requirements. Maybe more surprising, even in a comprehensive system, some schools consider (either sometimes or always) entrance requirements for accepting students: In the 10 countries with only one track, 45% of students had to supply information on prior academic perfor- mance.
Given the observable characteristics, there seems to be no reason why school policies deviate from implied nationwide system characteristics, that is, why some schools in comprehensive systems select students and why some schools in highly differentiated systems do not. This lack of explanation is unsatisfactory and this paper regards this deviation as a proxy for the inefficient implementation of a nationwide education policy. Section 7 returns to this topic.
[Table 1 about here.]
4.2 Control variables
Student variables are collected through student surveys. The study’s control variables are gender, age, a dummy equal to one if the student is in (pre-)vocational education and zero if in general education, a dummy equal to one if the student is in upper secondary school and zero if in lower secondary educa- tion12, and FB (. FB is captured by an index that describes the student’s economic, social, and cultural status and consists of the parents’ highest occupational status, their highest educational level, and home possessions.13, 14
12Lower and upper secondary education is based upon International Standard Classification of Education (ISCED) levels.
The ISCED levels provide internationally comparable standards for comparing education levels.
13Home possessions comprises family wealth possessions, cultural possessions, home educational resources, and the number of books in the home.
14The preferred measure of FB is family income. Unfortunately, family income is not available from PISA; however, the student’s economic, social, and cultural status is a widely used proxy for FB.
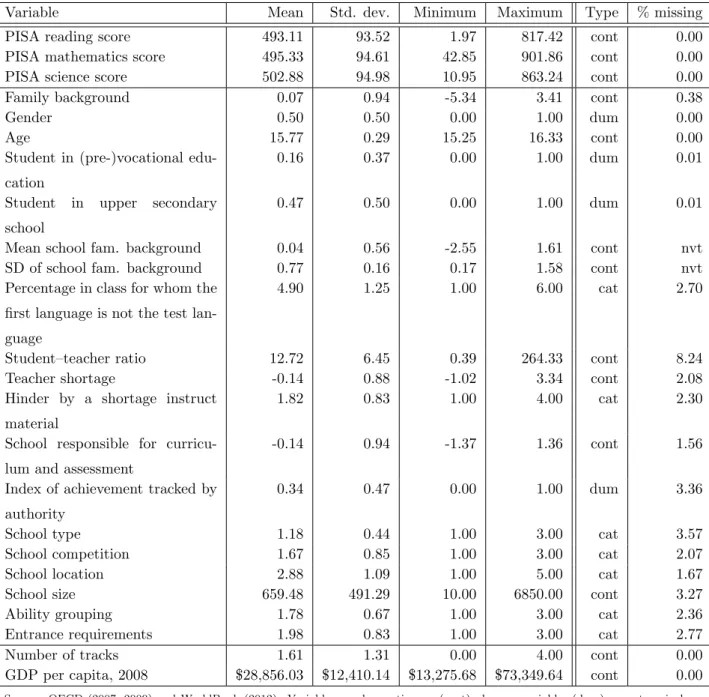
The school-level variables are collected through a survey completed by the school principal and can be sorted into three categories: school composition, school inputs, and other school characteristics.15 School composition is captured by the school average and standard deviation of the FB of all the stu- dents per school and by the percentage of them who speak a language other than the test language at home.16 School inputs are captured by the student–teacher ratio, an index of possible teacher shortages, dummy variables indicating whether the school is hindered by a shortage in instruction material, and an index indicating whether the school is responsible for the curriculum and assessment. The other school variables indicate whether school achievement is tracked by an educational authority; whether the school is a public, private government-dependent, or private government-independent school; whether the school has to compete with other schools for students; the school location; school size; and whether the school uses ability grouping. I also control for the GDP per capita, which is for 2008 from the World Bank (2012).Table 2 provides descriptive statistics for all variables.
[Table 2 about here.]
5 Empirical strategy
5.1 Tracking and performance
The aim of this paper is to investigate the relation between tracking and performance, taking into account school entrance requirement policies. The education production function used in this paper is a linear function:
T estijk=β0+Studentijkβ1+Schooljkβ2+EntReqjkβ3+ #of T rackskβ4+GDP pckβ5 +ηijk (1) whereT estijk is the individual PISA test score in reading, mathematics, or science of studentiin school j in countryk,Studentijk is a matrix of student and FB variables,Schooljk is a matrix of school vari- ables,EntReqjk is a matrix containing the dummies on school entrance requirement policies,T rackingk
is a vector containing the number of tracks available to students in each country, GDP pck is a vector containing GDP per capita data, and ηijk is the error term.
Since students are nested within schools within countries, estimating equation 1 leads to downwards- biased estimates for the standard errors. By ignoring the nested data structure, it is implicitly assumed that all observations are independent from each other and thus each observation contains new information on the full set of variables. However, this is not the case. By directly estimating equation 1, the researcher
15There is discussion about whether or not including the school level is optimal in analysing student performance across countries. By including school-level variables or even only school-level variance, part of the effect of the educational system will be captured by these variables and other coefficients may also be affected. However, since this approach provides a more accurate picture of tracking, this study includes school-le vel variables. However, a two-level fixed effects model where the entrance requirements are included at the individual level delivers similar results.
16For the school average and standard deviation of the FB, all the students in the sample schools are used, both natives and immigrants.
assumes the data contain more information than they actually do and thus the standard errors are lower.
These lower standard errors lead to easy acceptance of every significance test, especially since the data contain around 185,000 observations. To obtain correct standard errors, the estimation technique should take into account the nested data structure. The analysis uses random effects to mimic as closely as possible the data collection process.17,18
Another change to equation 1 is that since I am primarily interested in the relation between track- ing and performance and the effects schools have on this, I also include a school system interaction term.
The random effects model for the education production function is then
T estijk=β0+Studentijkβ1+Schooljkβ2+EntReqjkβ3+ #of T rackskβ4+GDP pckβ5
+EntReqjk#of T racks0kβ6+uk+ujk+ηijk (2) where there is now a total of three error terms: for individuals, schools, and countries, respectively. This random effects model more accurately estimates the standard errors and thus the significance levels are a better indicator of the existence of the relations found.
5.2 Tracking and inequality
The main relation between FB and performance is included in the vector Studentijk. I can examine the relation between FB and student performance and the influence of tracking thereon by including an interaction between FB and tracking. The model used to study this relation is
T estijk=β0+Studentijkβ1+Schooljkβ2+EntReqjkβ3+ #of T rackskβ4+GDP pckβ5
+F Bijk#of T racks0kβ6+uk+ujk+ηijk (3)
5.3 Missing values
Almost all student- and school-level variables have some missing observations (see last column of Table 2).
Although most variables have at most 3% missing values, deleting all observations with missing variables would lead to a drop in observations from around 185,000 to around 130,000. To delete observations with missing values would be to implicitly assume that the missing values are missing at random, a question- able assumption. Another reason for not deleting all observations is that it leads to distorted weighting.
The sample weights assigned to all students are constructed to obtain a representative sample. However, if some students are deleted but are not randomly distributed among the groups for which the weights
17Random effects are often used for panel data sets. There random effects control for the fact that observations over time are nested within one observational unit. Here random effects are employed to take into account another form of nested data: Students are nested in schools in countries.
18The sum of the weights per country is equalised over all countries such that each country has an equal weight in the estimation. The weights are also normalised to sum up to the total number of observations. The random effects model requires weights for each data level, that is, conditional student weights and school weights to control for the two-stage sample design. The PISA data provide unconditional student weights and school weights. Conditional student weights are obtained by dividing the unconditional student weight by the school weight. All statistics and estimations are executed using weights, unless otherwise specified.
correct, the sample is no longer representative, even when weights are used. For these two reasons the missing values in the sample are replaced by group averages.
The method for replacing missing values is simple: The student variables are replaced by the aver- age value of the students in the same school, the school variables are replaced by the country average, and the country variables do not contain missing variables. To control for possible bias introduced by such a simple method for replacing missing values, imputation dummies and imputation interactions are used.19 Thus the final education production function for investigating the relation between school policies and tracking is
T estijk =β0+Studentijkβ1+Schooljkβ2+EntReqjkβ3+ #of T rackskβ4+EntReqjk#of T racks0kβ5
+Dijkβ6+Djkβ7+DijkStudent0ijkβ8+DjkSchool0jkβ9+uk+ujk+ηijk (4) whereDijkandDjkare dummies for cases where the student has missing values for student and/or school variables. Similar changes are made to equation 3.
6 Results
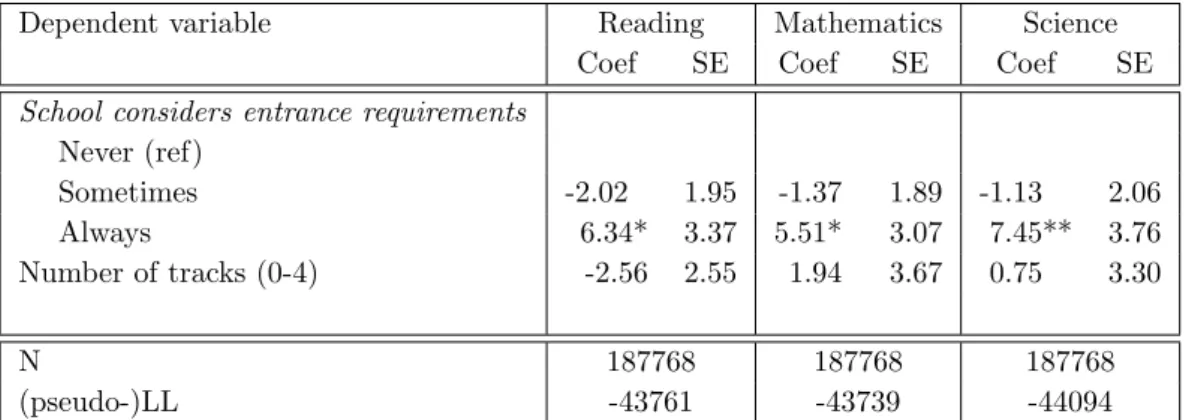
The analysis starts byinvestigating whether the number of tracks has a direct and significant relation with student performance. Since I include a wide variety of school background variables, which may capture part of the tracking effect, I do not expect a large coefficient for tracking and, indeed, do not find one. For all three test subjects, the relation between schools that sometimes use entry requirements and performance is negative, while for schools that always use entrance requirements this relation is positive (and significant). The insignificant association between the number of tracks and performance is negative for reading and positive for mathematics and science. Table 3 shows the results.
All the control variables have the expected sign. FB has a strong and positive relation with student performance. Females do better in reading and males are better in mathematics and science. Older children do somewhat better in reading and science but not in mathematics. Students in vocational edu- cation do worse than students in general education and students in upper secondary education perform better than those in lower secondary school. The school average in FB has a positive relation with student performance. The negative relation between the percentage of students with a different first language and performance only becomes significant when more than 20% of the students speak a different language at home (for mathematics and science) or more than 40% do so (for reading). Shortages in teachers and materials have a negative relation with student performance and students in private schools that do not rely on the government for financial support perform considerably worse. Finally, school size, location, and whether it uses ability grouping are also important factors. Students in larger schools or in smaller
19The results are robust to the exclusion of the imputation variable interaction terms and to the inclusion of the imputation dummies.
agglomerations perform better and students in schools that use ability grouping perform worse. The coefficients of the full models are given in Appendix B.
[Table 3 about here.]
6.1 Tracking and performance
Table 4 shows the main results from linear models (first to third columns) and non-linear models (fourth to sixth columns). These main models include the interactions between the number of tracks and school policies.20 The linear models use the number of tracks in a country as a continuous variable ranging from zero to four, while the non-linear models include the number of tracks in a country as three dummy variables: no tracks (only one track available to 15-year-olds), a few tracks (two or three tracks available), and a large number of tracks (four or five tracks). As can be seen from the first three columns, including the interaction terms results in significant relations between tracking, school policies, and student per- formance. The results for reading, mathematics and science are very similar except that for reading the main effect of the number of tracks is large and significant. For the non-linear models, in the fourth to sixth columns, only the interactions between the number of tracks and school entry requirement policies are significant when countries have a large number of tracks (four or five).
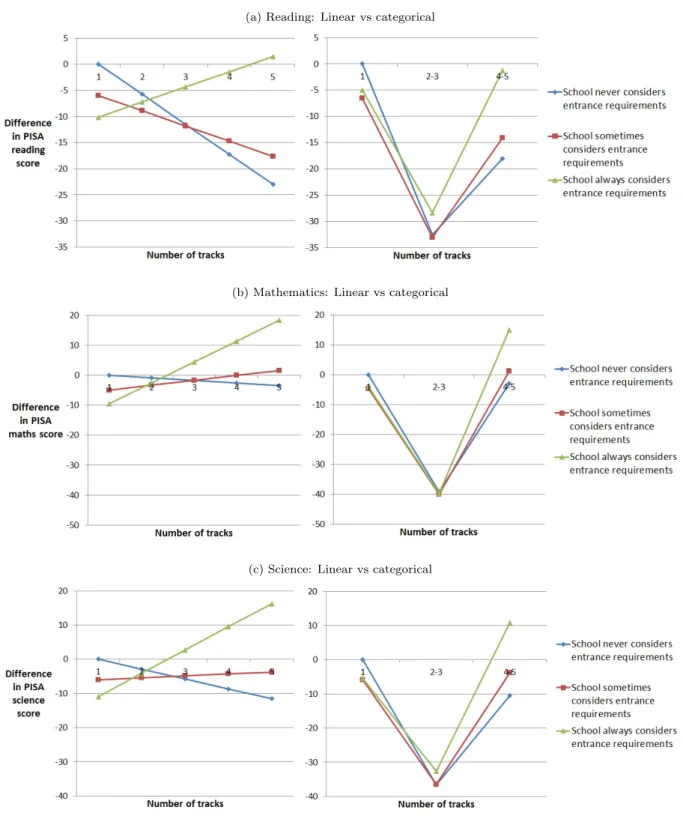
Since the models include interaction terms, the main effects no longer have the standard interpreta- tion. To simplify the interpretation of the main effects and the interactions, Figure 1 illustrates the combined relations between entrance requirements, tracking, and student performance. The figures show for each combination of number of tracks and school policy what the relation between the two and student achievement is, relative to students in a system with only one track in schools that never consider en- trance requirements. Looking first at the panels on the left, one sees the same trend for all three subjects (reading, mathematics, and science): Schools in multiple track systems do better when they consider admission rules more often, while schools in comprehensive systems perform better when they do not consider entrance requirements. When only the significant differences in the graphs are considered, it becomes clear that for two or more tracks school policies regarding entrance admission only change the results when schools always consider prior performance. The coefficients for the Never and Sometimes entry requirements are not significantly different from each other when the number of tracks is two or more.21 This result is confirmed by the graphs displaying the combined coefficients of the non-linear models, seen in the panels on the right in Figure 1. Again the combined coefficients are not significantly different across school policies when a system has only a few (two or three) tracks and two or three tracks are negatively associated with student performance. However, schools that always consider entry require- ments in a system with a higher number of tracks (four or five) perform significantly better compared to other schools.
20The control variables all have the same sign and similar coefficients as in the model without the interactions.
21Except for science, where the combined coefficients for the Never and Sometimes entry requirements are significantly different in a system with five tracks.
These results indicate that determining whether tracking is good or bad for performance is not a straight- forward process. Compensation by school policies can be quite large in terms of points on achievements tests. In a five-track system, the estimated relations show that the difference in student performance between being in a school that never considers entrance requirements and being in one that always con- siders them is equal to around 22–28 points on the PISA test, equivalent to a 1–1.5 standard deviation increase in FB.22
The finding that students in a multitrack system do better when their school considers prior performance seems to confirm the hypotheses in this paper: Tracking itself is negatively associated with student per- formance, but for schools that always consider prior performance in a system with a high number of tracks, the relation between the number of tracks and student performance is either zero or positive. The schools that have entry requirements can select the right students into the available tracks and thus in these schools tracking works most efficiently.
[Table 4 about here.]
[Figure 1 about here.]
6.2 Tracking and inequality
The results for the models of equality of opportunity are displayed in Table 5. As expected and consistent with the literature, (centred) FB has a positive and substantial relation with student performance. This effect is similar over the three PISA test subjects, reading, mathematics, and science. If we look at the interaction between FB and tracking, it can be seen that tracking mitigates the association with FB: The interaction of the number of tracks and FB is negative and highly significant. The more tracks a system has, the lower the effect of FB. The first to third columns show that in a system with five tracks the association of FB is lowered by 17.3 points in reading, 16.2 in mathematics, and 18.2 in science. Tracking thus mitigates the association with FB in systems with a high number of tracks and therefore reduces inequality of opportunity.
From Table 5 one can deduce that the association between socioeconomic status, tracking, and entry requirements on performance is different for students with different FBs. Students with low socioeco- nomic backgrounds (one standard deviation below the mean FB) benefit from a highly tracked system:
Comparing low FB students between systems with one and five tracks shows that students in a five-track system have higher scores for reading, mathematics, and science: 3.0, 20.3, and 17.0 points, respectively.
On the other hand, students of high socioeconomic background (one standard deviation above the mean) do better in a comprehensive education system: Comparing their scores in a one-track system against those in a five-track system shows that in a one-track system they obtained higher scores for reading,
22The PISA test scores are standardised so that the OECD countries have a mean of 500 points and a standard deviation of 100. The OECD standardises FB on the OECD countries. Here FB has a mean of zero and a standard deviation of 0.94, which means it is almost fully standardised and thus the interpretation of the coefficients can be translated to standard deviation increases or decreases.
mathematics, and science: 23.0, 4.0, and 10.3 points, respectively. A similar trend is seen in the non- linear models in the fourth to sixth columns. High FB students do better in a system with no tracks, while low FB students do better in a system with a large number of tracks.
[Table 5 about here.]
Finding that tracking reduces inequality is not fully consistent with the literature, which most often finds that tracking increases inequality or has no effect. To further investigate the drivers of this positive effect of tracking, I show in Table 6 the results of the same models as in the first three columns of Table 5, but now including also interactions between FB, the number of tracks, and school entrance requirement policies. Table 6 shows that the interaction between the number of tracks and FB is no longer significant;
however, the triple interactions (number of tracks, FB, and entry requirements) are. The table indicates that it is primarily the schools that always consider prior performance in systems with multiple tracks that mitigate the relation of FB with performance. Thus it is not tracking itself that diminishes the association of FB and performance but, rather, tracking combined with entry requirements. This is consistent with my expectation that when schools use entrance requirements, parents have less influence on their child’s track choice and subsequent performance.
[Table 6 about here.]
7 Sorting: Tracking and schools
The results presented above will be biased if the variation used is affected by the selection of students into schools. This may be the case when schools use the selection process to select the best students and not to allocate students into tracks. If schools use entrance requirements in this manner, then 1) these schools are the most attractive for the better students and will therefore experience a higher inflow of better-performing students and 2) these schools may change the behaviour of their upcoming student population since students may have to work harder to be allowed into these schools and may therefore also perform better in later tests.
It is therefore important to look into the characteristics of students and schools that have entry re- quirements to ensure that these students and schools are not significantly different in other aspects from students and schools that do not have entry requirements. If this is the case, student selection into these schools can influence the results presented above. A first hint that this is not fully the case in my sample is the fact that entrance requirements are not always beneficial for students: In systems with only one track, it is better to be in a school without entry requirements than to be in one with entrance requirements. Therefore, schools with admission rules do not perform better by definition. This section provides further indirect evidence of the validity of my results.
7.1 Descriptive evidence
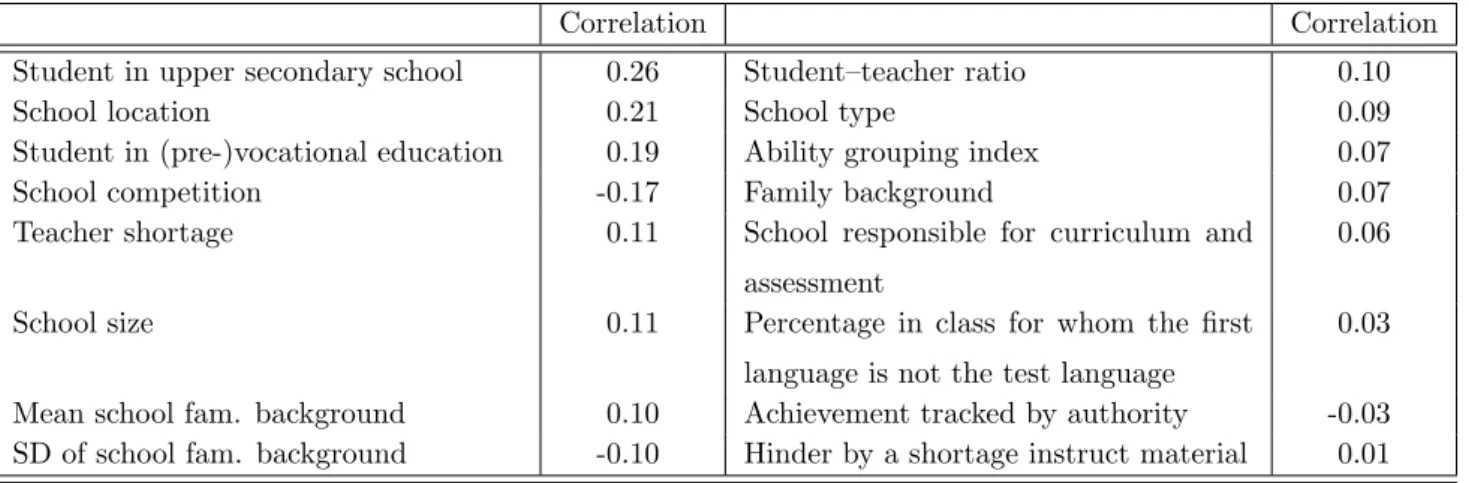
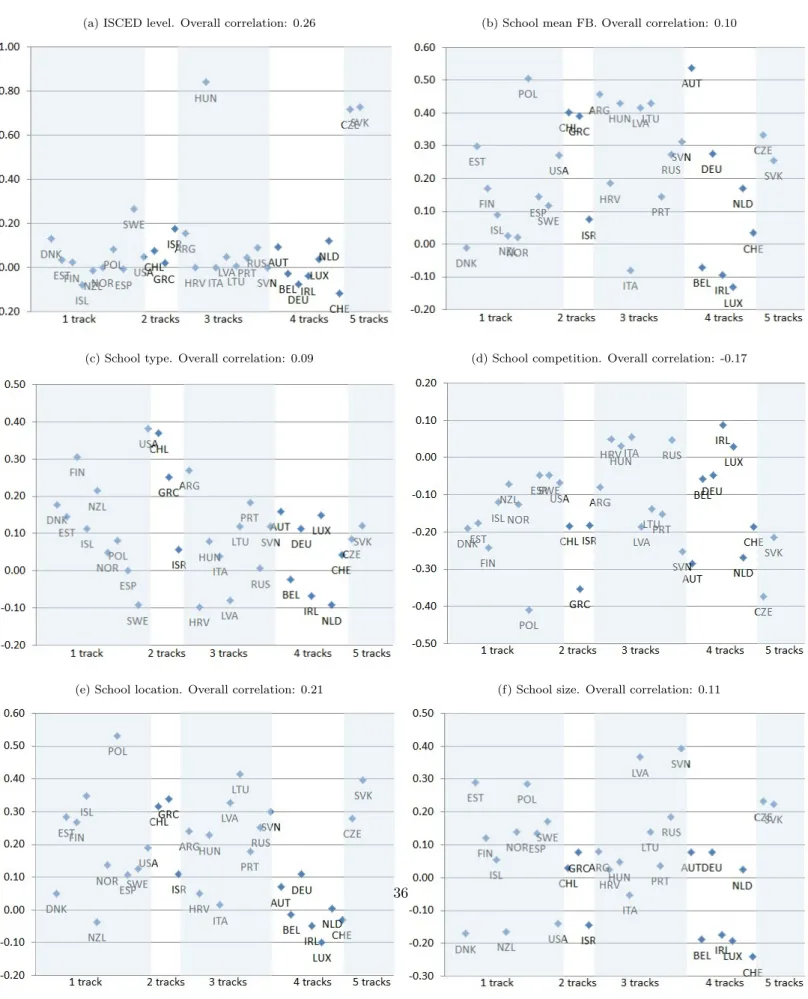
As already mentioned in section 4.1 (and further expanded on in Appendix A), in distinct countries there might be selection into schools. However, overall schools with and without entry requirements do not seem to differ much on observables. Table 7 shows the correlations between entry requirements and other factors in which students and schools can differ substantially.
The fact that some schools in comprehensive systems have entrance requirements cannot completely be explained by the (perhaps more restrictive) private schools in these systems: The correlation between entrance requirements and school type is 0.09 and excluding these schools from the sample does not change the basic results much. In addition, the correlation between student socioeconomic background and admission rules (0.07) cannot explain the pattern in entrance requirements. Thus it is not true that more selective schools necessarily have the most students from better FBs. As can be seen from Table 7, the correlations between entrance requirements and other school or student characteristics are not large and thus cross country analysis is not affected by selection.
[Table 7 about here.]
7.2 Macro analyses
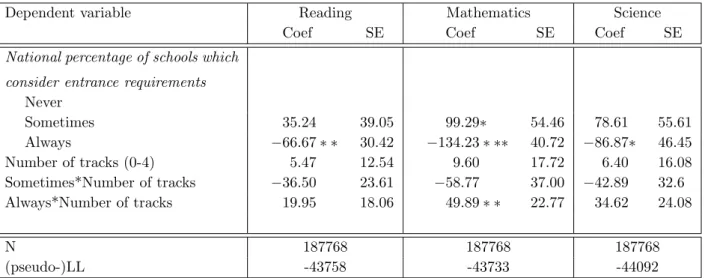
Table 8 presents (weak) evidence that selection does not drive the results presented in this paper. It displays the results for the same linear models as in Table 4, but now the school-level dummies on en- trance requirements are replaced by variables depicting the national percentage of students in schools that sometimes or always have entry requirements. This model excludes the possible selection of students since this micro-phenomenon cannot intervene with the estimation when the entrance requirements are measured at the country level. Unfortunately, the table does not show very significant results, partly due to the reduction in the number of degrees of freedom; however, it does show the same trends as before:
For an average country, where 29% of students are in schools that sometimes use entry requirements and where 32% are in schools that always uses entrance requirements, performance for reading is best if there is one track and performance for mathematics, and science is best if there are five tracks. For a country with a very high percentage of schools that always have entry requirements, students perform best in a five-track system, regardless of the subject.23 For countries with high numbers of schools that never or sometimes have entrance requirements, students perform best with two tracks, also regardless of the subject.24
These results seem to indicate that, although selection could be a problem, it is unlikely that it alone
23A country with a very high percentage of students in schools that always have entry requirements is defined as a country with 16% of its students in schools that sometimes use entry requirements (the mean minus one standard deviation) and 58% in schools that always use entrance requirements (the mean plus one standard deviation).
24The definition of such a country is one where 42% of students attend schools that sometimes use entry requirements (the mean plus one standard deviation) and 6% attend schools that always uses entrance requirements (the mean minus one standard deviation).
drives my results.
[Table 8 about here.]
8 Robustness
A concern with the models in Section 6 is they may suffer from endogeneity. Possible bias due to si- multaneity seems a minor issue: The institutional variables that are the focus of this analysis are often constant or similar over large periods of time and it is therefore reasonable to assume that these are not affected by current student performance. However, it is possible that country heterogeneity introduces endogeneity and thus influences the results. To limit the possibility of omitted variable bias, this analysis includes an extensive set of student and school variables. Furthermore, the selection of countries in this analysis comprises, in many aspects, a homogeneous sample of countries, while they differ substantially in tracking policies. However, even with similar countries, country heterogeneity still exists. For this reason, I also present the results from country fixed effects models.
Other possible distorting factors in my results are the measure used to capture tracking, the sample of countries and the control variables. I report all robustness checks with the PISA reading score as the dependent variables, since reading was the main focus in PISA 2009. Unless otherwise stated, the results for mathematics and science are robust to the various checks. As shown below, the main results are robust to a large number of changes.25
8.1 Country fixed effects
As pointed out by Walldinger (2006), Brunello and Checchi (2007), and Schuetz et al. (2008), a model with country fixed effects provides unbiased results for cross-country analysis, assuming that the existing country heterogeneity does not influence the interaction between admission rules and the number of tracks.
All other effects due to country heterogeneity are controlled for. Although this model still does not allow for a strict causal interpretation, the assumption required is considerably weaker than the assumption that no unobserved country heterogeneity exists, even with a sample of very similar countries. The model estimated here can be written
T estijk=β0+Studentijkβ1+Schooljkβ2+EntReqjkβ3+EntReqjk#of T racks0kβ4
+Ckβ4+ujk+ηijk (5) where Ck are the country dummies.
The first three columns of Table 9 show the results for the models with country fixed effects: the first
25Most of the small changes are reflected through the change in the coefficient for the dummy indicating that the school always considers entry requirements for admittance. The main result, that entrance requirements mitigate the relation between strong tracking and performance, holds in any specification. All tables not shown in this section are available from the author upon request.
column for the model on student performance and the second and third columns for the models analysing educational opportunities. As shown in the first column, the main effects of the dummies on entry re- quirements become less significant and smaller but otherwise the results are quite similar. Since this model does not include the main effect of tracking, since now this is replaced by the country dummies, the interpretation is slightly different.26 In the country fixed effects models it is more difficult to judge student performance for schools that do not consider entrance requirements, since the students in these schools are treated as one group, regardless of the number of tracks available. However, the inclusion of country fixed effects mitigates this to some extent by taking into account, among other things, the effect of the number of tracks in a country. The results with respect to the other categories in tracking and school policies show the same picture as before: For all subjects, students perform best in systems with a high number of tracks when schools always consider prior performance.
Similarly to the models on student performance, the two models on equality of opportunity with fixed effects do not seem to suffer from country heterogeneity. The second and third columns of Table 9 show that country fixed effects models do not change the estimates much: The interactions are very similar, but the dummy for the Always entry requirements becomes significant and also increases.
8.2 Age of first selection
Unlike other papers on this topic, I use the number of tracks available to students at the age of 15 to characterise a country’s tracking regime. Since the PISA test is conducted when the students are between 15 and 16, it is possible that although multiple tracks are available to students at the age of 15, students have not yet been tracked for a substantial amount of time. If this is the case, the association with tracking in these late selection countries may be too weak to be picked up by my analysis. To control for this possible confounding effect, I redo the analysis by using only late trackers.27 The results can be seen in fourth column of Table 9. The results for the late-tracking countries are robust to some extent, although insignificantly so for mathematics and science.
8.3 Heterogeneous educational opportunities
Table 5 indicates that the differences between students of low and high FB are minimised in a highly differentiated system. To investigate whether the effects of tracking and entry requirements on equality of opportunity are indeed different for students of different socioeconomic background, I estimate models for the subsamples of low and high socioeconomic background students (last two columns of Table 9):
For high FB students the results are very similar to those in Table 5. The main effect of FB is a bit weaker and the negative coefficient for the FB–tracking interaction is even larger than before for these
26Because the main effect for the number of tracks is not included, the combined coefficients for reading in the model on student performance are very similar to those for mathematics and science.
27The late-tracking countries, which select at the age of 14 or later, are Croatia, Denmark, Estonia, Finland, Greece, Iceland, Ireland, Israel, Italy, , Latvia, Lithuania, New Zealand, Norway, Poland, Portugal, the Russian Federation, Slovenia, Spain, Sweden, and the United States.
students, indicating that the positive relation between their high FB and performance is greatly mitigated by tracking.
The results are less robust to limiting the sample to the low FB students: The negative interaction term is smaller and insignificant. In other words, for low FB students the number of tracks does not alter educational opportunities. However, the triple interactions (FB, number of tracks, and entry re- quirements) again show that when schools always have entrance requirements, a high number of tracks is beneficial for low FB students.28 It may be that the parents of the low FB students do not even attempt to influence the school in accepting their child and these students are thus not hindered by any objective entrance selection measure, as the high FB students are. It is also possible that students with a low FB, as opposed to students with high FB, already have an efficient match between their ability and track placement. Future research should look into these possible explanations.
Consistent with the main model, the results on the split sample suggest that systems with a high number of tracks provide more equal opportunity to students, achieved through a more efficient matching of ability and tracking, thus mitigating the relation of FB with performance for high FB students.
[Table 9 about here.]
8.4 Other robustness checks
Including the categorical dummies with the number of tracks reveals that especially countries with only a few tracks perform worse (see also Figure 1). Looking at the countries with only a few tracks, the three countries with two tracks (Israel, Greece, and Chile) are among the worst-performing countries with regard to PISA test scores in reading, mathematics, and science. However, excluding these coun- tries does not influence the results much. The conclusions stated before are robust to excluding these low-performing countries.
Other countries that can possibly distort the results are Sweden and the United States. These coun- tries officially have a comprehensive system. However, since ability grouping is very common in both countries and often strictly executed, their education systems may more closely resemble systems with multiple tracks than comprehensive systems. To investigate this possibility, I excluded the United States and then Sweden. The results are also robust to this exclusion. Either the independent effects of the United States and of Sweden are too small to make a difference in an analysis with 31 countries or their education systems can indeed be characterised as comprehensive systems, regardless of frequent ability grouping. I also excluded each of the other countries, one by one, to determine if one of these drives the results and found that they do not.
I also adjusted the control variables used in the models on performance. Excluding the student back- ground variables does not change the results much, although the results are less significant. Excluding
28The results are not shown. Tables are available from the author upon request.