with the Fermi Large Area Telescope
A. A. Abdo2, M. Ackermann3,1, M. Ajello3, A. Allafort3, L. Baldini4, J. Ballet5,
3
G. Barbiellini6,7, M. G. Baring8, D. Bastieri9,10, R. Bellazzini4, B. Berenji3,
4
R. D. Blandford3, E. D. Bloom3, E. Bonamente11,12, A. W. Borgland3, A. Bouvier13,
5
T. J. Brandt14,15,16, J. Bregeon4, M. Brigida17,18, P. Bruel19, R. Buehler3, S. Buson9,10,
6
G. A. Caliandro20, R. A. Cameron3, P. A. Caraveo21, J. M. Casandjian5, C. Cecchi11,12,
7
S. Chaty5, A. Chekhtman22, C. C. Cheung23, J. Chiang3, A. N. Cillis24,25, S. Ciprini12,
8
R. Claus3, J. Cohen-Tanugi26, J. Conrad27,28,29, S. Corbel5,30, S. Cutini31, A. de Angelis32,
9
F. de Palma17,18, C. D. Dermer33, S. W. Digel3, E. do Couto e Silva3, P. S. Drell3,
10
A. Drlica-Wagner3, R. Dubois3, D. Dumora34, C. Favuzzi17,18, E. C. Ferrara25, P. Fortin19,
11
M. Frailis32,35, Y. Fukazawa36, Y. Fukui37, S. Funk3,1, P. Fusco17,18, F. Gargano18,
12
D. Gasparrini31, N. Gehrels25, S. Germani11,12, N. Giglietto17,18, F. Giordano17,18,
13
M. Giroletti38, T. Glanzman3, G. Godfrey3, I. A. Grenier5, M.-H. Grondin39, S. Guiriec40,
14
D. Hadasch20, Y. Hanabata36, A. K. Harding25, M. Hayashida3, K. Hayashi36, E. Hays25,
15
D. Horan19, M. S. Jackson41,28, G. J´ohannesson42, A. S. Johnson3, T. Kamae3,
16
H. Katagiri36, J. Kataoka43, M. Kerr3, J. Kn¨odlseder14,15, M. Kuss4, J. Lande3,
17
L. Latronico4, S.-H. Lee3, M. Lemoine-Goumard34,44, F. Longo6,7, F. Loparco17,18,
18
M. N. Lovellette33, P. Lubrano11,12, G. M. Madejski3, A. Makeev2, M. N. Mazziotta18,
19
J. E. McEnery25,45, P. F. Michelson3, R. P. Mignani46, W. Mitthumsiri3, T. Mizuno36,
20
A. A. Moiseev47,45, C. Monte17,18, M. E. Monzani3, A. Morselli48, I. V. Moskalenko3,
21
S. Murgia3, M. Naumann-Godo5, P. L. Nolan3, J. P. Norris49, E. Nuss26, T. Ohsugi50,
22
A. Okumura51, E. Orlando3,52, J. F. Ormes49, D. Paneque53,3, D. Parent2, V. Pelassa40,
23
M. Pesce-Rollins4, M. Pierbattista5, F. Piron26, M. Pohl54,55, T. A. Porter3,3, S. Rain`o17,18,
24
R. Rando9,10, M. Razzano4, O. Reimer56,3, T. Reposeur34, S. Ritz13, R. W. Romani3,
25
M. Roth57, H. F.-W. Sadrozinski13, P. M. Saz Parkinson13, C. Sgr`o4, D. A. Smith34,
26
P. D. Smith16, G. Spandre4, P. Spinelli17,18, M. S. Strickman33, H. Tajima3,58,
27
H. Takahashi50, T. Takahashi51, T. Tanaka3, J. G. Thayer3, J. B. Thayer3,
28
D. J. Thompson25, L. Tibaldo9,10,5,59, O. Tibolla60, D. F. Torres20,61, G. Tosti11,12,
29
A. Tramacere3,62,63, E. Troja25,64, Y. Uchiyama3,1, J. Vandenbroucke3, V. Vasileiou26,
30
G. Vianello3,62, N. Vilchez14,15, V. Vitale48,65, A. P. Waite3, P. Wang3, B. L. Winer16,
31
K. S. Wood33, H. Yamamoto37, R. Yamazaki66, Z. Yang27,28, M. Ziegler13
32
arXiv:1103.5727v1 [astro-ph.HE] 29 Mar 2011
1Corresponding authors: M. Ackermann, markusa@slac.stanford.edu; S. Funk, funk@slac.stanford.edu;
Y. Uchiyama, uchiyama@slac.stanford.edu.
2Center for Earth Observing and Space Research, College of Science, George Mason University, Fairfax, VA 22030, resident at Naval Research Laboratory, Washington, DC 20375
3W. W. Hansen Experimental Physics Laboratory, Kavli Institute for Particle Astrophysics and Cosmol- ogy, Department of Physics and SLAC National Accelerator Laboratory, Stanford University, Stanford, CA 94305, USA
4Istituto Nazionale di Fisica Nucleare, Sezione di Pisa, I-56127 Pisa, Italy
5Laboratoire AIM, CEA-IRFU/CNRS/Universit´e Paris Diderot, Service d’Astrophysique, CEA Saclay, 91191 Gif sur Yvette, France
6Istituto Nazionale di Fisica Nucleare, Sezione di Trieste, I-34127 Trieste, Italy
7Dipartimento di Fisica, Universit`a di Trieste, I-34127 Trieste, Italy
8Rice University, Department of Physics and Astronomy, MS-108, P. O. Box 1892, Houston, TX 77251
9Istituto Nazionale di Fisica Nucleare, Sezione di Padova, I-35131 Padova, Italy
10Dipartimento di Fisica “G. Galilei”, Universit`a di Padova, I-35131 Padova, Italy
11Istituto Nazionale di Fisica Nucleare, Sezione di Perugia, I-06123 Perugia, Italy
12Dipartimento di Fisica, Universit`a degli Studi di Perugia, I-06123 Perugia, Italy
13Santa Cruz Institute for Particle Physics, Department of Physics and Department of Astronomy and Astrophysics, University of California at Santa Cruz, Santa Cruz, CA 95064, USA
14CNRS, IRAP, F-31028 Toulouse cedex 4, France
15Universit´e de Toulouse, UPS-OMP, IRAP, Toulouse, France
16Department of Physics, Center for Cosmology and Astro-Particle Physics, The Ohio State University, Columbus, OH 43210, USA
17Dipartimento di Fisica “M. Merlin” dell’Universit`a e del Politecnico di Bari, I-70126 Bari, Italy
18Istituto Nazionale di Fisica Nucleare, Sezione di Bari, 70126 Bari, Italy
19Laboratoire Leprince-Ringuet, ´Ecole polytechnique, CNRS/IN2P3, Palaiseau, France
20Institut de Ciencies de l’Espai (IEEC-CSIC), Campus UAB, 08193 Barcelona, Spain
21INAF-Istituto di Astrofisica Spaziale e Fisica Cosmica, I-20133 Milano, Italy
22Artep Inc., 2922 Excelsior Springs Court, Ellicott City, MD 21042, resident at Naval Research Labora- tory, Washington, DC 20375
23National Research Council Research Associate, National Academy of Sciences, Washington, DC 20001, resident at Naval Research Laboratory, Washington, DC 20375
24Instituto de Astronom´ıa y Fisica del Espacio, Parbell´on IAFE, Cdad. Universitaria, Buenos Aires,
Argentina
25NASA Goddard Space Flight Center, Greenbelt, MD 20771, USA
26Laboratoire Univers et Particules de Montpellier, Universit´e Montpellier 2, CNRS/IN2P3, Montpellier, France
27Department of Physics, Stockholm University, AlbaNova, SE-106 91 Stockholm, Sweden
28The Oskar Klein Centre for Cosmoparticle Physics, AlbaNova, SE-106 91 Stockholm, Sweden
29Royal Swedish Academy of Sciences Research Fellow, funded by a grant from the K. A. Wallenberg Foundation
30Institut universitaire de France, 75005 Paris, France
31Agenzia Spaziale Italiana (ASI) Science Data Center, I-00044 Frascati (Roma), Italy
32Dipartimento di Fisica, Universit`a di Udine and Istituto Nazionale di Fisica Nucleare, Sezione di Trieste, Gruppo Collegato di Udine, I-33100 Udine, Italy
33Space Science Division, Naval Research Laboratory, Washington, DC 20375, USA
34Universit´e Bordeaux 1, CNRS/IN2p3, Centre d’ ´Etudes Nucl´eaires de Bordeaux Gradignan, 33175 Gradignan, France
35Osservatorio Astronomico di Trieste, Istituto Nazionale di Astrofisica, I-34143 Trieste, Italy
36Department of Physical Sciences, Hiroshima University, Higashi-Hiroshima, Hiroshima 739-8526, Japan
37Department of Physics and Astrophysics, Nagoya University, Chikusa-ku Nagoya 464-8602, Japan
38INAF Istituto di Radioastronomia, 40129 Bologna, Italy
39Institut f¨ur Astronomie und Astrophysik, Universit¨at T¨ubingen, D 72076 T¨ubingen, Germany
40Center for Space Plasma and Aeronomic Research (CSPAR), University of Alabama in Huntsville, Huntsville, AL 35899
41Department of Physics, Royal Institute of Technology (KTH), AlbaNova, SE-106 91 Stockholm, Sweden
42Science Institute, University of Iceland, IS-107 Reykjavik, Iceland
43Research Institute for Science and Engineering, Waseda University, 3-4-1, Okubo, Shinjuku, Tokyo 169- 8555, Japan
44Funded by contract ERC-StG-259391 from the European Community
45Department of Physics and Department of Astronomy, University of Maryland, College Park, MD 20742
46Mullard Space Science Laboratory, University College London, Holmbury St. Mary, Dorking, Surrey, RH5 6NT, UK
47Center for Research and Exploration in Space Science and Technology (CRESST) and NASA Goddard Space Flight Center, Greenbelt, MD 20771
48Istituto Nazionale di Fisica Nucleare, Sezione di Roma “Tor Vergata”, I-00133 Roma, Italy
ABSTRACT
33
34 We present observations of the young Supernova remnant (SNR) RX J1713.7−3946 with the Fermi Large Area Telescope (LAT). We clearly de- tect a source positionally coincident with the SNR. The source is extended with a best-fit extension of 0.55◦±0.04◦ matching the size of the non-thermal X-ray and TeV gamma-ray emission from the remnant. The positional coincidence and the matching extended emission allows us to identify the LAT source with the super- nova remnant RX J1713.7−3946. The spectrum of the source can be described by a very hard power-law with a photon index of Γ = 1.5±0.1 that coincides in normalization with the steeper H.E.S.S.-detected gamma-ray spectrum at higher
49Department of Physics and Astronomy, University of Denver, Denver, CO 80208, USA
50Hiroshima Astrophysical Science Center, Hiroshima University, Higashi-Hiroshima, Hiroshima 739-8526, Japan
51Institute of Space and Astronautical Science, JAXA, 3-1-1 Yoshinodai, Chuo-ku, Sagamihara, Kanagawa 252-5210, Japan
52Max-Planck Institut f¨ur extraterrestrische Physik, 85748 Garching, Germany
53Max-Planck-Institut f¨ur Physik, D-80805 M¨unchen, Germany
54Institut f¨ur Physik und Astronomie, Universit¨at Potsdam, 14476 Potsdam, Germany
55Deutsches Elektronen Synchrotron DESY, D-15738 Zeuthen, Germany
56Institut f¨ur Astro- und Teilchenphysik and Institut f¨ur Theoretische Physik, Leopold-Franzens- Universit¨at Innsbruck, A-6020 Innsbruck, Austria
57Department of Physics, University of Washington, Seattle, WA 98195-1560, USA
58Solar-Terrestrial Environment Laboratory, Nagoya University, Nagoya 464-8601, Japan
59Partially supported by the International Doctorate on Astroparticle Physics (IDAPP) program
60Institut f¨ur Theoretische Physik and Astrophysik, Universit¨at W¨urzburg, D-97074 W¨urzburg, Germany
61Instituci´o Catalana de Recerca i Estudis Avan¸cats (ICREA), Barcelona, Spain
62Consorzio Interuniversitario per la Fisica Spaziale (CIFS), I-10133 Torino, Italy
63INTEGRAL Science Data Centre, CH-1290 Versoix, Switzerland
64NASA Postdoctoral Program Fellow, USA
65Dipartimento di Fisica, Universit`a di Roma “Tor Vergata”, I-00133 Roma, Italy
66Department of Physics and Mathematics, Aoyama Gakuin University, Sagamihara, Kanagawa, 252-5258, Japan
energies. The broadband gamma-ray emission is consistent with a leptonic origin as the dominant mechanism for the gamma-ray emission.
Subject headings: gamma-ray: observations; ISM: supernova remnants, ISM:individuals:RX
35
J1713.7-3946, acceleration of particles, radiation mechanisms: non-thermal
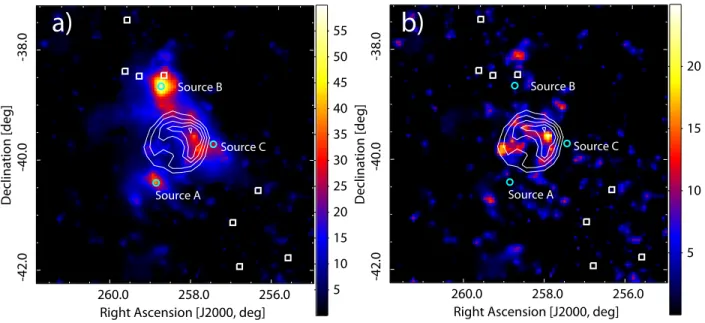
36
1. Introduction
37
Gamma-ray observations of shell-type supernova remnants (SNRs) hold great promise
38
to help understanding the acceleration of cosmic rays (CRs). These particles – arriving at
39
Earth mostly in the form of protons – are thought to be accelerated by a mechanism called
40
diffusive shock acceleration (Bell 1978; Blandford & Ostriker 1978; Jones & Ellison 1991;
41
Malkov & Drury 2001) in the shocks of supernova explosions up to energies around the
42
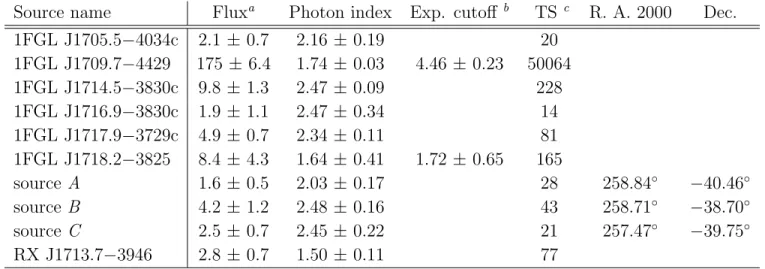
“knee” in the spectrum of cosmic rays (∼1015eV). In particular, X-ray and TeV gamma-ray
43
observations of young SNRs such as Cas A (Hwang et al. 2004; Gotthelf et al. 2001; Albert
44
et al. 2007; Abdo et al. 2010b), or RX J1713.7−3946 (Koyama et al. 1997; Uchiyama et al.
45
2002; Aharonian et al. 2006, 2007) have confirmed the existence of relativistic particles in
46
the shock waves. Young SNRs are preferred targets for seeing particle acceleration at work
47
since in these objects the shocks are still strong and actively accelerating particles to the
48
highest energies. Gamma-ray instruments have the angular resolution to spatially resolve
49
some of the closer SNRs.
50
RX J1713.7−3946 (also known as G347.3−0.5) is a young “historical” remnant suggested
51
to be associated with the appearance of a guest star in the constellation of Scorpius in AD393
52
by Wang et al. (1997). RX J1713.7−3946 is located in the Galactic plane (atl = 347.3◦,b=
53
−0.5◦) and was discovered in soft X-rays in 1996 in the ROSAT all-sky survey (Pfeffermann
54
& Aschenbach 1996). At a suggested distance of 1 kpc (Koyama et al. 1997; Fukui et al.
55
2003; Cassam-Chena¨ı et al. 2004) with angular diameter ∼ 650 ×550, the size of the shell
56
is ∼ 20 pc. Its properties are strikingly dominated by non-thermal activity. Its X-ray
57
emission shows a featureless spectrum interpreted to be completely dominated by X-ray
58
synchrotron emission from ultra-relativistic electrons (Koyama et al. 1997; Slane et al. 1999;
59
Tanaka et al. 2008). The thermal X-ray emission as well as the radio emission are extremely
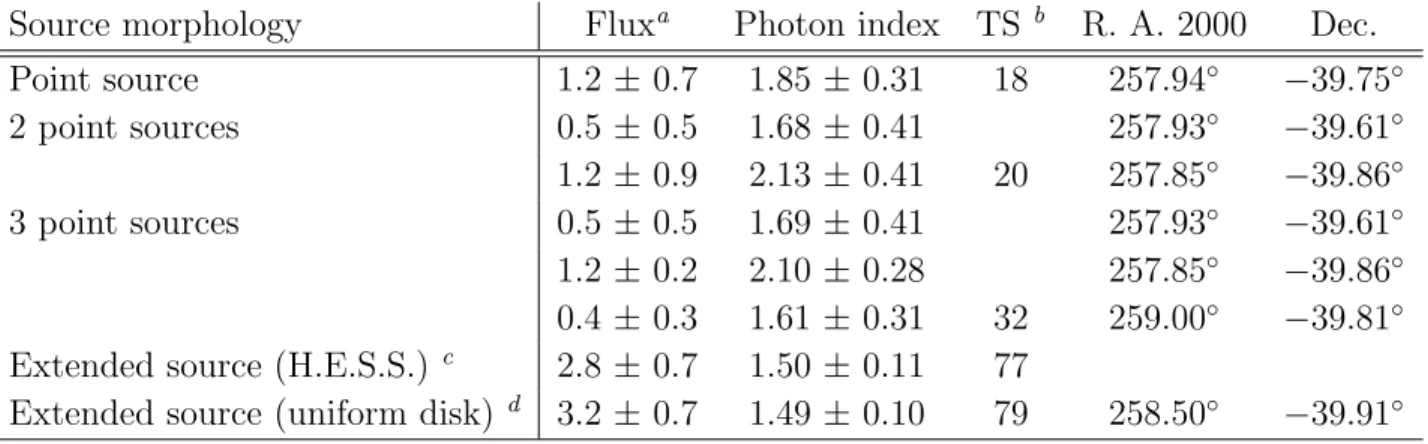
60
faint (Lazendic et al. 2004). Detailed X-ray observations with Chandra and XMM-Newton
61
unveiled a complex structure of filaments and knots in the shell of the SNR – in particular
62
in the western part (Uchiyama et al. 2003; Lazendic et al. 2004; Cassam-Chena¨ı et al. 2004;
63
Acero et al. 2009). A recent study with theSuzaku satellite extended the X-ray spectrum to
64
∼ 40 keV, a measurement that enabled the determination of the parent electron spectrum
65
in the energy range where the spectrum cuts off (Tanaka et al. 2008).
66
RX J1713.7−3946 is the first SNR for which TeV gamma-ray emission was clearly de-
67
tected emerging from the shell. H.E.S.S. measurements provided the first-ever resolved
68
gamma-ray emission at TeV energies. The TeV emission closely matches the non-thermal
69
X-ray emission as demonstrated by Aharonian et al. (2006). The energy spectrum of
70
RX J1713.7−3946 has been measured up to ∼ 100 TeV, clearly demonstrating particle
71
acceleration to beyond these energies in the shell of the SNR.
72
While the non-thermal X-rays detected in the shells of young SNRs are clearly generated
73
through synchrotron emission by ultra-relativistic electrons (Koyama et al. 1997), the picture
74
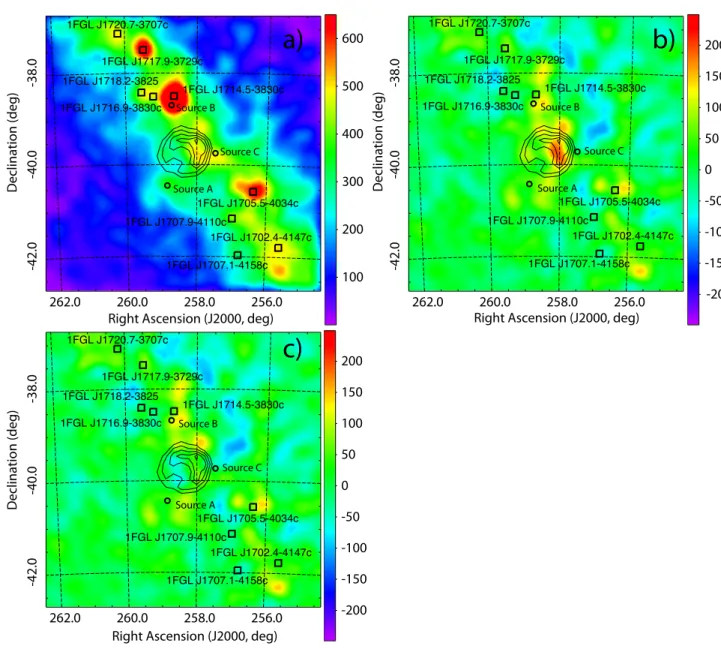
of the particle population radiating the gamma rays is not so clear. The main argument
75
revolves around two main emission mechanisms (Aharonian et al. 2006; Katz & Waxman
76
2008; Berezhko & V¨olk 2008; Porter et al. 2006; Ellison & Vladimirov 2008; Morlino et al.
77
2009), but so far, conclusive evidence for either possibility is still missing. One scenario
78
suggests a connection of the TeV gamma-ray emission with accelerated protons (CRs) by
79
invoking the interaction of these protons with interstellar material generating neutral pions
80
(π0s) which in turn decay into gamma rays. A second competing channel exists in the
81
inverse Compton scattering of the photon fields in the surroundings of the SNR by the same
82
relativistic electrons that generate the synchrotron X-ray emission. This channel naturally
83
accounts for the close resemblance between the X-ray and the TeV gamma-ray images.
84
Several ways have been suggested to distinguish between these two scenarios (see e.g. Morlino
85
et al. 2009) but one of the most promising seems to be the broadband modeling of the spectral
86
energy distribution (SED). In this regard, observations of young SNRs with the LAT on
87
board the Fermi Gamma-Ray Space Telescope (Fermi) are of particular importance since
88
the LAT detects gamma rays in the energy range that bridges sensitive measurements with
89
X-ray satellites such as Chandra and XMM-Newton and TeV gamma-ray telescopes such as
90
H.E.S.S., VERITAS or MAGIC.
91
2. Observation and Analysis
92
The Fermi-LAT is a pair-conversion gamma-ray telescope with a precision tracker and
93
calorimeter, each consisting of a 4×4 array of 16 modules, a segmented anti-coincidence
94
detector (ACD) that covers the tracker array, and a programmable trigger and data ac-
95
quisition system. The incoming gamma rays produce electron-positron pairs in the tracker
96
subsystem, which allow a reconstruction of the directions of the primary gamma rays using
97
the information provided by the 36 layers of silicon strip detectors in the tracker. The energy
98
of the incoming gamma ray is determined from the energy deposited by the electromagnetic
99
showers in the segmented CsI calorimeter. The ACD subsystem is used as a veto against
100
the great majority of cosmic rays that trigger the LAT. The energy range of the LAT is 20
101
MeV to >300 GeV with an angular resolution for events converting in the front part of the
102
detector of approximately 3.5◦ at 100 MeV, improving to about 0.1◦ at 10 GeV (defined as
103
the 68% containment radius of the LAT point-spread function or PSF). Full details on the
104
instrument and the on-board and ground data processing are given in (Atwood et al. 2009).
105
The LAT normally operates in a scanning mode (the “sky survey” mode) that covers
106
the whole sky every two orbits (∼3 h). We use data taken in this mode from the commence-
107
ment of scientific operations on 2008 August 4 to 2010 August 4. The data were prepared
108
and analyzed using the LAT Science Tools package (v9r16p1), which is available from the
109
Fermi Science Support Center1. Only events satisfying the standard low-background event
110
selection (the so-called “Diffuse” class events) and coming from zenith angles < 105◦ (to
111
greatly reduce the contribution by Earth albedo gamma rays, see Abdo et al. 2009a) were
112
used in the present analysis. We use all gamma rays with energy > 500 MeV within a
113
20◦ ×20◦ region of interest (ROI) centered at the nominal position of RX J1713.7−3946
114
(α = 258.39◦, δ = 39.76◦). We chose a lower bound of 500 MeV for this analysis for two
115
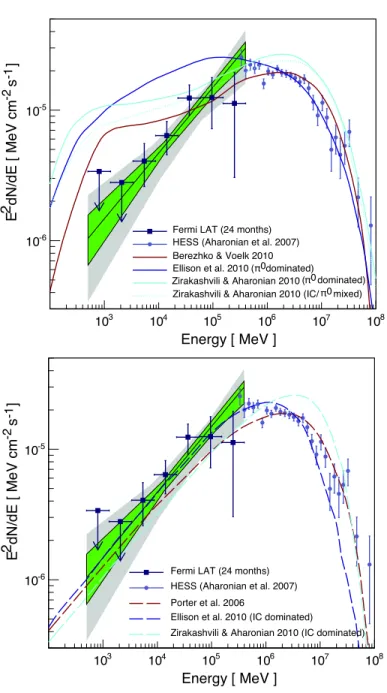
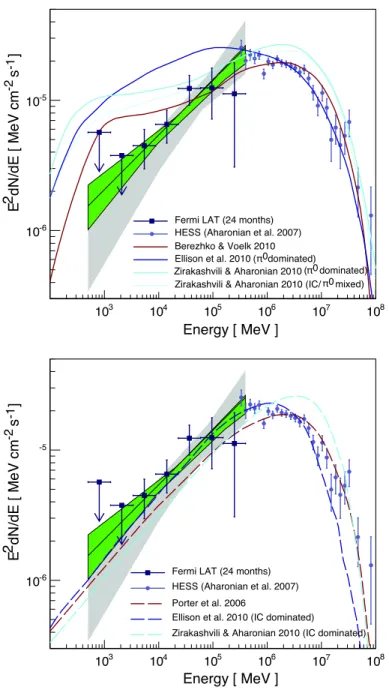
reasons: Due to the relative hardness of the spectrum of RX J1713.7−3946 compared to
116
the Galactic diffuse background, photons with energies below 500 MeV are not effective in
117
constraining morphology or spectral shape of the source. Additionally, the broadening of
118
the PSF at low energies might lead to systematic problems of confusion with neighboring
119
sources in this densely populated region of the sky. To further reduce the effect of Earth
120
albedo backgrounds, any time intervals when the Earth was appreciably in the field of view
121
(specifically, when the center of the field of view was more than 52◦ from the zenith) as well
122
as any time intervals when parts of the ROI were observed at zenith angles>105◦ were also
123
excluded from the analysis. The spectral analysis was performed based on the P6v3 version
124
of post-launch instrument response functions (IRFs) which take into account pile-up and
125
accidental coincidence effects in the detector subsystems (Rando et al. 2009). The binned
126
maximum-likelihood mode ofgtlike, which is part of the ScienceTools, was used to determine
127
the intensities and spectral parameters presented in this paper.
128
1http://fermi.gsfc.nasa.gov/ssc/
2.1. Background sources
129
We adopt a background model for the region which includes components describing
130
the diffuse Galactic and isotropic gamma-ray emission 2. It also includes all point sources
131
within our ROI which are identified in the 1FGL catalog (Abdo et al. 2010a) except 1FGL
132
1711.7−3944c which is spatially coincident with RX J1713.7−3946. All 1FGL sources are
133
modeled with a power-law spectrum using the flux and spectral index values obtained from
134
the catalog. Exceptions are the known pulsars in the ROI which we model with a power-law
135
with exponential cutoff spectral model. As the parameters for this spectral model cannot
136
be obtained from the 1FGL catalog, we keep the flux, spectral index and cutoff energy of
137
the known pulsars as free parameters in the maximum likelihood fits of the ROI. Figure 1
138
shows two maps of the point-source detection significance, evaluated at each point in the map
139
(TS map) for the region around RX J1713.7−3946 using photons with energies >500 MeV.
140
The flux of the source is not permitted to be negative, this is why negative fluctuations are
141
not visible. The detection significance is shown in terms of the test statistic (TS) of the
142
likelihood fit. The TS value is defined as TS=2(lnL1/L0), proportional to the logarithm
143
of the likelihood ratio between a point-source hypothesis (L1) and the null hypothesis of
144
pure background (L0) (Mattox et al. 1996). The significance contours of the TeV emission
145
observed from the SNR by the H.E.S.S. telescope array (Aharonian et al. 2006) are overlaid
146
on the maps. Panel (a) shows the TS map characterizing the excess emission found in the
147
region around RX J1713.7−3946 over our background model described above. A significant
148
TS value is found within the spatial extent of the SNR but also in several regions outside of
149
its shell.
150
We identify three regions of excess gamma-ray emission which are likely not associated
151
with the SNR but belong to background sources not recognized in the first Fermi catalog
152
(1FGL). Due to the longer integration time of our analysis (24 months vs. 11 months in the
153
catalog) and the corresponding improved sensitivity, the appearance of additional sources
154
in our region of interest is expected. We simply denote these sources with the identifier A,
155
B, C. The source positions are shown in Figure 1 and given in Table 2. The location of
156
sourceAis consistent with a weak radio source (Lazendic et al. 2004). It is further identified
157
in an internal update of the Fermi LAT catalog using 24 months of data. Source B is
158
only 110 from the catalog source 1FGL J1714.5−3830c and could be an artifact caused by
159
unmodeled emission from 1FGL J1714.5−3830c if this source were spatially extended as has
160
been tentatively suggested by Castro & Slane (2010). 1FGL J1714.5−3830c is modeled as a
161
2The LAT standard diffuse emission models (gll iem v02.fits andisotropic iem v02.fits), available at http://fermi.gsfc.nasa.gov/ssc/data/access/lat/BackgroundModels.html
point source in the 1FGL catalog. However, the catalog source is spatially coincident with
162
the SNR CTB 37A which has an extent in radio of∼150 (Green 2004). A detailed study of
163
the morphology of this source is in progress but beyond the scope of this publication as the
164
exact morphology of the CTB 37A source does not significantly affect the spectral analysis
165
of RX J1713.7−3946. For simplicity we just assume the emission from this region to be
166
described by two independent point sources, 1FGL J1714.5−3830c and source B. The third
167
additional background sourceC shown in Figure 1 may be associated with RX J1713.7−3946.
168
It is very close to RX J1713.7−3946, located about 350 from the center of the SNR. However,
169
it is spatially consistent with a local enhancement of molecular gas, observed via the radio
170
emission from the CO (J=1→0) transition (Dame et al. 2001). Furthermore, we will show
171
below (see Table 2) that in a combined likelihood analysis of the spectra of RX J1713.7−3946
172
and the surrounding background sources the emission from source C is considerably softer
173
than the gamma-ray emission from the SNR. In fact, both the spectral index and the intensity
174
of the source are consistent with expectations of gamma-ray emission from a small cloud of
175
molecular gas. Nevertheless, we cannot reject the possibility that at least part of the emission
176
attributed to the additional background source C is originating from the SNR shell. While
177
we consider source C an independent point source in our standard background model of the
178
ROI, we repeat the spectral analysis with a model without this source and account for the
179
difference in our estimation of systematic uncertainties. Panel (b) in Figure 1 shows the
180
detection significance map for the region around RX J1713.7−3946 (E > 500 MeV) with
181
our standard background model accounted for. A comparison with the significance contours
182
from H.E.S.S. suggests a spatially extended emission from the shell of the SNR rather than
183
a single point source.
184
2.2. Centroid and Angular Extent
185
We study the morphology of the emission associated with RX J1713.7−3946 with a
186
series of maximum likelihood fits, comparing the TS value for different hypotheses about the
187
shape and extent of the source. We fitted the extension (and position) of the gamma-ray
188
emission with a disk of varying radius. The emission is found to be significantly extended;
189
the best-fit position (RA, Dec = 258.50◦±0.04◦stat,−39.91◦±0.05◦stat) is consistent with the
190
center of the SNR within 0.2◦ and the best-fit radius is 0.55◦±0.04◦. This size is consistent
191
with that of the X-ray SNR given in Green (2004) as 1.1◦×0.9◦ in diameter. To confirm
192
these fits, we test a single point source at the location of the highest excess in the TS map
193
within the shell of the SNR. We further test a spatially extended source defined by the
194
shape of the H.E.S.S. significance contours of RX J1713.7−3946 and an extended source
195
as a uniform disk of 0.55◦ radius. Finally, we consider two and three independent point
196
sources within the shell of the SNR located at the most prominent peaks in the TS map.
197
A power-law spectrum with integrated flux (between 1 and 300 GeV) and spectral index as
198
free parameters is assumed for each of the hypotheses. The detailed setup of the likelihood
199
fit is identical to the one used for the spectral analysis and described with that analysis
200
(Section 2.3). Table 1 shows the flux, and spectral index of the tested shape and its TS
201
value in comparison to the background model. The TS values are suggestive of extended
202
gamma-ray emission from RX J1713.7−3946. The H.E.S.S. significance map as well as the
203
uniform disk have a difference in TS of ∆TS = 61 or 58 (H.E.S.S./Disk) relative to a single
204
point source and a ∆TS = 43 or 40 (H.E.S.S./Disk) relative to a set of 3 point sources within
205
the shell of RX J1713.7−3946. However, the TS value in a comparison to the background
206
model for both the H.E.S.S. significance map (T S = 77) and the uniform disk (T S = 79)
207
are almost identical, demonstrating that we are not sensitive to the detailed shape of the
208
emission region. For the models of RX J1713.7−3946 considered, the TS value is expected
209
to follow aχ2-distribution with two degrees of freedom in the case that no source is present
210
(Mattox et al. 1996) and therefore can be converted to a detection significance of ∼8.5σ for
211
both the H.E.S.S. template and the uniform disk model. The positional and the angular-size
212
coincidence with the X-ray and TeV gamma-ray emission strongly favors an identification of
213
the LAT source with the SNR RX J1713.7−3946.
214
Fig. 2 shows a series of LAT gamma-ray counts maps of the sky surrounding RX J1713.7−3946.
215
We choose an energy threshold of 3 GeV for these maps, higher than the analysis threshold
216
of 500 MeV, to enhance their resolution. The counts maps are smoothed with an 0.3◦ wide
217
Gaussian kernel. This width corresponds to the size of the LAT PSF at 3 GeV (the 39%
218
containment radius of a 2-D gaussian), averaged over front and back conversions and over all
219
incident angles. Locations of 1FGL catalog sources in the region are marked by squares. Our
220
additional background sources are denoted by circles and labeled. The black lines again dis-
221
play the contours of the H.E.S.S. significance map of RX J1713.7−3946. Panel (a) shows all
222
counts in the region. The emission coinciding with RX J1713.7−3946 is faint; the counts map
223
is dominated by the Galactic diffuse emission as well as emission from 1FGL J1714.5−3830c
224
and 1FGL J1705.5−4034c. Panel (b) shows a residual counts map after subtraction of our
225
background model. On this panel a clear excess within the shell of RX J1713.7−3946 is vis-
226
ible. Panel (c) finally shows the residual counts after subtraction of our background model
227
as well as the emission from RX J1713.7−3946 (using the H.E.S.S. significance map as the
228
template for the spatial extension). The residual counts are consistent with the expected
229
statistical fluctuations, i.e the region around the SNR is well described by our model.
230
2.3. Spectral Analysis
231
We adopt the spatial extension model based on the H.E.S.S. significance map as the
232
default model for the analysis of the spectrum of RX J1713.7−3946. As discussed in the
233
previous section, the LAT is not able to distinguish between the two extended source models
234
that we tested. Therefore, we compare the obtained spectrum from the default model to the
235
results derived from a uniform disk source model and include the difference in the systematic
236
uncertainty of the spectrum. In the first step of the spectral analysis we perform a maximum
237
likelihood fit of the spectrum of RX J1713.7−3946 in the energy range between 500 MeV
238
and 400 GeV using a power-law spectral model with integral flux and spectral index as free
239
parameters. To accurately account for correlations between close-by sources we also allow
240
the integral fluxes and spectral indices of the nearby 1FGL and sourcesA, B, C (<3◦ from
241
the center of the ROI) to be free for the likelihood maximization, as well as the spectral
242
parameters of identified LAT pulsars, instead of fixing them to the 1FGL catalog values. We
243
redetermine in our fit the normalization of the Galactic diffuse emission model, the index of
244
an energy dependent (power-law) multiplicative correction factor to it, and the normalization
245
of the isotropic component. This accounts for localized variations in the spectrum of the
246
diffuse emission in the fit which are not considered in the global model.
247
For the Galactic diffuse emission, we find a normalization factor of 0.93 ± 0.01 in our
248
region of interest and a spectral correction factor index of 0.019 ± 0.002 (the positive sign
249
corresponds to a spectrum that is harder than in the model). The normalization factor for
250
the isotropic component is 1.17 ± 0.05. These factors demonstrate the good agreement of
251
the local brightness and spectrum of the diffuse gamma-ray emission with the global diffuse
252
emission model. Table 2 summarizes the source parameters obtained as results from this
253
fit. The table includes the spectral parameters and the TS values of all fitted sources. The
254
flux above 1 GeV obtained for RX J1713.7−3946 with our default background model is
255
F1000 = (2.8 ± 0.7)×10−9 cm−2 s−1 and the spectral index is Γ = 1.50 ± 0.11. Figure 3
256
shows the uncertainty band obtained from this fit.
257
In a second step we perform a maximum likelihood fit of the flux of RX J1713.7−3946
258
in 7 independent logarithmically spaced energy bands from 500 MeV to 400 GeV (using the
259
spectral model and parameters obtained in the previous fit) to obtain a spectral energy dis-
260
tribution (SED) for the SNR. The resulting SED is displayed in Figure 3 as black error bars.
261
We require a test statistic value of TS≥4 in each band to draw a data point corresponding
262
to a 2σ detection significance. This criterion is not fulfilled for the lowest two energy bands
263
500 MeV–1.3 GeV and 1.3 GeV–3.4 GeV and accordingly we show 95% flux upper limits for
264
these bands.
265
In a final step we estimate the systematic uncertainty on the obtained spectral parame-
266
ters by repeating the maximum likelihood analysis for several variations of our default model.
267
Specifically, we varied the source shape template, the background sources, and the model
268
of the Galactic diffuse emission. The spectral analysis was performed: a) with the uniform
269
disk shape replacing the H.E.S.S. significance map template; b) with the closest background
270
source C removed from the model (see also discussion above); c) using a preliminary list of
271
sources from the 2FGL catalog in development within the LAT collaboration; d) replacing
272
the standard diffuse emission model by a refined model that is currently being evaluated in
273
the collaboration for source analysis for the 2FGL catalog (refined with 24 months of data
274
and with finer gas maps); e) replacing the standard diffuse model by a model based on the
275
GALPROP code 3 used in the Fermi LAT analysis of the isotropic diffuse emission. The
276
GALPROP model is described in Abdo et al. (2010c). For e), i.e. the GALPROP-based
277
model, we considered the various components of the diffuse emission model separately for
278
which we then individually fit the normalizations in our likelihood analysis. The compo-
279
nents are gamma rays produced by inverse Compton emission, gamma rays produced by
280
interactions of CRs with atomic and ionized interstellar gas and gamma rays produced in
281
the interactions of CRs with molecular gas. The model component describing the gamma
282
ray intensity from interactions with molecular gas is further subdivided into seven ranges of
283
Galactocentric distance to accommodate localized variations of the CR and molecular gas
284
density along the line of sight which are not accounted for in the model.
285
The same model of the isotropic component was used for all model variations a)–
286
e). From the model variations a) – e) we obtain a systematic uncertainty of +0.08/-
287
0.10 for the spectral index of RX J1713.7−3946 and a systematic uncertainty of (+0.6/-
288
0.7)×10−9 cm−2 s−1 for the flux above 1 GeV on top of the statistical uncertainty. The
289
systematic uncertainty of the derived flux and spectral index related to the uncertainty in
290
the LAT effective area was evaluated separately. The uncertainty of the LAT effective area –
291
estimated from observations of Vela (Abdo et al. 2009b) and the Earth Albedo (Abdo et al.
292
2009a) – ranges from 10% at 500 MeV to 20% at ≥10 GeV. The impact on the spectral pa-
293
rameters of RX J1713.7−3946 is a systematic uncertainty of±0.05 for the spectral index and
294
a systematic uncertainty of±0.4 for the flux above 1 GeV. The gray band in Figure 3 displays
295
the superposition of all uncertainty bands obtained in our variations of the default model.
296
Figure 4 depicts the model variation (b) resulting in the softest spectrum together with the
297
fluxes in individual energy bands (black error bars) derived for model (b) using the same
298
procedure as for the default model described above. The range of systematic uncertainty is
299
particularly important to consider for comparisons of the spectrum to pion-decay dominated
300
3GALPROP is a software package for calculating the diffuse Galactic gamma-ray emission based on a model of cosmic-ray propagation in the Galaxy. See http://galprop.stanford.edu/ for details and references
gamma-ray emission models which are generally expected to be softer than inverse Compton
301
dominated gamma-ray emission models.
302
3. Discussion
303
The positional coincidence between the extended gamma-ray emission detected by the
304
Fermi-LAT at the position of RX J1713.7−3946 strongly suggests a physical association be-
305
tween the GeV gamma-ray emission and this young SNR. In addition, the region of bright-
306
est LAT gamma-ray emission coincides with the northwestern part of the SNR. From CO
307
(J = 1−0) observations Fukui et al. (2003) and Moriguchi et al. (2005) suggested that this
308
part of the SNR is undergoing complex interactions between the supernova shock wave and
309
a molecular cloud. This part is also the brightest region in non-thermal X-rays and in TeV
310
gamma rays. The match between the locations of brightest emission suggests that the GeV
311
emission is also generated by the population of relativistic particles responsible for the TeV
312
gamma-ray and non-thermal X-ray emission.
313
The origin of the TeV gamma-ray emission from RX J1713.7−3946 has been a matter
314
of active debate (see Zirakashvili & Aharonian 2010, and references therein). There are two
315
competing processes potentially responsible for the shell-like TeV gamma-ray emission from
316
RX J1713.7−3946: Inverse Compton (IC) scattering on the cosmic microwave background
317
by relativistic electrons (leptonic model) and π0-decay gamma rays resulting mainly from
318
inelastic collisions between relativistic protons and ambient gas nuclei (hadronic model). It is
319
generally accepted that diffusive shock acceleration (DSA) operates at supernova shocks pro-
320
ducing high-energy protons and electrons. However, injection mechanisms of supra-thermal
321
particles are poorly known so that the current theory cannot tell us about the number of
322
relativistic protons and electrons produced at shocks. This makes it difficult to reliably
323
predict the levels of leptonic and hadronic gamma-rays.
324
The lack of thermal X-ray lines provided a stringent constraint on the gamma-ray pro-
325
duction mechanisms. The luminosity of hadronic gamma-rays scales as ¯nHWp, where ¯nH
326
denotes the gas density averaged over the emission volume (where accelerated protons are
327
assumed to be uniformly distributed), Wp = ξESN is a total energy content of accelerated
328
protons, and ESN ∼ 1051 erg is the total kinetic energy released by the SN explosion. The
329
lack of thermal X-ray emission in SNR RX J1713.7−3946 (Slane et al. 1999; Tanaka et al.
330
2008) severely restricts the gas density in the SNR to be small. Ellison et al. (2010) have
331
performed calculations of thermal X-ray emission from shocked plasma with non-equilibrium
332
ionization in the case of uniform ambient density, following a hydrodynamic evolution with
333
which non-linear DSA theory is coupled; they found that the shocked gas densities required
334
for consistency with the hadronic model are nH.0.2 cm−3. It should be noted that, taking
335
ESN= 2×1051erg, one needs ξ ∼1 (i.e., extremely efficient acceleration) for ¯nH= 0.1 cm−3
336
andd= 1 kpc. The extremely efficient (more efficient than usually assumed) transformation
337
of the supernova kinetic energy into accelerated particles may lead to very low shocked gas
338
temperature (Drury et al. 2009), which in turn could change the density requirement.
339
The measurements of GeV gamma-ray emission obtained with the Fermi-LAT pre-
340
sented in this paper provide new, crucial information about the particle population respon-
341
sible for the gamma-ray emission. We have measured the gamma-ray spectrum of SNR
342
RX J1713.7−3946 in the energy range from 500 MeV to 400 GeV and found that the spectrum
343
can be characterized by a hard power law with photon index Γ = 1.5±0.1(stat)±0.1(sys),
344
smoothly connecting with the steeper TeV gamma-ray spectrum measured with H.E.S.S.
345
Note that the measured gamma-ray spectrum of RX J1713.7−3946 now covers five orders of
346
magnitude in energy, unprecedented for SNRs.
347
The hard power-law shape in the Fermi-LAT energy range with photon index of Γ =
348
1.5±0.1 qualitatively agrees with the expected IC spectrum of the leptonic model, as il-
349
lustrated in both Figures 3 and 4. If the leptonic model explains the gamma-ray spectrum,
350
the Fermi-LAT spectrum is emitted by a power-law part of the accelerated electrons, and
351
therefore we can deduce the power-law index of electrons from the measured photon index.
352
Using Γ = 1.5±0.1, we obtain se = 2Γ− 1 = 2.0±0.2. The energy flux ratio of the
353
observed synchrotron X-ray emission and the gamma-ray emission means that the average
354
magnetic field is weak, B ' 10µG (Aharonian et al. 2006; Porter et al. 2006; Ellison et al.
355
2010). The maximum energy of electrons is then Ee,max ∼ 20–40 TeV as determined from
356
the Suzaku X-ray spectrum (Tanaka et al. 2008). The presence of synchrotron X-ray fila-
357
ments varying on yearly timescales (Uchiyama et al. 2007), if interpreted as being due to fast
358
electron acceleration and synchrotron cooling, requires B ∼ 0.1–1 mG, which is difficult to
359
reconcile with the weak average field. Alternatively, the X-ray variability may be caused by
360
time-variable turbulent magnetic fields (Bykov et al. 2008) which require a smaller magnetic
361
field strength. The filamentary structures and variability in X-rays should be attributed to
362
locally enhanced magnetic fields in the case of the leptonic model (Pohl et al. 2005).
363
As shown in Fig. 3, several groups have previously presented calculations of IC gamma-
364
ray spectra. Detailed comparisons between the observed total GeV–TeV spectrum and IC
365
models show that none of the previous IC models matches exactly with the data. Some
366
additional complications would need to be introduced to realize a better description of the
367
gamma-ray data. For example, the shape of the total IC spectrum could be modified if we
368
add a second population of electrons (or even multiple populations) which has a different
369
maximum energy (see Tanaka et al. 2008; Yamazaki et al. 2009). Yet another way of modi-
370