Research Collection
Doctoral Thesis
Advancing taxonomic annotation and profiling of microbial communities using marker genes
Author(s):
Milanese, Alessio Publication Date:
2020
Permanent Link:
https://doi.org/10.3929/ethz-b-000479809
Rights / License:
In Copyright - Non-Commercial Use Permitted
This page was generated automatically upon download from the ETH Zurich Research Collection. For more information please consult the Terms of use.
ETH Library
1
DISS. ETH NO. 27137
Advancing taxonomic annotation and profiling of microbial communities using marker genes
A thesis submitted to attain the degree of DOCTOR OF SCIENCE of ETH ZURICH
(Dr. sc. ETH Zurich)
Presented by ALESSIO MILANESE
Laurea magistrale in Bioinformatica e biotecnologie mediche, Università di Verona, Verona, Italy
Born on April 12, 1990 Citizen of Italy
Accepted on the recommendation of Prof. Dr. Shinichi Sunagawa, examiner
Prof. Dr. Julia Vorholt, co-examiner Dr. Georg Zeller, co-examiner
2021
2
3
Content
Abbreviations Summary Sommario
Chapter 1
General introduction
Modern analysis of microbial communities Phylogenetic analyses with marker genes Taxonomy analysis of microbial survey data Benchmarking of taxonomic analysis tools Thesis objectives
Chapter 2
Microbial abundance, activity, and population genomic profiling with mOTUs2
Chapter 3
Machine-learning based hierarchical taxonomic classification of Prokaryotic genes and genomes using STAG
Chapter 4
Additional related projects
Chapter 5
General conclusions and perspective
References
Acknowledgments Curriculum vitae
Content
5 8 11
11 14 16 20 22 29 30
32
34
91 84
134 111
120
126 143 144
4
5
Abbreviations
16S rRNA ANI ASVs BMI CAMI CCR CTR DDH FDR ICR ITS LCA MAG mOTU MG MGC NGS NR OUT SAT
16S ribosomal RNA gene Average Nucleotide Identity Amplicon Sequence variants Body Mass Index
Critical Assessment of Metagenome Interpretation Continuous Calorie Restriction
Control
DNA-DNA hybridization False Discovery Rate
Intermittent Calorie Restriction Internal transcribed spacer Lowest common ancestor
Metagenome-assembled genomes marker gene-based OTU
Marker Gene
Marker Gene Cluster
Next Generation DNA Sequencing Non-Redundant
Operational taxonomic unit Subcutaneous adipose tissue
6 specI
SSU VAT WMS
Species identification tool Small Subunit of the rRNA Visceral adipose tissue
Whole metagenome sequencing
7
8
Summary
Microorganisms are found everywhere on earth and play a prominent role in many natural processes such as nitrogen-fixation and carbon storage for nutrient cycling that are essential for all other living organisms. Their importance is also increasingly being appreciated in the context of human health, with human-associated microbes being differentially abundant in many
diseases. While analyses of microbes in communities were historically restricted to isolated organisms, modern methods allow us to examine an entire community as a whole by
sequencing DNA fragments directly from an environmental sample without a prior culturing step. To obtain a census of the organisms present in a sample, there are currently two well- established techniques:16S ribosomal RNA gene (16S for short) profiling, in which part of this gene is amplified and sequenced; and whole-metagenome sequencing (WMS), where all the DNA from the sample is indiscriminately sequenced. The fundamental bioinformatics task is then to identify which taxa are present in the original microbial community, a process called taxonomic profiling. Taxonomic profiling of microbial communities is an inherently difficult computational problem and -- although many tools have been developed in this area -- the results are still a biased representation of the actual communities, as many studies have shown.
Almost all bioinformatics tools for taxonomic profiling of metagenomic samples rely on reference genomes, which are currently unavailable for a substantial fraction of microbial species. As a consequence, the inferred taxonomic profiles remain incomplete and relative abundances biased. In Chapter 2, I present mOTUs2, a tool based on 10 universal phylogenetic marker genes that allow profiling of both known and unknown species. The resulting taxonomic profiles are more complete and relative abundances more accurate compared to other methods, in particular in less-studied environments. We additionally show that marker genes used by mOTUs2 are essential housekeeping genes, and as such demonstrably well-suited for quantification of basal transcriptional activity of community members. Furthermore, single nucleotide variation profiles estimated using mOTUs2 reflect those from whole genomes, which opens up the possibility of comparing microbial strain populations in a computationally efficient manner.
While mOTUs2 is a tool to quantify microbial species in WMS data, it does not accurately place them into existing taxonomies. For species represented by reference genomes, lineage
information is obtained from NCBI, for species without such a representation, only a
rudimentary procedure is employed to approximately infer their lineages. However, accurate
9
solutions to this taxonomic assignment problem are urgently needed to help make sense of the ever-growing volume of (meta-)genomic sequences --in the form of amplicons, genes, or genomes-- many of them from novel organisms.
To address this problem, I introduce STAG (in Chapter 3), a hierarchical taxonomic classifier for marker gene sequences. The central idea is to formalize the problem of taxonomic annotation as a hierarchical series of binary classifications tasks along the taxonomic tree. The features used by these classifiers are extracted from a multiple sequence alignment of gene families with well- resolved taxonomies. As a result, STAG is able to learn which informative positions accurately discriminate clades. STAG shows high accuracy across taxonomic ranks, outperforming other tools on simulated assignment problems for 16S gene sequences. Additionally, STAG can also be applied to genome sequences, by leveraging a concatenation of 40 universal phylogenetic marker genes. In these evaluations, STAG also exhibits high precision and recall on isolate genomes, and facilitates deeper taxonomic annotation for MAGs from human- and cow rumen- associated microbiomes. Owing to its versatility, STAG can be readily trained and applied to the taxonomic annotation of 16S amplicon profiles, which --when annotated with STAG-- are significantly more similar to corresponding WMS profiles than those annotated with other state-of-the-art tools.
Taxonomic assignment and taxonomic profiling are two essential steps in the study of any microbial community. They provide the basis for further analyses seeking to identify human pathogens, to associate microbes with disease, and to understand the interplay of microbial communities with the host or the biogeochemical environment. In summary, by providing novel computational methodology and showcasing its potential, my work presented in this thesis advanced the state of the art in the taxonomic analysis of microbial communities.
10
11
Sommario
I microrganismi si trovano ovunque sulla terra e svolgono un ruolo fondamentale in molti processi naturali essenziali per tutti gli altri organismi viventi, come la fissazione dell'azoto e lo stoccaggio del carbonio per il ciclo dei nutrienti. La loro importanza relativamente alla salute umana è aumentata sempre più, soprattutto in considerazione del fatto che la quantità di microbi nel corpo umano varia nel caso siano presenti patologie. In passato, le analisi dei microrganismi si limitavano a organismi isolati, oggi invece i metodi moderni ci consentono di esaminare un'intera comunità nel suo insieme tramite il sequenziamento di frammenti di DNA direttamente da un campione ambientale senza una precedente fase di coltura. Per ottenere un censimento degli organismi presenti in un campione, esistono attualmente due tecniche consolidate: 16S ribosomal RNA gene (16S in breve), in cui una parte di questo gene viene amplificata e sequenziata; e il sequenziamento dell'intero metagenoma (WMS, dall’inglese “Whole Metagenome Sequencing”), dove tutto il DNA del campione viene sequenziato indiscriminatamente. Il compito fondamentale della bioinformatica è quindi di identificare quali taxa sono presenti nella comunità microbica originaria, un processo chiamato “taxonomic profiling”. Il profiling delle comunità microbiche è un problema computazionale intrinsecamente difficile e, sebbene molti strumenti siano stati sviluppati in quest'area, i risultati sono ancora una rappresentazione parziale delle comunità attuali, come hanno dimostrato molti studi.
Quasi tutti gli strumenti bioinformatici per il “profiling” di campioni metagenomici si basano su genomi di riferimento, attualmente non disponibili per molte specie. Di conseguenza, i profili tassonomici dedotti rimangono incompleti e le abbondanze relative sono distorte. Nel Capitolo 2, presento mOTUs2, uno strumento basato su 10 geni con proprieta filogenetiche che consentono il profiling di specie note e sconosciute. I profili tassonomici risultanti sono più completi e le abbondanze relative più accurate rispetto ad altri metodi, in particolare in ambienti meno studiati. Mostro inoltre che i geni utilizzati da mOTUs2 sono geni essenziali perché hanno proprietà “housekeeping” e, come tali, sono dimostrabilmente adatti per la quantificazione dell'attività trascrizionale basale dei membri della comunità. Inoltre, i profili di variazione dei singoli nucleotidi stimati utilizzando mOTUs2 riflettono quelli di interi genomi, il che apre la possibilità di confrontare popolazioni di ceppi microbici in modo computazionalmente più efficiente.
Sebbene mOTUs2 sia uno strumento per quantificare le specie microbiche nei campioni WMS, non le inserisce accuratamente nelle tassonomie esistenti. Per le specie rappresentate da genomi
12
di riferimento, le informazioni tassonomiche sono ottenute da NCBI, per le specie senza tale rappresentazione, viene utilizzata solo una procedura rudimentale per inferire approssimativamente la loro tassonomia. Tuttavia, sono urgentemente necessarie soluzioni accurate a questo problema di assegnazione tassonomica per aiutare a dare un senso al volume in continua crescita di sequenze (meta) genomiche - sotto forma di ampliconi, geni o genomi - molte delle quali provenienti da nuovi organismi.
Per affrontare questo problema, introduco STAG (nel Capitolo 3), un classificatore tassonomico gerarchico per annotare geni. L'idea centrale è di formalizzare il problema dell'annotazione tassonomica come una serie gerarchica di classificazioni lungo l'albero tassonomico. Le caratteristiche utilizzate da questi classificatori vengono estratte da un allineamento di sequenze multiple da famiglie genetiche con tassonomie ben risolte. Di conseguenza, STAG è in grado di apprendere quali posizioni informative discriminano accuratamente i diversi taxa. STAG mostra un'elevata precisione tra i ranghi tassonomici, superando altri strumenti su problemi di assegnazione simulata per sequenze di geni 16S. Inoltre, STAG può essere applicato anche alle sequenze del genoma, sfruttando una concatenazione di 40 geni. In queste valutazioni, STAG mostra anche alta precisione e sensitività su genomi isolati e facilita l'annotazione tassonomica per MAG da microbiomi associati all’intestino dei bovini e umano. Grazie alla sua versatilità, STAG può essere prontamente addestrato e applicato all'annotazione tassonomica di dati 16S, che - quando annotati con STAG - sono significativamente più simili ai corrispondenti profili WMS rispetto a quelli annotati con altri profili all'avanguardia utensili.
L'assegnazione tassonomica e il profilo tassonomico sono due passaggi essenziali nello studio di qualsiasi comunità microbica. Forniscono la base per ulteriori analisi che cercano di identificare agenti patogeni umani, di associare i microbi alla malattia e di comprendere l'interazione delle comunità microbiche con l'ospite o l'ambiente biogeochimico. In sintesi, fornendo una nuova metodologia computazionale e mostrando il suo potenziale, il lavoro presentato in questa tesi ha avanzato lo stato dell'arte nell'analisi tassonomica delle comunità microbiche.
13
14
Chapter 1
General introduction
15
Microbes have colonised every niche on earth, surviving at temperatures of >100°C in hydrothermal vents on the bottom of the ocean (Kashsefi et al., 2003), in frozen sea water, and even up to 7km inside Earth’s crust (Rampelotto 2013). They shaped earth for the last 3.7 billion years, playing an essential role in carbon storage and nutrient cycling both in the oceans (Sunagawa et al., 2015) and soil (Bahram et al., 2018). Moreover, microorganisms can be found on and inside all living animals and plants, helping to digest nutrients or opportunistically exploiting and infecting their host. Recent studies have uncovered strong associations between human gut microbes and diseases (like inflammatory bowel disease (Schirmer et al., 2018) or colorectal cancer (Wirbel et al., 2019)), the outcome of immune checkpoint inhibitors (ICIs) therapy for cancer treatment (Routy et al., 2018), and dietary interventions (Zeevi et al., 2015), as well as being able to directly modify orally administered drugs (Zimmermann et al., 2019). In all these diverse environments, microorganisms are typically not living in isolation but instead in communities governed by complex, ecological principles.
One way to analyse microbial communities is to analyse their constituents individually, which can be achieved by growing each organism in isolation. These culture-based methods allow to study the properties of each organism in depth: members of microbial communities can be characterized and differentiated using biochemical and phenotypic assays that target physiological characteristics of bacteria (e.g., Gram staining to differentiate bacteria based on the composition of their cell walls, colony morphology, metabolite production, pathogenicity, and growth in specific media). Naturally, this type of analysis is constrained to organisms that can be isolated and grown in a laboratory setting; thus, past studies of microorganisms were largely limited to easy-growing bacteria without exceedingly hard-to-pinpoint culture conditions (Godfray, 2002). Moreover, due to the trial-and-error nature of optimizing culture conditions, culture-based exploration of microbial communities is a long and laborious endeavour. Thus, many microorganisms remain uncultivated to date. For instance, 70% of the species in the highly studied human gut environment lack a culture representative (Almeida et al., 2020).
Furthermore, in order to better understand microbial communities, we need to study not only the species that make up these communities, but also the communities as a whole (Ratzke et al., 2020).
Culture-based methods to study microbial communities were virtually the only option until the end of the 1980s, when DNA-based, culture-independent methods revolutionized microbiology.
One of the first major applications of culture-free approaches was described by Carl Woese in 1977, which led to the discovery of the Archaea as a new domain of life (Woese & Fox, 1977). By comparing the genetic sequences of the ribosomal RNA gene of different species, he was able to
16
identify a set of organisms that was equally diverse from Bacteria and Eukarya. In the last decade, with the next-generation sequencing revolution bringing down the cost of sequencing (Koboldt et al., 2013), the analysis of microbial communities became increasingly popular. As a consequence, new terms like microbiome (the microorganisms in a particular environment) and metagenomics (the study of genetic material recovered directly from environmental samples) have been coined.
1.1 Modern analysis of microbial communities
1.1.1 Amplicon sequencing
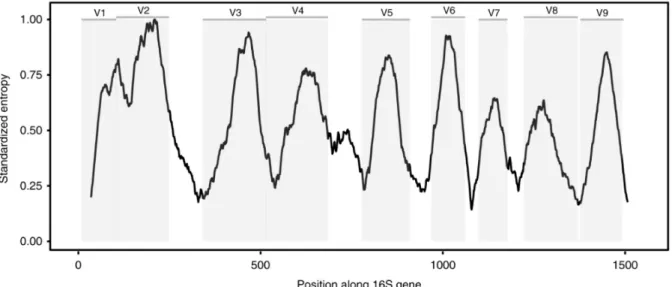
The majority of microbiome studies are (still) based on the sequencing of marker gene amplicons, corresponding to 86% of the ~224k samples collected in the EBI database MGnify (Mitchell et al., 2020). The 16S (or small) ribosomal RNA (rRNA) subunit gene is particularly well-suited for this, as it contains nine hypervariable regions (V1-V9, ure 1.1) ranging from about 50-150 base pairs in length that are interspersed with highly conserved regions that permit the annealing of
"universal" primers (Yarza et al., 2014). Through the use of PCR, we can amplify some hypervariable regions and then sequence the produced amplicon. The 16S rRNA gene is found in all Bacteria and Archaea, making it universal in those kingdoms. To study fungal genomes, either the 18S rRNA or the internally transcribed spacer (ITS) regions are used instead. Importantly, for taxonomic profiling of communities, amplicon sequences can be used as representatives for whole genomes: by identifying unique sequences and counting their occurrences, it is possible to infer which taxa are present and their relative abundance.
Figure 1.1: Variable and conserved regions of the 16S rRNA gene. Conserved regions are targets for universal PCR primers, while the variable amplified regions are used to evaluate the population diversity. The Shannon entropy displayed is calculated from the alignment of all the species contained in the Greengenes database (DeSantis et al., 2006). Adapted from (Johnson et al., 2019).
17
Modern sequencing by synthesis is not working perfectly, thus 16S sequences obtained with those technologies contain errors. If two sequences differ by only one nucleotide, it is unclear whether they are different sequences, or if this difference is caused by a sequencing error.
Moreover, it is unclear what these sequences represent. In fact, different regions of the 16S rRNA gene have different evolutionary rates in different clades (Mysara et al., 2017). As a result, it can happen that two different species from two different families have the same variable region sequence, or, that the same species have different sequences for different strains. In the first case, the “unique” sequences would represent a family, while in the second case, it would represent a strain. The most common solution to these issues is to cluster sequences that are similar, based on a sequence identity cutoff (which is usually between 95% and 99% nucleotide identity), yielding clusters referred to as Operational Taxonomic Units (OTUs) (Schloss et al., 2011). OTUs represent taxonomic clades obtained from a sample and can typically resolve clades at the genus level.
A related approach has been introduced in recent years, which attempts to infer original biological sequences (prior to the introduction of amplification and sequencing errors) from amplicon sequencing data using statistical models of the sequencing noise (Callahan et al., 2016;
Edgar 2016; Amir et al., 2017). These so-called amplicon sequence variants (ASVs) that are obtained from these methods can be used instead of OTUs. While OTUs are clusters of sequences that are sample- or study-specific, ASVs more robustly correspond to discrete biological units that can be more readily compared between samples (Callahan et al., 2017). The use of ASVs is becoming a de-facto standard (replacing OTUs), with the most popular tool, DADA2 (Callahan et al., 2016), having been cited more than 2,500 times since 2016.
Another approach to quantify organisms in a community makes use of high quality databases of 16S reference sequences, of which the three most popular are GreenGenes (McDonald et al., 2012), Silva (Yilmaz et al., 2014) and the RDP database (Wang et al., 2007): each read is mapped to a database and clade abundances are calculated based on read assignments. We refer to this method as closed-reference clustering. In Silva’s latest release, sequences of the small subunit of the rRNA gene (SSU 138) represent more than 500,000 “species” (Ref NR 99, high quality OTUs clustered at 99% identity). The closed-reference approach is suited to characterise well-studied microbial communities, where the majority of the diversity is covered by reference sequences.
Yet, a largely unknown community is better characterized with OTUs or ASVs. In an intermediate approach, referred to as the open-reference approach, reads are mapped against reference sequences, and the reads that do not map are clustered into OTUs.
18 1.1.2 Whole metagenome sequencing
Owing to the development of sequencing machines with higher throughput and a concomitant decrease in sequencing costs, studying the full genetic complement of microbial communities through whole metagenome shotgun (WMS) sequencing has become feasible and continues to gain popularity. This type of analysis is often referred to as metagenomics, and a typical metagenomic sample nowadays contains millions of short reads (generally 50–200 nt).
While amplicon sequencing is typically limited in taxonomic resolution to the genus level, WMS allows to profile species and even resolve strains due to extended sequence space which can be analysed for discriminating variants (Schloissnig et al., 2012; Costea et al., 2017; Karcher et al., 2020). Resolution is particularly important when comparing the human gut of healthy and diseased people, as the differences are related only to a few species (Zeller et al., 2014) and the interaction between microbes and host tissue can be strain-specific (Bron et al., 2012). Moreover, while amplicon analysis is suitable for assessing community composition, WMS facilitates analyses of the functional potential of microbial communities. In this regard, metatranscriptomic approaches are closely related, as they involve shotgun sequencing of the (reverse-transcribed) RNA transcriptome. With metatranscriptomic sequencing, it is possible to not only assess the functional potential, but also gene activity, thus empowering assessments of community function.
When analyzing metagenomic data, there are different strategies to computationally infer the organisms present in the sample (Figure 1.2). A straight-forward and intuitive approach is to map reads to a reference database in order to identify which known species and functions are present.
This approach is conceptually similar to the closed-reference approach described for amplicon data, and it is the strategy employed by most existing tools for shotgun metagenomic analysis (Truong et al., 2015; Franzosa et al., 2018; Wood et al., 2014). However, mapping reads to reference genomes is not always a sensible way to analyse data, because (i) it can be computationally demanding, (ii) reads can map to multiple regions in the same or in different genomes, and (iii) not all organisms have previously been isolated and thus will have no reference genome available. Alternatively, in a computationally more involved approach, reads can be assembled into contigs using metagenome-specific assembly tools (Nurk et al., 2017; Li et al., 2015). From the resulting contigs, it is possible to predict open reading frames (Hyatt et al., 2010) to delineate the gene pool of the community under study. Extending this approach to many samples from a specific environment enables the construction of gene catalogs (Li et al., 2014;
Xiao et al., 2015). These gene catalogs have been instrumental for functional analyses of microbial communities. Recent advances in assembly algorithms have enabled large-scale reconstruction of near-complete genome sequences (Parks et al., 2017; Pasolli et al. 2019; Almeida et al., 2019;
19
Nayfach et al., 2019). This additionally involves pooling contigs inferred to be from the same genome together in a so-called "binning" step. The resulting near-complete genome sequences are called metagenome assembled genomes (MAGs). It is clear that constructing MAGs offers many advantages, allowing to study the genome of organisms that have not been sequenced yet.
Moreover, it allows gene functions to be linked to the organism(s) carrying them out, which is difficult in gene catalogs. However, MAG reconstruction is limited to more abundant organisms as linking contigs with low coverage does not work well. Yet, lower coverage still permits the reconstruction of shorter contigs containing single or a few genes, thus gene catalogs currently are still more genetically comprehensive than MAGs.
Figure 1.2: Analysis of metagenomic samples is conducted using three main approaches of increasing complexity. In the simplest approach, reads are mapped directly to available reference genomes. This approach is blind to reads coming from organisms not represented in the reference database (in this case the orange genome is ignored). A more sophisticated approach involves assembling reads into contigs, in order to discover genes from new species (orange genome).
Note that lowly abundant organisms might be missed by this method (yellow genome). Finally, it is possible to reconstruct near-complete genomes, but only from high-quality contigs (due to lack of coverage, the orange genome was omitted).
20
1.2 Phylogenetic analyses with marker genes
Globins were among the first proteins to be sequences, and hence had a fundamental role in the molecular analysis of phylogenies: the first ever molecular tree was built by Dayhoff and colleagues using the sequences of 13 globins from different species (Dayhoff et al., 1975).
Through the course of the 1970s, many more protein sequences from different families have been produced. Some proteins, like cytochrome c evolve very slowly, while other protein families accumulate many more mutations. These observations led to the formulation of the molecular clock hypothesis (Zuckerkandl et al., 1963), which states that for every given gene (or protein), the rate of molecular evolution is generally constant. After the invention of Sanger sequencing (Sanger & Coulson, 1975), gene sequences have also been widely used to study phylogenies, especially for closely related organisms (Pevzner, 2009).
A good marker gene should be present in every organism (i.e. be universal), and should differ between clades proportionally to their evolutionary distance (i.e. its sequence needs to be sufficiently diverged and should generally not have undergone horizontal transfer). If these requirements are met, comparisons of two organisms based on the percentage identity of the sequences of the corresponding marker genes is expected to yield a good approximation of their genomic divergence. Additionally, multiple sequence alignments (MSAs) of the marker gene sequences from many species facilitate additional, more in-depth analyses, such as phylogenetic tree reconstruction (Feng et al., 1987).
Regarding microbial communities, the 16S rRNA gene is the main marker gene used for phylogenetic comparisons of bacteria and archaea. Even when the cost of sequencing has dropped low enough to sequence entire genomes, marker genes are still being used to analyze microbiomes. In fact, comparing entire genome sequences is computationally demanding and the available genomes are often incomplete. Moreover, parts of genomes can be under different selective pressures or even of different evolutionary origin than the core genome, while good marker genes more accurately reflect the evolutionary history of organisms. As the cost of sequencing has continued to decrease, it is now possible to sequence DNA derived from entire microbial communities and reconstruct entire genomes from the resulting metagenomic reads.
This has opened up the possibility of using multiple marker genes to obtain higher resolution when comparing organisms (Ciccarelli et al., 2006).
With the increasing availability of prokaryotic genomes, more marker genes have been discovered. In particular, it became possible to use multiple marker genes in combination to improve the accuracy of species similarity evaluations (Hug et al., 2016). In an early landmark
21
study (Ciccarelli et al., 2006), 31 marker genes have been identified and used to build a tree of life spanning all three domains of life (enabled by the selection of marker genes that are universal not only among bacteria, but also among eukaryotes and archaea). In particular, these marker genes were chosen for their universality and low frequency of horizontal transfer. More recent studies that reconstructed the tree of life were also based on marker genes (Hug et al., 2016); in that latter case 16 ribosomal protein genes were used.
Marker genes have been used also to improve the delineation of prokaryotic species (Mende et al., 2013). For prokaryotes, the concept of “species” is still not well defined (Van Rossum et al., 2020), and historically, has been largely based on 16S sequences comparisons, phenotypic features, and pathogenicity. A definition of species that agrees with genomic distances was proposed in (Mende et al., 2013), and it is based on 40 universal MGs (including those by Ciccarelli et al. mentioned above). Mende et al. started by identifying these marker genes in each of 3,496 prokaryotic genomes. For each marker gene, they calculated the pairwise distance between all genomes and combined them using a length-weighted average. Using average-linkage clustering on the combined distance metric led to 1,753 species clusters, also named specI clusters by the authors, which were defined by an MG alignment identity cutoff that maximize congruence with existing taxonomies. An advance over this has been made by the introduction of the GTDB taxonomy (Parks et al., 2018). This study attempted to redefine the whole prokaryotic taxonomy by basing it entirely on genetic distances. This approach uses a concatenation of 120 marker genes that are present in all bacterial species.
An additional application of MGs, in which even more marker genes are used, is for the evaluation of contamination in assembled genomes, such as MAGs (Parks et al., 2015; Saary et al., 2019). By analyzing marker genes that are present only in some specific clades, chimeric genome assemblies can be identified as ones that contain marker genes derived from multiple distinct clades, for example. Alternatively, when constructing MAGs, some part of the genome might be missing, and this can also be assessed on the basis of marker genes: If a MAG is assigned to a specific clade, but misses half of this clade’s marker genes, it is an indication that the MAG is only half complete.
Marker genes can also be used to improve the identification of species in metagenomic samples, a topic that will be discussed in depth in the next section.
22
1.3 Taxonomic analysis of microbial survey data
Thousands of different microbial species exist, and in order to make sense of those, scientists have named and classified those bacteria using taxonomies. Taxonomies are essential tools for describing microbial diversity, comparing metagenomic data between different studies, and communicating scientific results (Godfray, 2002). Usually, when analyzing microbial communities, there are seven taxonomic levels analyzed: Kingdom, Phylum, Class, Order, Family, Genus and Species. At least five distinct taxonomies and taxonomic databases are commonly used for microbiome analysis at the time of writing: GreenGenes (McDonald et al., 2012), Silva (Yilmaz et al., 2014) and RDP (Wang et al., 2007) used for amplicon sequences and the NCBI taxonomy (Federhen 2012) and GTDB (Parks et al., 2018) for genomes. While they all agree in many structural features and are in principle based on the Bergey taxonomic manual (Whitman et al., 2015), there are still considerable disagreements in the structures and names of many clades (Balvočiūtė et al., 2017) – not least because the diversity of known prokaryotes still increases rapidly and changes in the names and assignments of taxa to clades occur frequently (Murray et al., 2020).
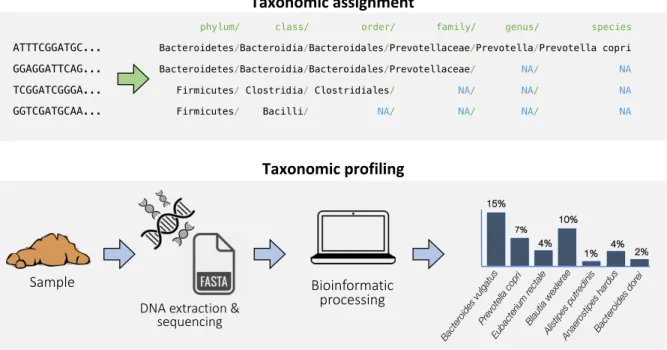
Taxonomic analysis of microbiome data entails two similar, yet distinct tasks (Figure 1.3). The first one, taxonomic assignment, is the process of assigning taxonomic labels to biological sequences, which can be reads, genes or genomes, for example. The second, taxonomic profiling, refers to the process of estimating relative cell counts in a microbiome sample, that is inferring which species are present and their relative abundances. The starting point of the former task are individual sequences, whereas taxonomic profiling is only applicable to readouts of an entire microbial community, such as a metagenome.
Taxonomic profiling and assignment are fundamental steps in any microbiome analysis. The former is the basis for any cross-sectional study aiming to discover association between gut microbiome compositional changes and disease such as colon cancer (Zeller et al., 2014), IBD (Gevers et al., 2014), and many others (Duvallet et al., 2017). The latter is essential to annotate novel species and genes that allow to discover bioactive molecules like novel antibiotics (Garcia- Gutierrez et al., 2019) and novel bioactive compounds (Suneja et al., 2019).
23
Figure 1.3: Examples of taxonomic assignment and taxonomic profiling.
1.3.1 Tools for taxonomic assignment
Classical approaches for taxonomic assignment of metagenomic sequences are based on alignment to a set of reference genome sequences. Consequently, similarity thresholds can be optimized to find the correct taxonomic rank to annotate the sequence with (e.g., two sequences that are at least 90% identical are expected to belong to the same genus). These “distance-based”
methods work reasonably well if the sequences are similar enough to the reference examples.
However, the thresholds perform poorly at taxonomic ranks above genus. Early taxonomic assignment methods relied on BLAST (Huson et al., 2007); however, these approaches soon became impractical with the increasing number of metagenomic reads and reference genome sequences. To make computations practically feasible, several tools that use k-mer spectrum comparisons instead of full alignments have been proposed (Marçais & Kingsford, 2011; Kokot et al., 2017; Erbert et al., 2017). A k-mer represents a substring of length k, and when we talk about
“k-mers”, we refer to all possible substrings of length k in a sequence. The idea is that by comparing k-mer frequencies between a query sequence and a reference genome one can obtain a very fast approximation of the true sequence dissimilarity.
Another approach, so-called phylogenetic placement (Matsen et al., 2010), attempts to directly place a new sequence into an existing phylogenetic or taxonomic tree. Instead of relying on sequence similarity, these approaches use principled statistical methodology (maximum likelihood estimation) to determine the optimal insertion branch for a query sequence on the
Taxonomic assignment
Sample
Bacteroides vulgatus Prevotella copri
Eub acterium
rectale Blautia wexlerae
Alistipes putredinis 15%
7%
4%
10%
1% 4%
2%
Anaerostipes hardus Bacteroides dorei
DNA extraction &
sequencing
Bioinformatic processing
phylum/ class/ order/ family/ genus/ species ATTTCGGATGC... Bacteroidetes/Bacteroidia/Bacteroidales/Prevotellaceae/Prevotella/Prevotella copri GGAGGATTCAG... Bacteroidetes/Bacteroidia/Bacteroidales/Prevotellaceae/ NA/ NA TCGGATCGGGA... Firmicutes/Clostridia/ Clostridiales/ NA/ NA/ NA
GGTCGATGCAA... Firmicutes/ Bacilli/ NA/ NA/ NA/ NA
Taxonomic profiling
24
given reference tree. These models can incorporate detailed information about the evolutionary history of the gene under study which can greatly improve assignment accuracy. Despite recent improvements (Czech et al., 2018), this approach is still slow and relies on a high-quality, often manually curated reference phylogenetic tree (selection of reference sequences and visual inspection of the resulting tree).
So far, we have discussed the different methodology for approaching the taxonomic assignment problem. However, many existing tools have been developed for one specific type of input sequences: reads, genes and genomes. To annotate arbitrary metagenomic reads or contigs, k- mer based methods are very popular (Wood et al., 2014; Menzel et al., 2016, McHardy et al., 2007). Conceptually similar approaches also exist for the analysis of 16S amplicon reads (Wang et al., 2007; Lu et al., 2020). Genes are often compared via distance-based methods, and phylogenetic placement methods are often employed for specific genes or for a small set of genes.
Analysis of genomes is either based on concatenation of marker genes or on distance-based methods which take entire genomes as input. For example, BAT (Bin Annotation Tool) is a tool based on gene similarities, designed to classify MAGs (von Mejienfeldt et al., 2019). The average nucleotide identity (ANI) metric represents the degree of genomic similarity shared by two genomes. ANI is employed to compare closely related species, but often cannot be used to compare distantly related organisms (e.g., those in different families). Due to the various strengths and limitations of these approaches, it makes sense to combine them for specific tasks.
The GTDB-Tk (Chaumeil et al., 2019), for instance, combines phylogenetic placement for assigning a genome to ranks ranging from kingdom to genus, with ANI, which provides refined species assignments.
1.3.2 Tools for taxonomic profiling of amplicon data
Even though taxonomic assignment and taxonomic profiling are addressing different objectives, both tasks are closely related in that methods for taxonomic profiling use internal taxonomic assignment procedures. A conceptually straightforward approach for taxonomic profiling of metagenomic reads is to try and annotate all sequenced reads to count the number of reads mapping to each clade. The obtained read counts then represent a – simplistic – proxy for cell counts in the source microbial community. This is the standard approach for taxonomic profiling based on 16S amplicon data (close-reference approach, section 1.1.1).
The close-reference approach tends to work well for amplicon data, since all reads belong to only one marker gene with a conserved length, and as a consequence, the estimated read counts are approximately proportional to the corresponding bacterial organisms in the community.
25
However, the number of 16S rRNA gene copies varies across genomes in a range from 1 to 15 for bacteria (Stoddard et al., 2015). Since precise copy numbers are only known for a few species, correcting for 16S rRNA gene copy numbers remains an unsolved problem (Louca et al., 2018).
Additionally, the PCR amplification step introduces additional quantification biases (Quail et al., 2012), and some primers amplify some clades more effectively than others (Klindworth et al., 2013). Due to the amplicon length being restricted in length to a few hundred nucleotides by PCR, the resulting sequence space is limited making it difficult to resolve taxonomic profiles from 16S amplicons beyond genus-level. One clear advantage of the amplicon approach is its cost- effectiveness: despite dropping sequencing costs, it is still about an order of magnitude cheaper than WMS. An additional advantage relates to computation complexity. While amplicon sequencing tends to produce volumes of data that can be managed and analyzed on a laptop computer, the storage and analysis of WMS data often requires significantly more computational resources (e.g., a few hundred Gigabytes of storage alone and often much larger amounts of memory and CPU time).
Several tools have been developed for taxonomically profiling of amplicon surveys (Almeida et al., 2018; Prodan et al., 2020), but almost all are based on k-mer comparisons. The first tool that used k-mers is the RDP classifier (Wang et al., 2007), which is still widely used. Different re- implementations of the same concept are present in modern pipelines for amplicon data analysis, including DADA2 (Callahan et al., 2016), QIIME (Caporaso et al., 2010; Bolyen et al., 2019) and Mothur (Schloss et al., 2009). Another interesting solution which also makes use of k-mers is MAPseq (Rodrigues et al., 2017). Instead of comparing only the best hit in the database, it improves the precision of assignment by looking at multiple matching sequences. As a result, MAPseq increases the F1-score of assignments, despite being more conservative.
1.3.3 Tools for taxonomic profiling of WMS
While amplicon sequencing is limited in resolution, from shotgun sequencing data, species, subspecies (Costea et al., 2017) and even strains (Truong et al., 2017) can be identified. The naïve method of annotating each read in a shotgun metagenome to obtain a taxonomic profile also works for shotgun sequencing samples, but there are some additional considerations. First, there is a computational complexity problem: WMS samples have 2 or 3 orders of magnitude more reads than amplicon samples, and hundreds of thousands of full-length reference genomes exist, to compare reads to. Second, reads from conserved regions can map equally well to many reference sequences, belonging to the same or different genomes. While this results in a counting problem, it also tends to result in many false positive taxon assignments due to the huge volume of reads. Third, simple read counts do not account for differences in genome length. A genome
26
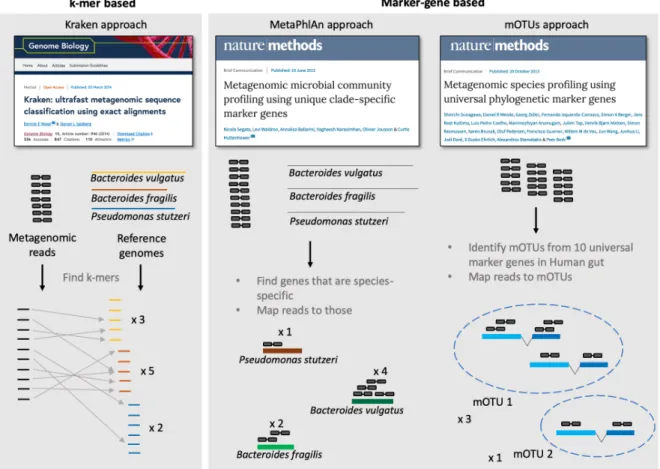
that is 4 Mb in size will have double the number of reads compared to a 2 Mb genome with the same read coverage, but arguably, when profiling a microbial community, we are more interested in the read coverage as it is a better approximation of the number of cells per species in the community (Raes et al., 2007). In order to solve these issues, many tools have been developed (Sczyrba et al., 2017), which can largely be subdivided in two categories (Figure 1.4): k-mer based methods, which map all reads efficiently to all genomes; and marker-gene based methods, which use only a subset of reads, namely those that map to a set of marker genes (Liu et al., 2011; Segata et al., 2012; Sunagawa et al., 2013).
Figure 1.4: Exemplary tools for taxonomic profiling of metagenomic samples. K-mer based methods annotate each read and derive a taxonomic profile from the taxonomic assignments of these sequences. Marker-gene based methods only make use of those reads that map to a set of predefined marker genes. MetaPhlAn is mostly based on clade-specific marker genes, whereas mOTUs uses universal single-copy phylogenetic marker genes.
As a prominent representative of k-mer based approaches, Kraken (Wood et al., 2014) was specifically designed for taxonomic assignment of metagenomic reads. Despite being a taxonomic annotation tool, it is also widely used for profiling (Ye et al., 2019). Given a query sequence (in this case, a read), for each k-mer in the sequence, the algorithm finds the lowest common ancestor (LCA) among genomes in the database. Finally, the clades that gather most of the k-mers are the one selected for annotation. Kraken, like all k-mer approaches, is extremely fast compared to
27
other mapping methods. In order to compare k-mers efficiently, all k-mers from all genomes need to be kept in memory at all times, resulting in a high memory requirement, which can easily exceed 100Gb (Ye et al., 2019). This is partially improved by KrakenUniq (Breitwieser et al., 2018) and CLARK (Ounit et al., 2015), where genomic k-mers that are shared between any two species are removed, hence lowering the memory requirement. Since the k-mers form the query sequence do not map to multiple genomes, this also increases the accuracy of assignments.
Kraken2 (Wood et al., 2019) and Centrifuge (Kim et al., 2016) rely on algorithmic improvement to reduce memory requirements further by up to 85% compared to Kraken.
Despite technical improvements, all k-mer methods tend to have a high recall accompanied by a high false positive rate. In fact, if even just a handful of reads map to a genome, that genome will end up with nonzero abundance in the final taxonomic profile. A possible solution for this is to remove clades with low read counts (Ye et al., 2019). Unfortunately, it is not clear how to decide on an appropriate cutoff when analyzing real-world data in the absence of a ground truth, which just exists for simulated benchmarking data. Another issue is still unsolved: all of these tools map all reads to all genomes (or the unique parts thereof), but do not consider the lengths of these genomes. As a result, the relative abundances calculated are skewed towards longer genomes for the reasons illustrated above. To the best of my knowledge, there is only one k-mer based tool that was designed to do taxonomic profiling and not taxonomic assignment: Bracken (Bayesian Re-estimation of Abundance after Classification with KrakEN) (Lu et al., 2017) uses the taxonomic assignments produced by Kraken, along with information about the genomes, to calculate more accurate species relative abundances.
A conceptually different set of tools for taxonomic profiling of metagenomes uses marker genes (Figure 1.4). The underlying idea is to identify marker genes from a set of reference genomes and map reads to these genes, instead of the full-length genome sequences to benefit from the conceptual advantages, which I have discussed in detail in section 1.2. Moreover, using marker genes (which only represent a small percentage of the entire genome) it is possible to calculate an optimal alignment (or mapping) on full-length reads without the need for heuristic and less accurate k-mer approaches. Despite calculating an optimal alignment, the memory and time requirements are typically an order of magnitude lower than for most k-mer based methods (Ye et al., 2019). By using the entire read sequence (instead of k-mers) and only a small, very informative part of the genome, high precision can be achieved. As expected, these tools have lower recall than k-mer based methods in particular for taxa with very low abundance in the sample. This is because, if only a handful of reads are available from one species, they are more readily picked up by Kraken, but are less likely to map to any marker gene. Apart from these lowly
28
abundant species, the majority of taxa in a sample can safely be retrieved using a sufficient number of marker genes (Milanese et al., 2019).
The first tool to use marker genes for taxonomic profiling was MetaPhlAn (Segata et al., 2012).
MetaPhlAn uses clade-specific, rather than universal, marker genes. Conceptually, bacterial taxa are quantified based on the abundance of genes that are unique to them as is determined during database construction by phylogenomic analysis. If a read maps to any of those genes, then that specific clade must be present in the metagenomic sample. Updated versions of MetaPhlAn (Truong et al., 2015) have extended this concept and the database to also enable profiling of some unicellular eukaryotes and some viruses. In many evaluations, MetaPhlAn proved to reach very high precision (Sczyrba et al., 2017) in taxonomic profiling, probably owing to constant improvements of its database and marker gene set with the increasing availability of prokaryotic reference genomes. As a slight disadvantage, clade-specific marker gene sets are somewhat operationally defined and can change over time. These genes, in contrast to universal markers, are moreover not suitable for phylogenetic analyses of the microbial taxa profiled and their use for meta-transcriptomic analyses is conceptually less appealing than universal genes that tend to be housekeeping genes with more constant expression.
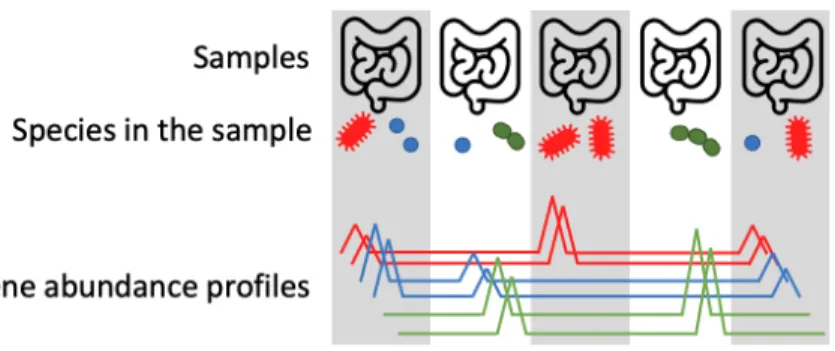
A second marker-gene based tool is mOTUs (Sunagawa et al., 2013), which makes use of ten universal, single-copy marker genes. The selected 10 marker genes are a subset of the phylogenetic MGs used to define specIs (Mende et al., 2013), thus leveraging the molecularly consistent species definition of the latter. Inspired by 16S open-reference analysis approaches, mOTUs can be seen as an extension of the specI clustering in which marker gene sequences directly assembled from shotgun metagenomes are used as well. In this way, mOTUs enable the measurement of unknown species from metagenomic samples. In order to extract the 10 MGS from metagenomic samples, Hidden Markov Models were trained to identify these sequences from pre-assembled contigs. For every marker gene, the sequences with a similarity above a MG- specific cutoff were then clustered and called a marker gene cluster (MGC). Note that the clustering creating the MGCs is performed separately for each marker gene, as genomic linkage information is lost during shotgun sequencing. Hence MGCs from different marker genes have to be linked, e.g. it has to be inferred which of them originated from the same species. In order to do so, one can take advantage of the property that genes that come from the same genome are expected to co-vary in their abundance across microbiome samples (Nielsen et al., 2014) (Figure 1.5). Hence, a correlation-based clustering algorithm is employed to link MGCs into the so-called mOTUs. In the initial study, a database of mOTUs has been built for 263 human gut metagenomic samples to be used for profiling new samples from the same environment. Note that the database
29
was pre-computed and could not be extended, hence the mOTUs profiler is only able to quantify the pre-defined mOTUs. The initial version of the mOTU profiler made an additional database available, which contains species from reference genomes (but excluding the mOTUs extracted from the metagenomic samples).
Figure 1.5: Genes that come from the same species are expected to co-vary in their abundance across samples. Each line in the bottom graph represents the relative abundance of one gene (in this case there are 6 genes, two for each species). The read coverage of the two red genes co- varies across multiple samples. This information can be used to link these genes, i.e. by inferring that they belong to the same species, even though a proper name cannot be assigned to that unknown species like this. This concept, initially proposed by (Nielsen et al., 2014), of linking by co-variance has been successfully applied in other contexts as well, for example for linking contigs into MAGs. Figure adapted from (Nielsen et al., 2014).
1.4 Benchmarking of taxonomic analysis tools
The number of available tools for analyzing metagenomic data is growing proportionally with the increasing popularity of microbiome studies. In order for the scientific community to select the best tool for the task at hand, good benchmarks are necessary. Every time a new tool is published, an evaluation with other methods is provided, showing improvement over different aspects, for example accuracy of the measures or computational advancements. However, these evaluations are often hard to compare since few tools are used, the performance criteria are different and benchmark datasets vary. Regarding taxonomic analysis of microbiome data, some publications have been focused on benchmarking as many tools as possible: for taxonomic profiling of metagenomes (Sczyrba et al., 2017; Lindgreen et. al., 2016; McIntyre et al., 2017), for taxonomic assignments (Ye et al., 2020) and for specialised cases like identifying pathogens in human tissue (Gihawi et al., 2019).
The benchmarks for taxonomic profiling of metagenomic data are mostly based on bioinformatic simulations, where reference genomes are used to simulate reads. An alternative approach involves generating synthetic communities in vitro where the abundances of microbes are defined and known. One can then compare the abundance estimates obtained for these samples
30
with different tools against the ground truth. A drawback of these mock communities is that the number of species that can be grown together is usually limited to less than 30 (Bokulich et al., 2016), making the task of inferring the correct abundances too easy compared to real communities from human gut or oceans composed of thousands of species (Milanese et al., 2019).
Both simulated and mock communities rely on known species, but real microbial communities contain unknown organisms. The so-called microbial dark matter (Rinke et al., 2013) can vary from few unknown species in simple and well-studied communities (for example the human vagina (Milanese et al., 2019)) to the majority of species in biomes like soil (Bahram et al., 2018).
A good simulation should take this into account and add sequences that cannot be recognised by the tools that are being benchmarked. A common way to do this is to remove some sequences from the training database for the tools, and test how these sequences are classified. Since the taxonomy that the tools are trying to predict has a hierarchical structure, it is reasonable to take this into account when removing sequences. In particular, a leave-one-clade-out approach would remove all the sequences from a clade from a specific level, so that it is possible to evaluate the tools behaviour at different taxonomic levels. For example, by removing all sequences from the genus Prevotella from the training set, it is possible to test if a tool correctly predicts those sequences till family level, but not any further. A similar approach was used in the Critical Assessment of Metagenome Interpretation (CAMI), a community-driven initiative for the evaluation of tools for metagenomic analysis (Sczyrba et al., 2017). For their evaluation, they bioinformatically simulated reads from ~700 unpublished isolate genomes to mimic microbial dark matter.
1.5 Thesis objectives
Despite the plethora of tools developed, the taxonomic profiles generated today are still biased reflections of the actual community composition (Sinha et al., 2017; Costea et al., 2017). Reference genomes are still lacking for many species even from widely studied environments such as the human gut (Almeida et al., 2020), and the bioinformatic problem of taxonomic assignment and profiling is inherently difficult (Sczyrba et al., 2017). The main objective of this thesis therefore was to improve over the state of the art for taxonomic analysis of microbiome data with the premise of using marker genes that have proven to be excellent representations of whole genomes and, in particular, have very suitable phylogenetic properties.
1.5.1 High resolution species profiling of metagenomic samples
mOTUs (Sunagawa et al., 2013) was primarily developed to profile fecal samples in a reference- independent manner using universal, single-copy marker genes (Ciccarelli et al., 2006). Despite
31
its benefits, there were two main shortcomings with mOTUs: First, the tool did not make direct use of reference genomes, of which the NCBI genome database contains more than 250,000 to date. Second, it was only based on 263 human gut samples, limiting its applicability to this environment. In Chapter 2, I describe how we improved over this first version of mOTUs by developing a tool and a concomitant reference database that represents additional environments, by improving the linking algorithm for multiple biomes. In a collaborative work, we fully integrated reference genome-based and reference-independent profiling. While doing so, I moreover improved the code-base to make the tool more robust and easier to use. Finally, I co- led the exploration of its applicability to trace general transcriptional activity from meta- transcriptomic data. This work resulted in mOTUs2 (Milanese et al., 2019), a tool for taxonomic profiling of metagenomic samples that can precisely identify and estimate the relative abundance of known and unknown prokaryotic species. I am the first of two co-first authors of the manuscript describing mOTUs2, reflecting my overall role and lead in its implementation and contributions to all aspects of the work (see also Author contribution section on page 47).
1.5.2 Hierarchical marker gene taxonomic classifier
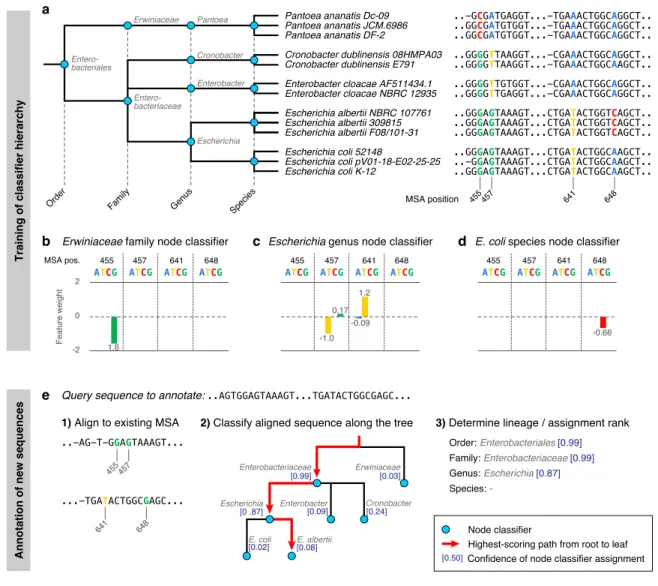
With this project we aimed to develop a new taxonomic classification method, which combines the advantages of computational efficiency know from classical approaches (including ones based on k-mer statistics (Wang et al., 2007; Wood et al., 2014)), with the accuracy of computationally more demanding phylogenetic placement methods (Matsen et al., 2010). To obtain assignment accuracy competitive with the latter class of tools, we transformed the taxonomic annotation problem into a hierarchy of classification problems, which we solved using state-of-the-art machine learning approaches. These machine learning models exploit similarly rich information from a marker gene alignment as is used in phylogenetic placement, which goes well beyond k- mer comparisons. The resulting tool, a very flexible applicable taxonomic classifier for (marker) gene sequences called STAG, is presented in Chapter 3. I am the first author of the manuscript describing STAG, for which I developed and tested the tool. The algorithm and conceptional approach for STAG were conceived in collaboration with Georg Zeller. I designed the evaluations, which were then implemented in collaborative effort.
1.5.3 Applications of taxonomic analysis tools
In Chapter 4, I present four projects where I apply the concept and tools I developed to analyse microbial communities and how the resulting taxonomic profiles can be integrated with orthogonal data types characterising community function, such as transcriptomic and metabolic data. I will show how we can extend the mOTUs framework to study gene activity in metatranscriptomic data and how this can yield biologically relevant insights into community
32
dynamics and metabolic interactions. Also, I will present a study in which we compare taxonomic profiles of gut microbiomes to host metabolites, revealing surprising effects of dietary interventions on microbial communities and putative links between microbes and health- associated molecules. I am co-author of four manuscripts (three already published and one in submission), in which I had the role of analysing microbiome data including 16S amplicon, metagenomic and metatranscriptomics. These applications show that I can successfully apply my technical skills not only to develop tools, but also to analytically interpret complex datasets.
33
34
Chapter 2
Microbial abundance, activity, and population genomic profiling with mOTUs
Alessio Milanese1,*, Daniel R Mende2,*, Lucas Paoli3,4, Guillem Salazar3, Hans-Joachim Ruscheweyh3, Miguelangel Cuenca3, Pascal Hingamp5, Renato Alves1,6 , Paul I Costea1, Luis Pedro Coelho1, Thomas S B Schmidt1, Alexandre Almeida7,8, Alex L Mitchell7, Robert D Finn7, Jaime Huerta-Cepas1,9, Peer Bork1,10,11,12, Georg Zeller1,#, Shinichi Sunagawa3,#
1 European Molecular Biology Laboratory, Heidelberg, Germany
2 Daniel K. Inouye Center for Microbial Oceanography Research and Education, University of Hawai’i at Manoa, Honolulu, USA
3 Department of Biology, ETH Zurich, Zurich, Switzerland
4 Department of Biology, École normale supérieure, Paris, France
5 Aix Marseille Univ, Université de Toulon, CNRS, IRD, MIO UM 110, 13288, Marseille, France
6 Candidate for Joint PhD degree from EMBL and Heidelberg University, Faculty of Biosciences
7 European Molecular Biology Laboratory, European Bioinformatics Institute (EMBL-EBI), Wellcome Genome Campus, Hinxton, United Kingdom
8 Wellcome Trust Sanger Institute, Wellcome Genome Campus, Hinxton, United Kingdom
9 Centro de Biotecnología y Genómica de Plantas, Universidad Politécnica de Madrid (UPM) - Instituto Nacional de Investigación y Tecnología Agraria y Alimentaria (INIA), Campus de Montegancedo-UPM, 28223- Pozuelo de Alarcón (Madrid) Spain
10 Max Delbrück Centre for Molecular Medicine, Berlin, Germany
11 Molecular Medicine Partnership Unit, Heidelberg, Germany
12 Department of Bioinformatics, Biocenter, University of Würzburg
* contributed equally
# corresponding authors
35
Abstract
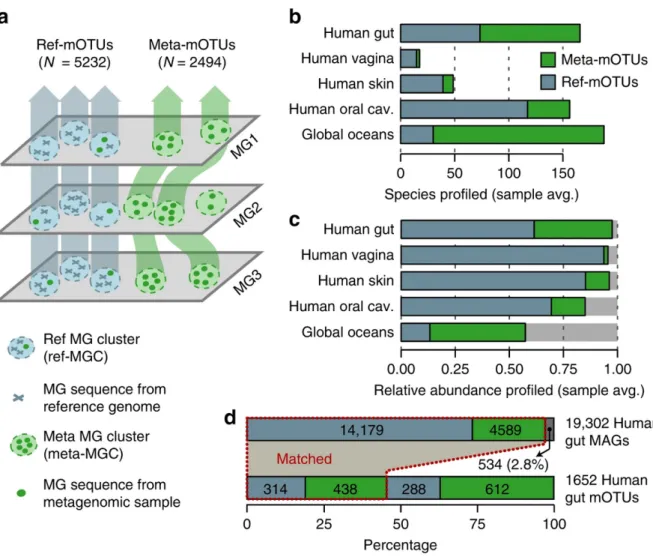
Metagenomic sequencing has greatly improved our ability to profile the composition of environmental and host-associated microbial communities. However, the dependency of most methods on reference genomes, which are currently unavailable for a substantial fraction of microbial species, introduces estimation biases. We present an updated and functionally extended tool based on universal (i.e. reference-independent), phylogenetic marker gene (MG)- based operational taxonomic units (mOTUs) enabling the profiling of >7,700 microbial ‘species’.
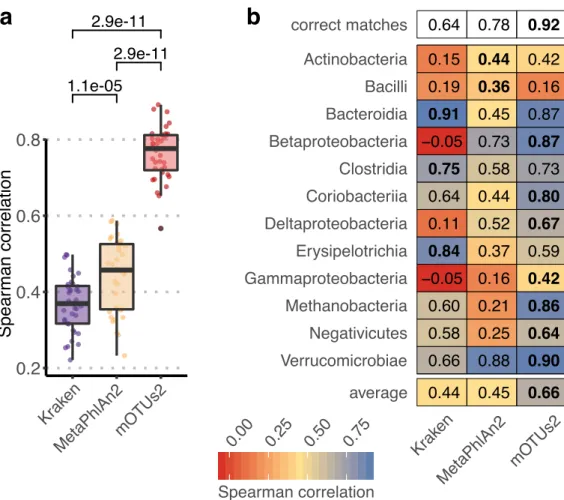
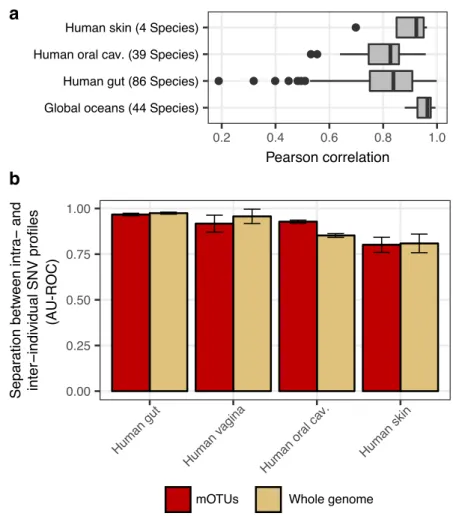
As more than 30% of them could not previously be quantified at this taxonomic resolution, relative abundance estimates based on mOTUs are more accurate compared to other methods. As a new feature, we show that mOTUs, which are based on genes for essential housekeeping functions, are demonstrably well-suited for quantification of basal transcriptional activity of community members. Furthermore, single nucleotide variation profiles estimated using mOTUs reflect those from whole genomes, which allows for comparing, e.g., differences and individuality of microbial strain populations across different human body sites. The tool is available at http://motu-tool.org.
Main
Microorganisms live in complex communities of interacting ‘species’ that impact life on earth and geochemical processes in the environment. It is thus of fundamental interest to accurately profile and compare the composition of the communities they form. The most common approach for microbial community profiling is by classification of PCR amplicon sequences from the small subunit ribosomal RNA gene (i.e. the 16S rRNA gene of bacteria and archaea). While powerful, this approach is also known to introduce biases in composition estimates due to, for instance, variations in 16S rRNA gene copy numbers per genome (Supplementary Fig. S2.1), unequal efficiencies of PCR-primers in different species (Apprill et al., 2015; Parada et al., 2016) as well as the use of different sub-regions of this gene (Claesson et al., 2010). In addition, the high level of its sequence conservation limits the power for resolving closely related organisms (Mende et al., 2013).
More recent methods sample environmental DNA directly by shotgun sequencing (metagenomics), which resolves some of these biases. Different strategies have been introduced to determine microbial community compositions from metagenomic data. One approach is based on classifying sequencing reads using publicly available and taxonomically annotated reference genome sequences of ‘known’ species. The resulting read abundance distributions require subsequent normalization by genome length (Arumugam et al., 2011; Lu et al., 2017) to derive
36
relative abundances of individual species (Supplementary Fig. S2.1). Rather than using whole genomes, an alternative approach is to quantify read coverage of genes that are found to be clade- specific based on analyzing current reference genome databases (Truong et al., 2015). If such marker genes occur only once per genome, then the resulting read coverages do not need to be normalized by copy number or genome length. However, a downside to any method depending on prior knowledge of genome sequences is that genomically uncharacterized taxa remain unaccounted for, which can lead to inaccurate relative abundance estimates at species-level resolution (Supplementary Fig. S2.1).
Taxa that are missed by such reference-dependent methods can collectively be referred to as
‘biological dark matter’ (Marcy et al., 2017). These include organisms - hereon referred to as
‘unknown’ species - that may be detected, but remain difficult to quantify using standard methods and up-to-date genome databases. To overcome this issue, we previously introduced a profiling tool that uses universally occurring, protein coding, single copy phylogenetic marker gene (MG)- based operational taxonomic units (mOTUs) as an approach to capture and quantify microbial taxa at species-level resolution in metagenomic samples (Sunagawa et al., 2013). mOTUs are built on the basis of MGs from both known and unknown species, the latter of which are extracted from existing metagenomes, enabling higher taxonomic resolution and more accurate quantification of species when profiling new microbial communities (Sunagawa et al., 2013).
Here, we present an updated and functionally extended profiling tool, the mOTU profiler version 2 (mOTUs2), which consolidates data from >3,100 metagenomic samples into an updated mOTU database to substantially improve representation of human-associated and ocean microbial species. Evaluations of mOTUs2 relative to state-of-the-art methods demonstrate improved sensitivity and quantification accuracy for both known and unknown species. We illustrate how species missed by other approaches can skew relative abundance estimates from compositional metagenomic data. Moreover, mOTUs enable quantifying baseline transcriptional activity of microbial community members from metatranscriptomic data, while avoiding quantification artefacts due to the use of non-housekeeping genes. Finally, heterogeneous populations of microbial strains have been reported in metagenomic studies to co-exist in a given microbial community, differ between individuals and environmental sampling sites, and remain stable over time (Li et al., 2016; Schloissnig et al., 2013; Truong et al., 2017). We show that differences between such strain populations can be estimated using the MGs of mOTUs as an efficient alternative to using whole genome sequences for metagenomic single-nucleotide-variation profiling.