Molecular Profiling of Single Sca-1 /CD34 Cells—The Putative Murine Lung Stem Cells
Markus Hittinger1.¤a, Zbigniew T. Czyz1., Yves Huesemann1, Matthias Maneck1,2, Catherine Botteron3, Stephanie Kaeufl1, Christoph A. Klein1,3, Bernhard Polzer1,3*
1Chair for Experimental Medicine and Therapy Research, University of Regensburg, Regensburg, Germany,2Institute of Functional Genomics, University of Regensburg, Regensburg, Germany,3Project Group ‘‘Personalized Tumor Therapy’’, Fraunhofer Institute for Experimental Medicine and Toxicology, Regensburg, Germany
Abstract
Murine bronchioalveolar stem cells play a key role in pulmonary epithelial maintenance and repair but their molecular profile is poorly described so far. In this study, we used antibodies directed against Sca-1 and CD34, two markers originally ascribed to pulmonary cells harboring regenerative potential, to isolate single putative stem cells from murine lung tissue.
The mean detection rate of positive cells was 8 per 106lung cells. We then isolated and globally amplified the mRNA of positive cells to analyze gene expression in single cells. The resulting amplicons were then used for molecular profiling by transcript specific polymerase chain reaction (PCR) and global gene expression analysis using microarrays. Single marker- positive cells displayed a striking heterogeneity for the expression of epithelial and mesenchymal transcripts on the single cell level. Nevertheless, they could be subdivided into two cell populations:Sca-1+/CD342andSca-1+/CD34+cells. In these subpopulations, transcripts of the epithelial marker Epcam (CD326) were exclusively detected in Sca-1+/CD342 cells (p = 0.03), whereas mRNA of the mesenchymal marker Pdgfra(CD140a) was detected in both subpopulations and more frequently inSca-1+/CD34+cells (p = 0.04). FACS analysis confirmed the existence of a Pdgfrapositive subpopulation within Epcam+/Sca-1+/CD342 epithelial cells. Gene expression analysis by microarray hybridization identified transcripts differentially expressed between the two cell types as well as between epithelial reference cells andSca-1+/CD34+single cells, and selected transcripts were validated by quantitative PCR. Our results suggest a more mesenchymal commitment of Sca-1+/CD34+cells and a more epithelial commitment ofSca-1+/CD342cells. In summary, the study shows that single cell analysis enables the identification of novel molecular markers in yet poorly characterized populations of rare cells. Our results could further improve our understanding of Sca-1+/CD34+,2cells in the biology of the murine lung.
Citation:Hittinger M, Czyz ZT, Huesemann Y, Maneck M, Botteron C, et al. (2013) Molecular Profiling of Single Sca-1+/CD34+,2Cells—The Putative Murine Lung Stem Cells. PLoS ONE 8(12): e83917. doi:10.1371/journal.pone.0083917
Editor:Dinender K. Singla, University of Central Florida, United States of America ReceivedApril 12, 2013;AcceptedNovember 4, 2013;PublishedDecember 31, 2013
Copyright:ß2013 Hittinger et al. This is an open-access article distributed under the terms of the Creative Commons Attribution License, which permits unrestricted use, distribution, and reproduction in any medium, provided the original author and source are credited.
Funding:The work was supported by German Research Foundation (DFG) grant HI 1101/1 (to M.H.) and the Bavarian Genome Research Network (BayGene, C.A.K.). The funders had no role in study design, data collection and analysis, decision to publish, or preparation of the manuscript.
Competing Interests:The authors have declared that no competing interests exist.
* E-mail: Bernhard.polzer@klinik.uni-regensburg.de
¤a Current address: Institute of Neuroradiology, University of Luebeck, Luebeck, Germany
¤b Current address: Institute for Translational Oncology, University of Mainz, Mainz, Germany .These authors contributed equally to this work.
Introduction
The murine lung contains at least 40 morphologically distinct cell types of mesodermal or endodermal origin [1]. It can be subdivided anatomically in three different regions: large airways, bronchioles, and alveoli. Each region is composed of different cell types whose homeostasis is guaranteed by regionally specific progenitor cells [2,3]. Importantly, Sca-1+ cells have been ascribed decisive functions regarding the maintenance and repair of the airways [2]. In injury models, Sca-1+ cells demonstrated resistance to damage and clonal expansion leading to a restoration of previously experimentally depleted epithelial structures [2]. During the last years, considerable efforts have been undertaken to further characterize a specific subgroup of Sca-1+ cells. These cells were named bronchioal- veolar stem cells (BASCs) based on their location at the bronchioalveolar duct junction [4] where they proved to play a key role in distal airway repair [4–7].
However, a more detailed characterization of this subpopula- tion in terms of its protein expression remained challenging. Kim and colleagues [4] identified BASCs as positive for stem cell antigen 1 (Sca-1), surfactant protein C (Sftpc), clara cell secretory protein (Ccsp), and cluster of differentiation 34 (CD34) as well as negative for the platelet endothelial cell adhesion molecule (CD31, a marker of endothelial cells), and protein tyrosine phosphatase, receptor type C (CD45, a marker of hematopoietic cells). More recent studies, however, confirmed Sca-1 and Sftpc but not CD34 as potential marker proteins of BASCs [8–10]. In contrast to the original publication [4], Sca-1+/CD34+/CD452/CD312 cells showed no enhanced proliferation rate after lung injury as it could be demonstrated with Sca-1+/CD342/CD452/CD312cells [10]. Furthermore, Sca-1+/CD34+/CD452/CD312 cells co- expressed mesenchymal markers thymus cell antigen 1 (CD90) and platelet derived growth factor receptora (Pdgfra, CD140a) questioning their epithelial origin [8]. The epithelial cell adhesion molecule (Epcam, CD326), a6-Integrin (Itga), ß4-Integrin and
cluster of differentiation 24 (CD24) were newly introduced as BASC-specific markers [2,9,10].
Considering the heterogeneity of Sca-1+murine lung cells, as it could be demonstrated for the group of BASCs, the isolation and subsequent gene expression analysis of single cells may provide an interesting tool for the identification of novel molecular markers in poorly described rare cells [11,12]. Eventually, this approach could allow better distinction between the different subtypes of Sca-1+cells and lead to the discovery of novel molecular markers facilitating a better detection and functional evaluation. In this study, we isolated viable Sca-1+and CD34+cells on the basis of their protein expression. Following global amplification of single cell mRNA, gene expression profiling was performed to analyze the cell populations at the single cell level. The analysis included markers that have previously been ascribed to BASCs and intended to identify markers that thus far have not been described in Sca-1+murine lung cells.
Materials and Methods Animals and Tissue Preparation
No animal underwent animal experimentation as defined by the German law (1 7 TierschG). All animals were euthanized and killed before organs were taken. According to German law (1 6 Abs 1 TierschG) there is no requirement for an Ethics vote nor a notification of the local Government for dissection and organ use after the death of an animal. Mice were kept according to the guidelines of the Felasa (Federation for Laboratory Animal Science Associations) and the guideline 2010/63/EU and the ETS123 (APPENDIX A to the European Convention for the Protection of Vertebrate Animals used for Experimental and other Scientific Purposes).
Experiments were conducted on 26 Balb/c mice (10 female, 16 male) between 8 and 12 weeks of age. Mice were euthanized with 100% carbon dioxide, and subsequently the thoracic cavity was opened and the great venous vessels were clamped. The right ventricle was incised and a knop canula introduced to perfuse the lungs with 20–30 ml of body-warm saline. After exsanguination, lungs were dissected and collected in Hanks Balanced Salt Solution (HBSS, pH 7.4, Sigma Aldrich).
Tissue Digestion and Cell Separation
The lungs were finely minced and the tissue was enzymatically digested according to an established protocol [13], with minor modifications. Briefly, each finely minced lung preparation was incubated with 5.4 U/ml collagenase (Roche), 0.03 U/ml dispase (GE Healthcare-Invitrogen) and 2.5 mM CaCl2for 45 minutes at 37uC. The suspension was then filtered through nylon membranes (BD; 100mm, 40mm). Enzymes were inactivated in HBSS/0.2 M EDTA (pH 7.4), cells were centrifuged (1500 rpm, 4uC, 5 min) and resuspended in PBS (pH 7.4). A Percoll gradient (70%) density centrifugation was performed (2050 rpm, 4uC, 20 min) to separate the mononuclear cell fraction. The cell interphase was recovered and washed in PBS. Following a centrifugation step (1500 rpm, 4uC, 10 min) cells were resuspended in PBS (pH 7.4).
Finally, viable cells were identified by Trypan blue assay and counted in a Neubauer chamber.
For FACS analysis, the lung preparations of 5 mice were finely minced. The tissue was enzymatically digested with collagenase (Sigma; 1.5 mg/ml) for 30 minutes at 37uC. The enzymes were inactivated with PBS/BSA (Sigma; 2.5 g/100 ml). The suspension was filtered through a cell strainer (Greiner Bio-One; 40mm), centrifuged (300 g, 10 min, 4uC) and resuspended in 5 ml red blood cell lysis solution (16) (Miltenyi; order no. 130-094-183) for
15 min at room temperature. Thereafter, cells were washed with PBS, centrifuged und resuspended in PBS to be counted in a Neubauer chamber.
Immunofluorescence Staining and Single Cell Isolation Immunofluorescence was performed on one million cells of each lung preparation with antibody concentrations of 10mg/ml for all stainings. Cells were stained subsequently with either antibodies specific for CD31 (Biozol, clone 390) and Sca-1 (FITC-conjugated, Cedarlane, clone CT-6A/6E) or for CD34 (BD Pharmingen, clone RAM34) and CD45 (FITC-conjugated, Becton Dickinson GmbH, clone 30-F11). Cy3-conjugated secondary antibodies (Jackson ImmunoResearch Laboratories, code number: 115-166-071) were used to visualize CD31 or CD34 and Alexa 488-conjugated secondary antibodies (Molecular Probes, cat # A-11096) to visualize Sca-1 or CD45, respectively. Isotype controls were applied for all staining procedures as negative controls. Depending on the staining, Propidium iodide (PI, for Sca-1/CD31 staining) or GFP-Annexine (GFP-A, for CD34/CD45 staining) served as markers for apoptotic cells. Lung cells were screened on an 8-field glass slide for Sca-1+and CD34+cells (0.256106cells/field) using an inverted fluorescence microscope (Zeiss, Germany) equipped with a micromanipulator (Eppendorf, Germany). Sca-1+/ CD312/PI2 and CD34+/CD452/GFP-A2 cells were isolated and each single cell was separately transferred into a 0.2 ml reaction tube (1 cell/tube) containing 4ml of lysis buffer and 0.4ml of tRNA.
Since quantitative gene expression analysis of the isolated Sca- 1+and CD34+cells was an important goal of our study, we had to acquire appropriate reference cells for comparison, i.e. pulmonary cells lacking Sca-1 and CD34 expression and not originating from hematopoietic or endothelial cell lines. Therefore, cells of 6 enzymatically digested lungs were double-stained with CD31 and CD45 antibodies in order to collect single cell samples. The same isolation procedure as described above was applied for CD312/CD452reference cells. To exclude cells expressing Sca- 1 and CD34, specific PCRs on the corresponding amplified transcripts of those genes were performed.
Whole Transcriptome Amplification (WTA) of Single Cells The transcriptome of each obtained cell was extracted and amplified according to an established protocol [12] with modifi- cations [11]: One microlitre protease/lysis buffer mix (1:20- dilution; Active Motif, Rixensart, Belgium) and 1ml biotinylated peptide nucleic acids (PNAs; Midi-Kit, Active Motif, dissolved in 400ml water) were added to each tube for proteolytic digestion.
Digestion was performed at 45uC for 10 min, followed by inactivation for 1 min at 70uC and 15 min at 22uC for PNA annealing to the mRNA. mRNA was captured by streptavidine- coated magnetic particles (Active Motif) during 45 min rotation at room temperature. After addition of 10ml wash buffer 1 (50 mM Tris-HCl (pH 8.3), 75 mM KCl, 3 mM MgCl2, 10 mM DTT and 0.25% Igepal), tubes were placed in a magnetic rack. The supernatants containing the genomic DNA were removed and the beads washed with 20ml wash buffer 2 (50 mM Tris-HCl (pH 8.3), 75 mM KCl, 3 mM MgCl2, 10 mM DTT and 0.5%
Tween). The supernatants were removed and the beads washed once again with 20ml wash buffer 1. The mRNA was reverse transcribed using a mix comprising 0.5 mM dNTPs, 30mM CFL15CN8 primer ([C]n = 15GTCTAGA[Nn = 8]), 15mM CFL15CT24 primer ([C]n = 15GTCTAGA[T]n = 24), 0.25% Igepal, 10 mM DTT (Invitrogen), the reaction buffer supplied by the manufacturer and 200 U of Superscript II reverse transcriptase (Invitrogen, Karlsruhe) in a final volume of 20ml. Primers were
allowed to anneal at room temperature for 10–15 min before the enzyme was added. Reverse transcription was conducted for 45 min at 44uC in an oven with constant steering. Following reverse transcription, the magnetic cDNA-mRNA-hybrids were washed in 20ml tailing wash buffer (50 mM KH2PO4 (pH 7), 1 mM DTT, 0.25% Igepal), resuspended in 10ml tailing buffer (10 mM KH2PO4(pH 7), 4 mM MgCl2, 0.1 mM DTT, 200mM dGTP) and then coated with 40ml PCR oil. Hybrids underwent denaturation at 94uC for 4 min. The tailing reaction was performed at 37uC for 60 min after addition of 10 U terminal deoxynucleotide transferase (TdT; Amersham, Freiburg). TdT was inactivated at 70uC for 5 min. Next, a hot-start PCR was performed. Therefore, 35ml of PCR mix 1 containing 4ml buffer 1 (Expand long template, Roche) and 3% deionized formamide was added to each sample., Next, the samples were heat up to 78uC followed by addition of 5.5ml of the PCR mix 2 (350 mM dNTPs, 1.2mM CP2 primer (TCAGAATTCATG[C]n = 15) and 5 U Pol Mix (Expand long template)). Forty cycles were run in a MJ research PCR machine: 20 cycles of 15 sec at 94uC, 30 sec at 65uC, 2 min at 68uC and 20 cycles with an elongation of the extension time of 10 sec and a final elongation step of 7 min at 68uC.
Analytical PCR on Specific Transcripts
For quality control of whole transcriptome amplification products, we tested for amplicons of ubiquitously expressed genes Actb(ß-actin) andGapdh(Glyceraldehyde 3-phosphate dehydroge- nase) by PCR. Only cells with at least one positive result were considered for further analysis. For initial molecular characteriza- tion of isolated cells, PCR on transcripts ofSca-1,CD34,CD45and CD31were performed.
In order to differentiate between a more epithelial or mesenchymal phenotype of isolated cells, we conducted further PCRs specific for epithelial markersEpcam(Epithelial cell adhesion molecule),Itga(Integrin alpha-6) and Sftpc(Surfactant protein C) and mesenchymal markers CD90 (Thy-1) and Pdgfra (platelet derived growth factor receptor alpha, CD140a), as suggested by McQualter et al. [9]. Specificity of all primers was confirmed by restriction digestion, sequences are depicted in Table S1.
Array Hybridization and Data Analysis
Probes of the 29 selected cells were hybridized on Mouse Genome OpArrays (Eurofins MWG Operon; cat#OPMMV4- 05). The arrays contain probes for 16,928 genes and have previously been used for hybridization of single cell WTA products [11]. The amplified single cell cDNA was labeled with 0.05 mM digoxygenin-dUTP (Roche) and 0.05 mM aminodigoxygenin- dCTP (PerkinElmer, Rodgau-Ju¨gesheim) in the presence of 3%
formamide, 2.4mM CP2-BGL primer (TCAGAATT- CATGCCGCCCCCCCGGCCC) and dNTPs (0.35 mM dATP and dGTP, 0.3 mM dTTP and dCTP). Reference cDNA was labeled with biotin-dUTP (Roche) and biotin-dCTP (Invitrogen).
Primer sequences were then separated from the cDNA sequences in a subsequent digestion step with 30 U of BglI (Fermentas, St.
Leon-Rot), and then purified (QIAquick PCR Purification Kit, QIAGEN, Hilden). Test and reference cDNA were co-precipitat- ed with 0.8ml polyacrylamide carrier, 0.163 M sodium acetate and 2.56ethanol (100%). Arrays were pre-hybridized with 56 SSC +0.1% SDS +0.1% BSA at 42uC and hybridized in an Arraybooster hybstation (Implen, Munich) at 42uC overnight. The slides were washed twice at 42uC in 26SSC+0.1% SDS for 5 min, twice at room temperature in 0.16SSC+0.1% SDS for 10 min, and finally twice at room temperature in 0.16SSC for 2 min 30 s.
Unspecific binding of labeled proteins was blocked with 1%
blocking reagent for nucleic acid hybridization (Roche). Slides were then stained with 16mg/ml anti-Dig-Cy5 (Jackson Labora- tories) and 18mg/ml Streptavidin-Cy3 (Jackson Laboratories). In order to remove excess antibody/streptavidin, slides were washed with 46SSC+0.2% Tween-20.
The microarray slides were scanned using the GenePix 4000A Arrayscanner (Molecular Device). The downstream data prepro- cessing and analysis was done in R using the limma package [14].
Raw probe intensities were background corrected by applying the
‘normexpr’ method. Analysis was restricted to Cy5 intensities.
Loess normalization was used in M versus A plots of individual Cy5 intensities of a given transcript in a given array and the median Cy5 intensity across all arrays of the same transcript. Log2 ratios were calculated from the normalized intensities and quantile-normalization was subsequently applied across all arrays.
All further analysis was based on normalized log ratios. Based on the hybridization date the data set is separated into two main batches of microarrays (early 2007/2008 and late 2009), which degrade further into small sub-batches. We used the ComBat algorithm [15] to adjust for the main batches. Transcripts differentially expressed between the groups were identified using regularized linear model as implemented in the limma package [16]. Transcripts were considered as significantly differentially expressed when their corresponding adjusted P-value was#0.05.
Adjustment of P-values as correction for multiple testing was done as proposed by Benjamini et al. [17]. The differential gene expression analysis was used to generate candidates of regulated genes. The data have been deposited in NCBIs Gene Expression Omnibus (GEO, http://www.ncbi.nlm.nih.gov/geo/) and as- signed series accession number GSE52215.
Quantitative PCR
The differentially expressed genes for Decorin (Dcn), Gelsolin (Gsn) and Esterase D/formylglutathion hydrolase (Esd) were used to validate microarray results in an additional series of specific analytical and quantitative PCRs (qPCR). qPCR was performed using the LightCyclerH 480 instrument (Roche, Mannheim, Germany). The real-time quantification was conducted using LightCyclerH 480 SYBR Green I Master reagent (Roche, Mannheim, Germany). The cycling procedure consisted of an initial denaturation step (5 min at 95uC) followed by 38 cycles of 20 s at 95uC, 15 s at 58uC and 15 s at 72uC. All reactions were run in three replicas in a final volume of 19ml containing 5ml of cDNA template and 7 pmol of each forward and reverse primer.
Positive and negative controls were included in all qPCR runs.
Additionally, to confirm the specificity of reaction, all experiments included melt curve analysis. For each cell group three represen- tative samples were generated by pooling equal amounts of single- cell cDNA samples assigned to a given group (10, 7 or 12 samples forSca-1+/CD34+,Sca-1+/CD342and reference cells, respectively).
This was done to decrease the measurement noise originating from cell-to-cell variability of gene expression levels. 1006dilutions of the original cDNA sample representations were used as template for the qPCR. The relative gene expression levels were calculated using the efficiency corrected mathematical model described elsewhere [18]. Quantification was performed in parallel using three different reference genesActb,Gapdh andHprt1(Hypoxan- thine phosphoribosyl transferase 1), in each case giving highly comparable results. Group-wise comparison of relative gene expression levels was performed using 2-tailed Student’s t-test. A value of p,0.05 was considered to indicate a statistically significant difference.
FACS Staining
For FACS analysis a FACSCanto II (BD Biosciences) was used.
Five million cells per animal were blocked with 1mg Fc-block/
tube and stained with anti-mouse CD31 antibody (PE-conjugated, clone 390; Biolegend, 1mg/ml), anti-mouse CD34 antibody (FITC-conjugated, clone RAM34; eBioscience, 10mg/ml), anti- mouse CD45 antibody (PerCP/Cy5.5-conjugated, clone 30-F11;
Biolegend, 2.5mg/ml), anti-mouse Sca-1 antibody (APC-Cy7- conjugated, clone D7; Biolegend, 2.5mg/ml), anti-mouse EpCAM antibody (eF450-conjugated, clone G8.8; eBioscience, 10mg/ml) and anti-mouse PDGFRa antibody (APC-conjugated, clone APA5; Biolegend, 10mg/ml) or corresponding isotype antibodies for 20 min at 4uC. Results were visualized by the FlowJo package (Tree Star Inc., Ashland, OR, USA).
Results
Identification of Sca-1+and CD34+Cells and Selection for Molecular Analysis
In order to isolate Sca-1+ and CD34+ cells 15 Balb/c mice between 8 and 12 weeks of age were sacrificed. Tissue digestion and cell separation started immediately after lung explantation.
The number of obtained non-erythrocytic, non-apoptotic cells per experiment ranged from 0.406106 to 5.06106 (mean 1.66106; standard error of the mean (SEM) 1.166106). The number of erythrocytes ranged from 0.206106to 2.66106(mean 0.876106; SEM 0.736106), the number of apoptotic cells (i.e. PI+or GFP-A+
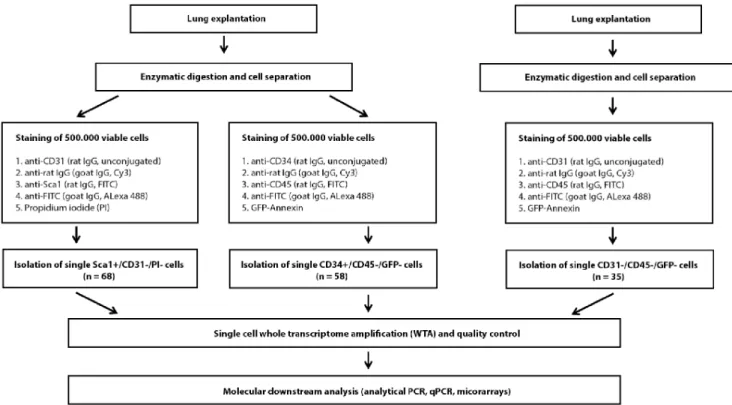
cells) ranged from 0.926106 to 4.06106 (mean 1.96106; SEM 1.36106). The experimental setup is outlined in Figure 1.
Up to one million cells per animal were screened, equally divided for Sca-1/CD31 and CD34/CD45 immunofluorescence (i.e. up to 0.506106 cells for each staining and animal). We identified and isolated 68 Sca-1+/CD312/PI2cells, the number of obtained cells per mouse ranging from 0 to 10 (mean 4.5, SEM 3.0, Table 1 and Figure S1). Additionally, we detected 58 CD34+/ CD452/GFP-A2 cells, ranging from 0 to 13 in individual mice (mean 3.9; SEM 4.6, Table 1 and Figure S1). All detected cells were isolated and subjected to single cell gene expression analysis following whole transcriptome amplification (WTA). The enzy- matically digested lungs of 6 additional mice yielding up to 1.76106non-erythrocytic cells (mean 1.36106 cells; SEM 0.326106 cells) were stained with antibodies against CD31 and CD45 resulting in the isolation of 35 control cells (CD312/CD452). All isolated cells were subjected to whole transcriptome amplification (WTA) and WTA quality controlled by expression ofActbandGapdh. In total, 115/161 (71.4%) samples passed our quality assay and were subjected to further molecular analysis (no difference between cell types, data not shown).
We continued by testing for the presence of transcripts of the proteins targeted by antibodies in immunofluorescence: Sca-1, CD34, CD45 and CD31. Within the two populations of putative BASC, 35 cells completely lacked transcript expression ofSca-1/
CD34, while another 10 cells co-expressed CD31and/or CD45 (Table 2). We decided to exclude those cells from further analyses which resulted in a cohort of 46 single putative BASCs remaining
Figure 1. Flowchart of the experimental setup.Simplified schematic overview on the workflow of single cell isolation and immunofluorescent staining strategy: Cells are divided into two groups after separation and stained with antibodies directed against CD31 and Sca-1 or CD34 and CD45, respectively. In order to gain appropriate reference cells for comparative gene expression analysis, additional lung cells are stained with antibodies directed against CD31 and CD45, and only CD312/CD452cells are isolated. Propidium iodide (PI) and GFP-Annexine (GFP-A) are applied to exclude apoptotic cells. Genes recently introduced in literature in order to differentiate between epithelial and mesenchymal cells are tested by specific PCR.
PCR results enable further subdivision of analyzed cells (Sca-1+/CD34+cells, Sca-1+/CD342cells, Sca-12/CD34+cells). In a final step, selected Sca-1+/ CD34+cells, Sca-1+/CD342cells and Sca-12/CD342reference cells are subjected to comparative gene expression analysis. Results are validated by qPCR of pooled samples.
doi:10.1371/journal.pone.0083917.g001
for downstream analyses. Likewise, among the tested pulmonary reference cells we excluded one sample expressingSca-1and two samples positively tested for the presence of CD45 transcripts resulting in a cohort of 21 cDNA libraries ofSca-12/CD342cells.
Correlation between Protein and mRNA Expression in Single Cells
Next, we assessed the correlation between protein staining and PCR results forSca-1 andCD34in the group of putative BASCs (Table 3). In total, 24/46 cells were isolated as Sca-1+/ CD312/PI2 and 22/46 cells as CD34+/CD452/GFP-A2 using immunofluorescent staining (Figure 1). Direct comparison re- vealed that Sca-1 expression could be detected simultaneously at
both protein and mRNA level in 19 of 24 Sca-1+/CD312/PI2 cells (79.2%) andCD34expression could be detected on protein and mRNA level in 15 of 22 CD34+/CD452/GFP-A2 cells (68.2%), thus showing a positive correlation between protein and transcript level in the majority of putative BASCs. According to the detected mRNA transcripts after single cell WTA, cells could be grouped either as Sca-1+/CD34+ (n = 17), Sca-1+/CD342 (n = 22) orSca-12/CD34+(n = 7).
Interestingly, simultaneous expression of Sca-1 and CD34 could be detected in 13/22 single cells isolated after CD34-staining (59.1%) and only in 4/24 (16.7%) single cells isolated after Sca-1- staining, resulting in a significantly higher prevalence of cells showing mRNA transcripts of both markers Sca-1 and CD34 in the group of CD34+/CD452/GFP-A2 cells (Fisher’s exact test, p = 0.005, Table 3). On the other hand, the group of Sca-1+/ CD312/PI2cells showed a higher prevalence for cells positive for Sca-1 transcripts only, an expression pattern that matched 15/
24 Sca-1+/CD312/PI2cells and 7/22 and CD34+/CD452/GFP- A2cells, respectively (Chi Square test, p = 0.04, Table 3). These results indicate the existence of different subpopulations within the isolated fractions of cells.
Identification of Novel Molecular Markers in Putative BASCs
To further analyze the isolated cells, we selected 17 putative BASCs (10Sca-1+/CD34+cells and 7Sca-1+/CD342cells) and 12 reference cells (Sca-12/CD342/CD312/CD452)for hybridization on Mouse Genome OpArrays (Eurofins MWG Operon). Here, we decided to compare microarray data of two of the three cell groups independently with each other.
First, we analysed data ofSca-1+/CD34+cells and the selected pulmonary reference cells only, which resulted in detection of significant changes in expression levels of 107 genes (adjusted p- value,0.05 each, Figure 2A, Table S2). Interestingly, we could not find any differentially expressed genes between the groups of Sca-1+/CD342 cells and the reference cells (Sca-12/CD342). In turn, comparative gene expression analysis ofSca-1+/CD34+and Sca-1+/CD342 cells identified 8 differentially expressed genes (adjusted p-value,0.05 each, Table S3).
In general, gene expression in single cells is subjected to stochastic fluctuations [19]. While in high-dimensional data (as microarrays) normalization generally uses many if not all probes, relative quantification in quantitative PCR (qPCR) experiments relies on stable expression levels of individual genes. This especially holds true for some house-keeping genes, as e.g.Actb orGapdh, which renders reliable relative quantification using such an approach at the single cell level questionable [20,21]. Although specific genes can be expressed at a stable level between individual single cells of a certain cell type, this approach is not feasible for Table 1.Non-erythrocytic cells, Sca-1+and CD34+cells per
lung preparation.
Mice
non-erythrocytic cells
Sca-1+/CD312 cells
CD34+/CD452 cells
1 680000 3 0
2 1.526106 4 3
3 920000 4 2
4 1.26106 4 5
5 1.26106 0 0
6 2.46106 5 6
7 2.06106 5 11
8 1.26106 6 12
9 2.46106 3 3
10 400000 3 1
11 520000 3 0
12 1.26106 8 2
13 1.06106 0 13
14 5.06106 10 0
15 2.56106 10 0
doi:10.1371/journal.pone.0083917.t001
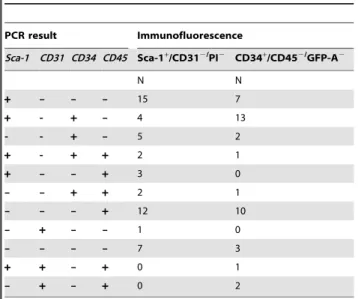
Table 2.PCR results of corresponding transcripts in Sca-1+/
CD31- and cells CD34+/CD45- cells.
PCR result Immunofluorescence
Sca-1 CD31 CD34 CD45 Sca-1+/CD312/PI2 CD34+/CD452/GFP-A2
N N
+ – – – 15 7
+ - + – 4 13
- - + – 5 2
+ - + + 2 1
+ – – + 3 0
– – + + 2 1
– – – + 12 10
– + – – 1 0
– – – – 7 3
+ + – + 0 1
– + – + 0 2
doi:10.1371/journal.pone.0083917.t002
Table 3.Distribution of PCR-basedSca-1/CD34expression in isolated putative BASCs.
Immunofluorescence Sca-1+ CD34+
mRNA transcripts Sca-1+/CD34+ 4 13 17
Sca-1+/CD342 15 7 22
Sca-12/CD34+ 5 2 7
24 22 46
doi:10.1371/journal.pone.0083917.t003
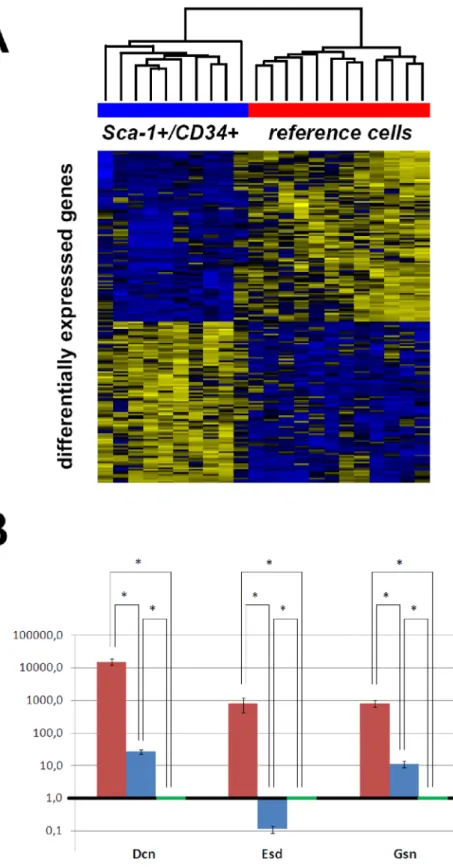
Figure 2. Gene expression microarray analysis of isolated single cells. Panel A:The comparison of microarray expression profiles ofSca-1+/ CD34+cells and pulmonary reference (Sca-12/CD342/CD312/CD452) cells showed 107 differentially expressed genes.Panel B:Pools of analyzed cells fromSca-1+/CD34+subpopulation (red),Sca-1+/CD342subpopulation (blue) and pulmonary reference cells (green) were analyzed by quantitative PCR against differentially expressed genesDcn,EsdandGsn. The selected genes not only show significant differences regarding to their expression, but also represent different subpopulations of proteins. Error bars indicate standard deviation of the mean calculated for analyzed triplicates. Expression values are calculated by relative quantification against housekeeping gene Actb and illustrated in comparison to pulmonary reference cells (expression value = 1.0) on a logarithmic scale. All comparisons between different groups, as determined by quantitative PCR, showed significantly different expression levels (student’s t-test, * indicating p,0.05).
doi:10.1371/journal.pone.0083917.g002
poorly described cell populations. Therefore, we decided to pool the single cell samples of a pre-defined subgroup for qPCR analyses to validate the results of the microarray analyses.
For validation, we chose transcripts for Decorin (Dcn), and Gelsolin (Gsn), which were differentially expressed betweenSca-1+/ CD34+and reference cells, as well as Esterase D/formylglutathion hydrolase (Esd), which was in addition differentially expressed between Sca-1+/CD34+ and Sca-1+/CD342 cells. Besides the differential expression, the rationale for the selection of the three chosen transcripts was that they represent different functional groups of genes. As expected, cells from the Sca-1+/CD34+ subpopulation expressed very high levels of all three transcripts in comparison to cells of the other two groups (student’s t-test, p,0.05). If comparing Sca-1+/CD342 cells with pulmonary reference samples, Dcn and Gsn were expressed in significantly higher levels in Sca-1+/CD342 cells than Sca-12/CD342 cells, while Esd was expressed at significantly lower level in Sca-1+/ CD342cells than in pulmonary reference cells as determined by quantitative PCR (student’s t-test, p,0.05, Figure 2B).
Single Cell Analysis of Epithelial and Mesenchymal Transcripts Allows Further Delineation of Sca-1+/CD34+,2 Subpopulations
To further clarify the epithelial or mesenchymal commitment of isolated cells, we checked expression of mesenchymal (CD90, Pdgfra) and epithelial transcripts (Epcam,ItgaandSftpc) as recently described [8]. For this purpose, we analyzed all 46 putative BASCs and 21 pulmonary reference cells by analytical PCR (Table S4).
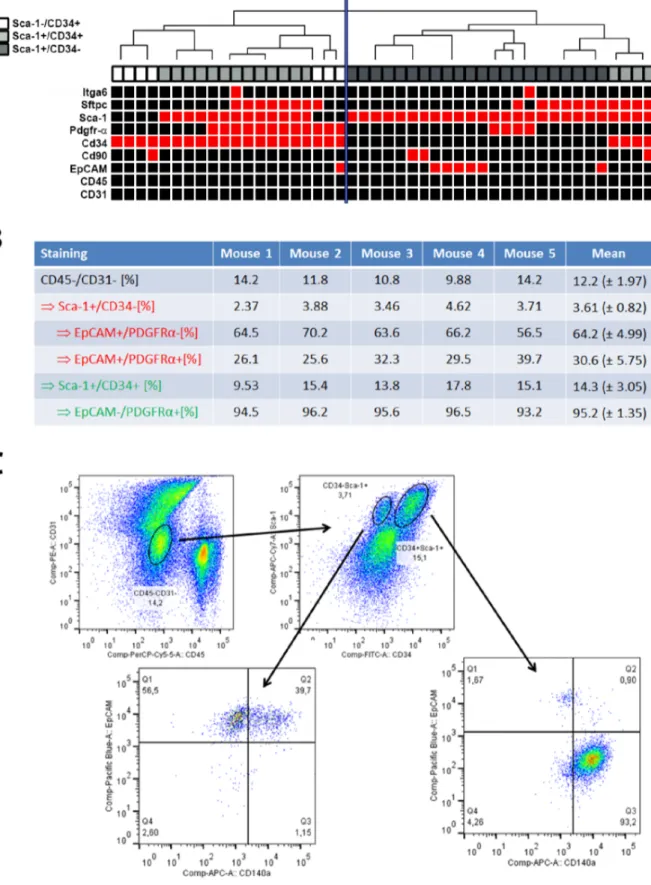
While statistical analysis revealed no differences in the expression frequency of mesenchymal markers in the group of putative BASCs compared to reference cells, significant differences were detected between Sca-1+/CD342cells (n = 22) and Sca-1+/ CD34+cells (n = 17, Figure 3A). Here, we noted that the epithelial transcriptEpcamwas exclusively expressed in some Sca-1+/CD342 cells (6/22 cells; p = 0.03, Fisher’s exact test). In comparison, the mesenchymal transcriptPdgfrawas more frequently expressed by Sca-1+/CD34+cells (9/17 cells), although 4/22Sca-1+/CD342cells also expressed transcripts of the gene (p = 0.04, Fisher’s exact test).
Interestingly, while the putative epithelial marker Sftpc was frequently expressed in both major cell types, it could be detected more frequently inSca-1+/CD34+than Sca-1+/CD342 cells (11/
17 vs. 7/22 single cells; p = 0.04, Chi-square test).ItgaandCD90 were rarely expressed in single cells of either cell type. Within the small group of Sca-12/CD34+ cells, 2/7 cells co-expressed epithelial and mesenchymal markers, whereas another 2/7 cells expressed mesenchymal markers only (Table S4). The remaining three cells were negative for both mesenchymal and epithelial markers.
In order to confirm the PCR results we performed FACS analysis of 5 additional digested lung explants using antibodies directed against Sca-1, CD34, CD45, CD31, Epcam and Pdgfra.
Within the population of CD452/CD312cells, we could detect 3.61% of Sca-1+/CD342cells and 14.3% of Sca-1+/CD34+cells in mean (Figure 3B). We proceeded to look at Epcam and Pdgfra expression in these two subpopulations of putative BASCs. As previously described, the majority of Sca-1+/CD342 cells expressed Epcam, while Pdgfra was expressed in the Sca-1+/ CD34+subpopulation. However, in good correlation to our PCR results, we found a significant subpopulation of Epcam+/Pdgfra+ cells within the subpopulation of Sca-1+/CD342cells (Figure 3B and C).
Discussion
In this study we investigated the gene expression profile of single Sca-1+/CD312/PI2and CD34+/CD452/GFP-A2cells that were detected by immunofluorescence and subsequently sub-divided into groups based on the protein expression of Sca-1 and CD34, as well as mRNA expression of subgroup-specific markers.
Sca-1 and CD34 have both been ascribed to bronchioalveolar stem cells (BASCs), a rare population of long-living, regional fixed, robust cells residing at the bronchioalveolar duct junction that have been sparsely investigated so far. Only few markers were established in previous studies mainly applying FACS analysis, which enables a rapid screening of very large cell numbers and subsequent comparison between cell populations as defined by applied protein markers. This approach shows high sensitivity and at the same time an elevated risk to isolate false-positive cells, which may impair the detection of extremely rare cells [22]. In this study, we intentionally utilized a microscope-based approach to isolate single cells to analyze cell-to-cell heterogeneity in poorly characterized cells. Considering the low incidence of putative BASCs in lung tissue, we believe that this approach is the method of choice for the molecular analysis of such extremely rare and poorly characterized cells. Beyond that, our workflow additionally allows direct assessment of morphology and viability of the target cells, thereby reducing the risk of contamination with false-positive cells or cell debris to an absolute minimum.
Combined protein and cDNA analysis of Sca-1 and CD34 in our study showed a highly positive correlation between staining and transcript detection (79.2% for Sca-1 and 68.2% for CD34, respectively). In addition, our approach enabled further classifica- tion in different subpopulations characterized bySca-1andCD34 transcript expression. Analyzed cells consisted of two larger groups ofSca-1+/CD342 (n = 22) andSca-1+/CD34+(n = 17) cells and a smaller group ofSca-12/CD34+(n = 7) cells.
To further investigate the expression profiles of the different cell types, we performed microarray-based gene expression analysis of single cell WTA products, including 10Sca-1+/CD34+cells, 7Sca- 1+/CD342cells, and 12Sca-12/CD342pulmonary reference cells.
Comparisons between the different subgroups revealed 107 genes differentially expressed inSca-1+/CD34+cells when compared to the reference cells, whereas no differentially expressed genes could be detected by comparingSca-1+/CD342cells with reference cells.
The comparison between the twoSca-1+cell subgroups (Sca-1+/ CD34+vs.Sca-1+/CD342) yielded 8 differentially expressed genes.
Validation by quantitative PCRs for the genesDcn,Gsn andEsd confirmed the microarray results.
During the validation of the microarray results we intentionally abstained from performing qPCR analysis directly on single cell WTA products due to stochastic variation in expression level, a phenomenon that has been repeatedly reported before [19,23–25].
Cell-to-cell heterogeneity in gene expression, which is also detectable in our data sets, may represent stochastic transcriptional bursts that are generated by intrinsic on-off transitions of the corresponding genes occurring at irregular intervals [23,25].
Fluctuations in levels of individual transcripts also affect the housekeeping genes, whose expression serves as reference in qPCR analyses [20,21]. Stable reference is indispensable to reliably quantify relative expression levels of genes of interest. Higher stability in gene expression levels facilitating more reliable downstream analysis can be achieved only by pooling single cell samples representing the same cell population, thereby averaging the stochastic variability of transcript levels in individual cells especially for reference genes.
Figure 3. Expression of epithelial and mesenchymal markers in Sca-1+/CD34+,2 cells. Panel A: The expression of epithelial and mesenchymal transcripts was tested by analytical PCR and is illustrated in a hierarchical cluster heatmap. The analysis shows that the majority ofSca- 1+/CD34+cells (light grey) show similar marker expression asSca-12/CD34+cells (white), while allSca-1+/CD342cells (dark grey) are located in the second branch. Red squares indicate specific bands in analytical PCR, black squares indicate negative PCR results.Panel B:FACS analysis reveals EpCAM+/Pdgfra+subpopulation within Sca-1+/CD342/CD312/CD452 cells. For each of 5 mice, 56106murine lung cells were isolated from lung explants and stained with antibodies directed against Sca-1, CD34, CD31, CD45, Pdgfraand Epcam. While Sca-1+/CD342cells consistently showed
We selected three genes from the list of differentially expressed genes for qPCR validation coding for proteins of different functional groups (Dcn, Gsn, andEsd), representing extracellular matrix components, intracellular/membrane-bound proteins and cytoplasmic metabolic proteins, respectively. Antiproliferative or tissue stabilizing effects as well as the promotion of cellular motility and invasion have been demonstrated for Gelsolin and Decorin [26–31]. Both markers have been previously assigned to pulmo- nary fibroblasts. Consequently, their enhanced expression in Sca- 1+/CD34+cells would be in line with mesenchymal commitment.
On the other hand, an exclusive expression of the novel markers in mesenchymal cells has not been proven so far. Esd has been ascribed an important role in intracellular detoxification [32]
making tumor cells more resistant against harmful substances [33].
We then searched for transcripts of recently described epithelial (Epcam,Itga,Sftpc) and mesenchymal (CD90,Pdgfra) markers [8] by analytical PCRs and found a frequent expression ofPdgfrainSca- 1+/CD34+ single cells. Interestingly, almost 80% of these cells additionally showed expression ofSftpc, described as an epithelial marker, while only 14% of Sftpc-expressing Sca-1+/CD342 cells showed coexpression of Pdgfra. Moreover, expression of the epithelial transcriptEpcam was restricted to the group ofSca-1+/ CD342cells (and oneSca-12/CD34+cells), while expression of the mesenchymal markerPdgfracould be detected in only four of the analyzedSca-1+/CD342cells. In FACS analysis, we could confirm a significant subpopulation of Epcam+/Pdgfra+ cells within the Sca-1+/CD342/CD452/CD31- cells (Figure 3).
Our results support an epithelial commitment ofSca-1+/CD342 cells – in contrast to the Sca-1+/CD34+ cells that displayed an increased incidence of mesenchymal marker expression. However, taking into account the novel subpopulation of Sca-1+/ CD342/EpCAM+/Pdgfra+ cells we postulate that single cell isolation and transcription profiling on rare cells represents a sensitive approach to obtain molecular data of single cells of interest. In this study, we showed on single murine lung cells that this approach has the power to deliver novel molecular markers that could contribute to a better understanding of the cellular
heterogeneity and hierarchy in the murine lung. The presented approach may, therefore, help to analyze extremely rare and yet poorly characterized cells (e.g. stem cells) in other fields of biology as well.
Supporting Information
Figure S1 Immunofluorescence stained single cell sus- pensions of explanted lungs. Panels A–D:The arrow points to a single CD34+/CD452/GFP-Annexin2 cell (Cy3-signal) surrounded by several CD34-negative cells showing fluorescence in FITC channel.Panels E–F:Single Sca-1+/CD312/PI2cell.
(TIF)
Table S1 Primer sequences.
(DOC)
Table S2 Differentially expressed genes (Sca1+/CD34+
vs Reference cells).
(DOC)
Table S3 Differentially expressed genes (Sca1+/CD34+
vs Sca1+/CD34–).
(DOC)
Table S4 Detected mRNA transcripts in isolated single cells.
(DOC)
Acknowledgments
We thank Isabell Blochberger and Siegfried Rein for excellent technical assistance
Author Contributions
Conceived and designed the experiments: MH CAK BP. Performed the experiments: MH ZTC YH CB SK. Analyzed the data: MM CAK BP.
Wrote the paper: MH BP.
References
1. Fine A (2009) Breathing life into the lung stem cell field. Cell Stem Cell 4: 468–
469.
2. Chen H, Matsumoto K, Brockway BL, Rackley CR, Liang J, et al. (2012) Airway epithelial progenitors are region specific and show differential responses to bleomycin-induced lung injury. Stem Cells 30: 1948–1960.
3. Rawlins EL, Okubo T, Xue Y, Brass DM, Auten RL, et al. (2009) The role of Scgb1a1+Clara cells in the long-term maintenance and repair of lung airway, but not alveolar, epithelium. Cell Stem Cell 4: 525–534.
4. Kim CF, Jackson EL, Woolfenden AE, Lawrence S, Babar I, et al. (2005) Identification of bronchioalveolar stem cells in normal lung and lung cancer.
Cell 121: 823–835.
5. Nolen-Walston RD, Kim CF, Mazan MR, Ingenito EP, Gruntman AM, et al.
(2008) Cellular kinetics and modeling of bronchioalveolar stem cell response during lung regeneration. Am J Physiol Lung Cell Mol Physiol 294: L1158–
1165.
6. Qian S, Ding JY, Xie R, An JH, Ao XJ, et al. (2008) MicroRNA expression profile of bronchioalveolar stem cells from mouse lung. Biochem Biophys Res Commun 377: 668–673.
7. Tiozzo C, De Langhe S, Yu M, Londhe VA, Carraro G, et al. (2009) Deletion of Pten expands lung epithelial progenitor pools and confers resistance to airway injury. Am J Respir Crit Care Med 180: 701–712.
8. McQualter JL, Brouard N, Williams B, Baird BN, Sims-Lucas S, et al. (2009) Endogenous fibroblastic progenitor cells in the adult mouse lung are highly enriched in the sca-1 positive cell fraction. Stem Cells 27: 623–633.
9. McQualter JL, Yuen K, Williams B, Bertoncello I (2010) Evidence of an epithelial stem/progenitor cell hierarchy in the adult mouse lung. Proc Natl Acad Sci U S A 107: 1414–1419.
10. Teisanu RM, Lagasse E, Whitesides JF, Stripp BR (2009) Prospective isolation of bronchiolar stem cells based upon immunophenotypic and autofluorescence characteristics. Stem Cells 27: 612–622.
11. Hartmann CH, Klein CA (2006) Gene expression profiling of single cells on large-scale oligonucleotide arrays. Nucleic Acids Res 34: e143.
12. Klein CA, Seidl S, Petat-Dutter K, Offner S, Geigl JB, et al. (2002) Combined transcriptome and genome analysis of single micrometastatic cells. Nat Biotechnol 20: 387–392.
13. Summer R, Kotton DN, Sun X, Ma B, Fitzsimmons K, et al. (2003) Side population cells and Bcrp1 expression in lung. Am J Physiol Lung Cell Mol Physiol 285: L97–104.
14. Smyth GK, Speed T (2003) Normalization of cDNA microarray data. Methods 31: 265–273.
15. Johnson WE, Li C, Rabinovic A (2007) Adjusting batch effects in microarray expression data using empirical Bayes methods. Biostatistics 8: 118–127.
16. Smyth GK (2004) Linear models and empirical bayes methods for assessing differential expression in microarray experiments. Stat Appl Genet Mol Biol 3:
Article3.
17. Benjamini Y, Drai D, Elmer G, Kafkafi N, Golani I (2001) Controlling the false discovery rate in behavior genetics research. Behav Brain Res 125: 279–284.
18. Pfaffl MW (2001) A new mathematical model for relative quantification in real- time RT-PCR. Nucleic Acids Res 29: e45.
Epcam expression, Pdgfraexpression was predominantly found in Sca-1+/CD34+cells. However, Sca-1+/CD342/Epcam+cells could be divided in two major subpopulations defined by Pdgfraexpression. Relative quantification is given for corresponding selected subpopulation as indicated by arrows.Panel C:Scatter plots of the detected cell populations for mouse 5, only.
doi:10.1371/journal.pone.0083917.g003
19. Raj A, van Oudenaarden A (2008) Nature, nurture, or chance: stochastic gene expression and its consequences. Cell 135: 216–226.
20. Bengtsson M, Hemberg M, Rorsman P, Stahlberg A (2008) Quantification of mRNA in single cells and modelling of RT-qPCR induced noise. BMC Mol Biol 9: 63.
21. Reiter M, Kirchner B, Muller H, Holzhauer C, Mann W, et al. (2011) Quantification noise in single cell experiments. Nucleic Acids Res 39: e124.
22. Alexander CM, Puchalski J, Klos KS, Badders N, Ailles L, et al. (2009) Separating stem cells by flow cytometry: reducing variability for solid tissues.
Cell Stem Cell 5: 579–583.
23. Chubb JR, Trcek T, Shenoy SM, Singer RH (2006) Transcriptional pulsing of a developmental gene. Curr Biol 16: 1018–1025.
24. Huh D, Paulsson J (2011) Non-genetic heterogeneity from stochastic partitioning at cell division. Nat Genet 43: 95–100.
25. Raj A, Peskin CS, Tranchina D, Vargas DY, Tyagi S (2006) Stochastic mRNA synthesis in mammalian cells. PLoS Biol 4: e309.
26. Bearer EL (1991) Direct observation of actin filament severing by gelsolin and binding by gCap39 and CapZ. J Cell Biol 115: 1629–1638.
27. Romaris M, Heredia A, Molist A, Bassols A (1991) Differential effect of transforming growth factor beta on proteoglycan synthesis in human embryonic lung fibroblasts. Biochim Biophys Acta 1093: 229–233.
28. Shao F, Zhang R, Don L, Ying K (2011) Overexpression of gelsolin-like actin- capping protein is associated with progression of lung adenocarcinoma.
Tohoku J Exp Med 225: 95–101.
29. Spence HJ, Johnston I, Ewart K, Buchanan SJ, Fitzgerald U, et al. (2000) Krp1, a novel kelch related protein that is involved in pseudopod elongation in transformed cells. Oncogene 19: 1266–1276.
30. Tufvesson E, Westergren-Thorsson G (2003) Biglycan and decorin induce morphological and cytoskeletal changes involving signalling by the small GTPases RhoA and Rac1 resulting in lung fibroblast migration. J Cell Sci 116: 4857–4864.
31. Wiedl T, Arni S, Roschitzki B, Grossmann J, Collaud S, et al. (2011) Activity- based proteomics: identification of ABHD11 and ESD activities as potential biomarkers for human lung adenocarcinoma. J Proteomics 74: 1884–1894.
32. Lee WH, Wheatley W, Benedict WF, Huang CM, Lee EY (1986) Purification, biochemical characterization, and biological function of human esterase D. Proc Natl Acad Sci U S A 83: 6790–6794.
33. Recktenwald CV, Kellner R, Lichtenfels R, Seliger B (2008) Altered detoxification status and increased resistance to oxidative stress by K-ras transformation. Cancer Res 68: 10086–10093.