zur
Erlangung der Doktorwürde der
Naturwissenschaftlich-Mathematischen Gesamtfakultät der
Ruprecht - Karls - Universität Heidelberg
vorgelegt von
Thema
GENE EXPRESSION PROFILING
REVEALS NOVEL ACTIONS OF GLUCOCORTICOIDS ON IMMUNE CELLS DURING INFLAMMATION
Gutachter:
Prof. Dr. Günther Schütz Prof. Dr. Richard Herrmann
1. SUMMARY 1
2. INTRODUCTION 3
2. 1. PRIMING THE INNATE IMMUNE REPONSE 3
2. 2. ANTI-INFLAMMATORY ACTIONS OF GLUCOCORTICOIDS 6
2. 2. 1. GLUCOCORTICOID RECEPTOR IN THE REGULATION OF GENE TRANSCRIPTION 6 2. 2. 2. FUNCTIONAL AND CELL-SPECIFIC MUTATIONS OF THE GLUCOCORTICOID RECEPTOR 9
2.3. MOLECULAR LINK BETWEEN LPS AND GR SIGNALLING IN MACROPHAGES;
GENE EXPRESSION PROFILING METHODOLOGIES 11
2. 3. 1. SUPPRESSIVE SUBTRACTIVE HYBRIDIZATION 12
2. 3. 2. GENE ARRAYS 13
3. AIM OF THE PROJECT 15
4. 2. 1. 2. Quantitative expression analysis of transcripts obtained by the SSH:
Evaluation of SSH-array data using real-time quantitative PCR 29 4. 2. 2. THE EFFECTS OF GCs ON THE EXPRESSION OF LPS TARGET GENES IN PERITONEAL
MACROPHAGES FROM WILD TYPE AND GR MUTANT MICE 31 4. 2. 3. IDENTIFICATION OF DIFFERENTIALLY EXPRESSED mRNAs BY OLIGONUCLEOTIDE
GENE CHIP ANALYSIS 34
4.3. CORRELATION BETWEEN SSH-ARRAY AND OLIGONUCLEOTIDE GENE CHIP DATA 36
4. 4. PATTERNS OF GENE EXPRESSION; MOLECULAR MECHANISMS OF GR ACTION 40 4. 5. CONSTRUCTING A DATABASE FOR mRNA CHANGES IN PERITONEAL MACROPHAGES
DURING STIMULATION WITH LPS AND GCs 47
5. DISCUSSION 48
5. 1. CRITICAL ASPECTS ON TECHNIQUES TO MONITOR GENE EXPRESSION 48
5. 2. BEYOND GENE EXPRESSION PROFILING 50
5. 3. SIGNATURES OF INFLAMMATION 51
5. 4. THE CONSEQUENCES OF LPS ACTIVATION OF PERITONEAL MACROPHAGES AND
THE MODULATORY ROLE OF GCs 51
5. 4. 1. LPS ACTIVATES THE TNF-α SIGNALLING PATHWAY 62
6. MATERIAL AND METHODS 67
6. 1. BIOLOGICAL MATERIAL 67
6. 1. 1. MOUSE STRAIN MODELS 67
6. 1. 2. CLONING VECTOR AND BACTERIAL STRAIN 67
6. 1. 3. PRIMERS USED 68
6. 1. 4. OLIGONUCLEOTIDE GENE CHIP ARRAYS 70
6. 2. 2. MOLECULAR CLONING 71
6. 2. 3. PLASMID DNA ISOLATION 72
6. 2. 4. DNA/RNA ELECTROPHORESIS 72
6. 2. 5. POLYMERASE CHAIN REACTION 73
6. 2. 6. QUANTITATIVE REAL-TIME PCR 73
6. 2. 7. PCR-BASED AUTOMATIC SEQUENCING 77
6. 2. 8. RNA ISOLATION 77
6. 2. 9. RNASE PROTECTION 77
6. 2. 10. SUPPRESSIVE SUBTRACTIVE HYBRIDIZATION 78
6. 2. 11. GENE ARRAY CONSTRUCTION ON NYLON MEMBRANES 81
6. 2. 12. PROBE PREPARATION AND HYBRIDISATION OF SSH-ARRAYS 81
6. 2. 13. IMAGE ANALYSIS AND DATA INTERPRETATION 82
6. 2. 14. PROBE PREPARATION AND HYBRIDISATION OF OLIGONUCLEOTIDE CHIP ARRAYS 83
6. 2. 15. BIOINFORMATICS AND DATABASE DEVELOPMENT 86
7. ACKNOWLEDGEMENTS 88
10. 1. GENE EXPRESSION PROFILES 111
10. 2. GROUP 1-A 112
10. 2. 1. EXPRESSION LEVELS OF GENES/ESTS REPRESENTING GROUP 1-A 113 10. 2. 2. NORMALISED EXPRESSION OF GENES/ESTS REPRESENTING GROUP 1-A 122
10. 3. GROUP 1-B 131
10. 3. 1. EXPRESSION LEVELS OF GENES/ESTS REPRESENTING GROUP 1-B 132 10. 3. 2. NORMALISED EXPRESSION OF GENES/ESTS REPRESENTING GROUP 1-B 137
10. 4. GROUP 1-C 142
10. 4. 1. EXPRESSION LEVELS OF GENES/ESTS REPRESENTING GROUP 1-C 143 10. 4. 2. NORMALISED EXPRESSION OF GENES/ESTS REPRESENTING GROUP 1-C 146
10. 5. GROUP 1-D 149
10. 5. 1. EXPRESSION LEVELS OF GENES/ESTS REPRESENTING GROUP 1-D 150 10. 5. 2. NORMALISED EXPRESSION OF GENES/ESTS REPRESENTING GROUP 1-D 153
10. 6. GROUP 1-E 156
10. 6. 1. EXPRESSION LEVELS OF GENES/ESTS REPRESENTING GROUP 1-E 157 10. 6. 2. NORMALISED EXPRESSION OF GENES/ESTS REPRESENTING GROUP 1-E 160
10. 7. GROUP 2-A 163
10. 7. 1. EXPRESSION LEVELS OF GENES/ESTS REPRESENTING GROUP 2-A 164 10. 7. 2. NORMALISED EXPRESSION OF GENES/ESTS REPRESENTING GROUP 2-A 171
10. 8. GROUP 2-B 178
10. 8. 1. EXPRESSION LEVELS OF GENES/ESTS REPRESENTING GROUP 2-B 179 10. 8. 2. NORMALISED EXPRESSION OF GENES/ESTS REPRESENTING GROUP 2-B 182
10. 9. GROUP 2-C 185
10. 9. 1. EXPRESSION LEVELS OF GENES/ESTS REPRESENTING GROUP 2-C 186 10. 9. 2. NORMALISED EXPRESSION OF GENES/ESTS REPRESENTING GROUP 2-C 189
1. SUMMARY
The innate immune response is triggered by bacterial activators such as lipopolysaccharide (LPS) which, upon binding to CD14 and TLR4 receptors on responsive cells, is able to activate numerous cell signalling events. This leads to cytokine and chemokine secretion, complement activation, eicosanoides synthesis, production of reactive oxygen intermediates, nitric oxide and other mediators, which co-ordinate the body's response to inflammation. In addition to the beneficial effects of such a response to LPS, this activation also accounts for the pathophysiologic state usually observed in septic shock. To suppress the ongoing inflammation, several glucocorticoid-based drugs have been used. Their efficacy as immunosuppressive and anti- inflammatory agents is based upon their ability to activate the glucocorticoid receptor (GR) which in turns predominantly mediates transrepression of target genes.
A combination of array-based technologies and subtractive suppressive hybridisation has allowed for the identification of genes that are altered upon activation of peritoneal macrophages by LPS, and those whose expression is further modulated upon administration of glucocorticoids
Summary
transcription factors such as AP-1 and NF-κB, which are independent of binding to DNA, are preserved. Only a small subset of all GC-regulated genes in peritoneal macrophages (12 out of 106) were identified as also being modulated by GCs in GRdim cells. On the other hand, the expression of 94 (89%) of GC-responsive genes/ESTs was not modulated in peritoneal macrophages from GRdim mice. Cell-specific GRLysCre mutant mice lack the GR in cells of the myeloid lineage. Survival of GRLysCre mutants upon LPS injection has been shown to be severely impaired compared to wild type mice. Gene expression profiling of PMΦ from GRLysCre mice confirmed the GR-specificity of GC action, since induction or repression of target genes by GCs was abolished in these cells.
The combination of state of the art expression profiling approaches with the use of function- selective and tissue-specific GR mouse mutants led to the conclusion that activation of macrophages by LPS evokes rapid transcription of various pro- and anti-inflammatory mediators.
Furthermore, this analysis highlights the importance of both DNA-binding dependent and independent actions of the GR in modulating cell responses to inflammatory stimuli. Finally, identifying the spectrum of genes whose expression is influenced by GCs will allow development of selective GC-based drugs able to discriminate between two mechanisms of GR actions, thus contributing to better anti-inflammatory therapies.
2. INTRODUCTION
2. 1. PRIMING THE INNATE IMMUNE REPONSE
The immune system of higher vertebrates consists of two components: innate and adaptive [1]. The immediate, innate response is mediated largely by macrophages and granulocytes (e.g.
neutrophils), cells that phagocyte the pathogens and concurrently co-ordinate additional host responses by synthesising a wide range of inflammatory mediators [2]. Once internalised by macrophages, the infectious agent is degraded within the maturing phagosome and the components of the pathogen are presented to T cells. This results in activation of the adaptive immune response and establishment of protective immunity [2]. While all multicellular organisms have some form of innate host defence system, adaptive immunity occurs only in vertebrates [3].
A major challenge to the innate immune system is to detect and discriminate between a large number of potential pathogens. This task has been achieved by the evolution of a variety of pattern-recognition receptors (PRRs) [4]. PRRs of the innate immune defence system, such as CD14, mannose binding protein, toll-like receptors (TLRs), and alternative complement system are
Introduction
bacterial cell-wall components such as lipopolysaccharide (LPS, endotoxin), lipopeptides, peptidoglycans, lipoteichoic acids, lipoarabinomannan (LAM) and bacterial DNA [4,5].
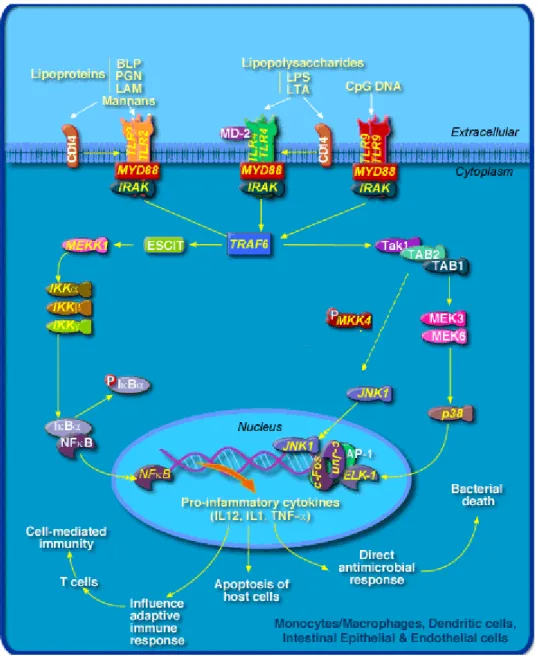
LPS is an essential structural component of the outer membrane of all Gram-negative bacteria [6]. Investigations into the structural components of LPS demonstrated that conserved lipid A region is necessary for LPS stimulation of macrophages [7-9]. Nevertheless, oligosaccharide components of LPS, and more specifically 2-keto-2-deoxyoctulosonic acid (KDO) determinants, may function to facilitate either the initial interaction, or some biochemical signal transductive mechanism [10,11]. Although CD14 is known to bind LPS, this PRR is anchored into the cell membrane by a glycosyl phosphatidylinositol linkage, which suggests that it would have little signalling capacity [6,12,13]. There is now clear evidence that mammalian Toll-like receptors, together with CD14 receptor, mediate the response to LPS [5,10,11,14-21]. TLRs contain a cytoplasmic portion that is homologous to the IL-1 receptor and hence can trigger intracellular signalling pathways [22-27]. These signals, in turn, activate transcription factors (mainly NF-κB and AP-1) which trigger a wide variety of cellular responses, including cytokine and chemokine production, release of reactive oxygen and nitrogen intermediates all of which are responsible for the pathophysiologic reaction (Figure 1) [24,28]. Despite the intense research on LPS, it is now clear that other microbial products also act as potent activators of innate immunity and that the immune system encounters a 'cocktail' of these molecules when interacting with pathogens in vivo.
Overactivation of the inflammatory response by LPS and other pathogens can lead to irreversible destruction of organs and tissues (i.e. multiorgan dysfunction syndrome), and eventually death [5,29-31].
Figure 1. Signalling pathways through which LPS might activate the transcription of
Introduction
2. 2. ANTI-INFLAMMATORY ACTIONS OF GLUCOCORTICOIDS
The characteristics of the inflammatory response and the site of inflammation differ depending on the invading pathogenic agent, but all involve the recruitment and activation of inflammatory cells and the production of various proteins that are involved in the complex inflammatory cascades [32]. The increased expression of cytokines, chemokines, growth factors, enzymes, receptors and adhesion molecules is the result of enhanced gene transcription/translation since many of them are not expressed under normal resting conditions [32,33]. Glucocorticoids (GC) have been demonstrated to block the expression of multiple cytokines and chemokines. This inhibition has been reported to occur at the transcription level for IL-1 to IL-6, IL-11, IL-12, IL-13, TNF-α and M-CSF [34-38]. Most of these genes require transcription factors, such as AP-1, NF-κB, or NF-AT, for their expression, suggesting that GCs may exert their anti-inflammatory function by interfering with the activity of some of these factors.
This may explain their therapeutic efficacy in the treatments of allergic diseases (rhinitis, atopic dermatitis), asthma, rheumatoid arthritis, inflammatory bowel disease and autoimmune diseases which are marked by high expression of interleukins and other mediators [34].
2. 2. 1. Glucocorticoid receptor in the regulation of gene transcription
GCs exert their effects by binding to the glucocorticoid receptor (GR), which is predominantly localised in the cytoplasm of target cells [39-41]. Inactivated GR is bound to a protein complex of approximately 300 kDa that includes two molecules of heat-shock protein (hsp90), an immunophilin protein and various other inhibitory proteins [42]. The hsp90 molecules act as a molecular chaperone, preventing the unoccupied GR from translocating to the nuclear compartment, in the absence of a ligand [42]. Once the ligand binds to the GR, hsp90 dissociates, thus exposing two nuclear localisation signals on GR allowing the activated GR-ligand complex to rapidly move into the nucleus and bind to DNA.
The activated GR then directly or indirectly regulates the transcription of target genes (Figure 2) [40,43]. Transactivation by the GR requires binding of receptor homodimers to consensus glucocorticoid response elements (GREs), defined as the palindromic 15 bp sequence AGAACAnnnTGTTCT (where n is any nucleotide), in the promoter region of glucocorticoid- responsive genes [44,45]. Recent evidence suggests that the GR dimer undergoes a cycle of non- specific bindings to DNA in which it attaches and dissociates repeatedly until a high-affinity GRE site is encountered [46]. Whereas the mechanism of transactivation is well characterised, transrepression of target genes by steroid hormones is much less understood.
Most genes that are negatively regulated by the GR do not contain a classical GRE, and therefore, distinct modes of action using different classes of response elements, namely negative, composite, and tethering GREs, have been proposed to account for transrepression [47-50]. Negative GREs have been found in only a few genes and require DNA binding of the GR, as exemplified by the pro-opiomelanocortin (POMC) gene (Figure 2) [49].
GR may also inhibit protein synthesis by reducing the stability of mRNA containing constitutive AU- rich elements in the 3'-UTR, thus shortening the turnover time of the mRNA [51]. This is a mechanism whereby GCs inhibit the synthesis of the cytokine granulocyte-macrophage colony- stimulating factor (GM-CSF), which plays a key role in the survival of inflammatory cells at the site of inflammation [52]. This mechanism may also be important for the repressive effect of GCs on inducible cyclooxygenase (COX-2) expression [53,54].
Finally, at composite elements, such as in the proliferin gene promoter, the GR contacts DNA together with another transcription factor, whereas at tethering elements, repression is mediated by
Introduction
between signal transducers and activators of transcription (STATs) proteins, such as STAT3, STAT5 and STAT6 [67-71]. This suggests that GCs modulate either the binding or activation of these transcription factors and thus modify the expression of inflammatory genes. The repressive action of GCs may be due to competition between GR and the binding sites on CBP for other transcription factors including AP-1, NF-κB, Sp1, Ets, NF-AT and STATs [72-74]. The interactions between activated GR and transcription factors usually occur within the nucleus, but may also occur in the cytoplasm [75]. Alternatively, activated GR may bind to one of several transcriptional co-repressor molecules that have different histone deacetylase activity. This would result in the deacetylation of histones, tightening of DNA around histone residues and thus reduced access of transcription factors such as AP-1 and NF-κB to their binding sites and finally the repression of inflammatory genes [76,77].
Figure 2. Classical model of glucocorticoid action
Glucocorticoids enter the cell and bind to cytoplasmic glucocorticoid receptor (GR) that is complexed with two molecules of heat shock protein (hsp90). The ligand bound receptor translocates to the nucleus where, as a dimer, it binds to glucocorticoid recognition sequences (GRE) in the 5'-upstream promoter sequence of glucocorticoid-responsive genes. GREs may increase transcription and negative (n)GREs may decrease transcription, resulting in increased or decreased mRNA synthesis. Direct interaction between the transcription factors AP-1 and NF-κB and the GR may result in mutual repression. In this way glucocorticoids may counteract the chronic inflammatory effects of cytokines which activate these transcription factors. A positive interaction between GR and STAT5 suggests that GCs may enhance the effects of certain cytokines.
2. 2. 2. Functional and cell-specific mutations of the glucocorticoid receptor
Introduction
GR-/- mice, which die shortly after birth due toa number of severe abnormalities, GRdim mice are viable, showing that DNA-binding independent activities of GR are important for survival [79,80]. In GRdim animals, dexamethasone was able to inhibit AP-1-driven gene transcription, but the ability to facilitate GRE-mediated effects such as cortisol suppression, erythroblast proliferation and T cell apoptosis were markedly inhibited [79].
It has been previously described that cells of myeloid lineage play a major role in the maintenance of tissue homeostasis and immunological defence. In particular, the mononuclear phagocytes, including blood monocytes and resident tissue macrophages, are of key importance for the establishment of innate immunity as well as the cytokine-mediated regulation of acquired immune responses [3]. The in vivo contribution of GR signalling in establishing the proper innate immune response has been demonstrated by generation of a mouse mutant, which has the GR selectively inactivated in macrophages and granulocytes (F. Tronche et al., unpublished). In order to conditionally target these cells for the expression of the GR, a modified GRflox/flox allele was generated, using homologous recombination in embryonic stem cells, where exon 3, which encodes the first zinc-finger of the GR DNA-binding domain, was flanked by two loxP sites (Figure 3) [81]. Mice homozygous for GRflox/flox appeared normal and expression of the GR protein was identical to that of wild type mice. GRflox/flox mice were crossed with mice expressing the Cre recombinase under murine M lysozyme promoter (LysMcre mice) [82,83]. This resulted in generation of viable GRflox/flox;LysCre mutant mice, abbreviated further as GRLysCre (F. Tronche et al., unpublished data). Preliminary studies investigating the possible impact of the altered cytokine response in GRLysCre mice, conducted by determining the survival rate upon LPS injection, revealed an enhanced mortality of these mice in comparison to control littermates (F. Tronche, H. M.
Reichardt, A. Bauer, unpublished data), thus underscoring the importance of GR signalling in myeloid cells for protection against an overshooting inflammatory response.
Figure 3. Targeted disruption of the GR locus
The murine GR gene and its domains are depicted at the top, with the relative position of exons 1-9 indicated. Modified GR loci are denoted as GRdim and GRflox/flox. A point mutation (alanine 458 to threonine) was introduced into the second zinc finger (exon 4) in the DNA-binding domain of the GRdim/dim allele. The GRflox/flox allele was constructed to have exon 3, which encodes the first zinc finger of the GR DNA-binding domain, flanked by two loxP sites (triangles).
2. 3. MOLECULAR LINK BETWEEN LPS AND GR SIGNALLING IN MACROPHAGES; GENE EXPRESSION PROFILING METHODOLOGIES
LPS is thought to stimulate macrophages to respond more rapidly and effectively against
Introduction
large numbers of genes, and/or to identify those that are differentially expressed between two or more given populations. Some of these methods are designed for de novo isolation of genes expressed at different levels in samples being compared. Most of these techniques are limited in that they are only capable of analysing a limited number of transcripts simultaneously and do not provide quantitative data on expression levels. Examples include differential display (DD) [89], representation difference analysis (RDA) [90,91], and suppressive subtractive hybridisation (SSH) [92]. The following methods, provide direct information about transcript abundance, as they exploit high-throughput sequencing and sequence databases either to estimate transcript abundance, e.g.
EST numerical analysis and serial analysis of gene expression (SAGE) [93,94], or to construct DNA microarrays of thousands of gene sequences derived from the databases using either nylon membranes of glass slides as solid support (e.g. gene fragments arrays or oligonuclotide arrays) [95,96]. The latter allow the expression of hundreds of genes to be studied simultaneously without biasing conclusions drawn from a subset of genes presumed to be involved in a process under investigation.
2. 3. 1. Suppressive subtractive hybridization
Suppressive subtractive hybridisation is a powerful approach to identify and isolate cDNAs of differentially expressed genes [92,97-100]. The method is designed to selectively amplify target cDNA fragments and simultaneously suppress nontarget cDNA amplification [92,101]. It overcomes the problem of differences in mRNA abundance by incorporating a hybridisation step that normalises (equalises) sequence abundance during the course of subtraction by standard hybridisation kinetics. With a single subtractive hybridisation round, greater than 1,000-fold enrichment for differentially expressed cDNAs can be achieved [92,101]. SSH generates small cDNAs ranging from 50 to ~1,000 bp which can be from any part of the mRNA. While this methodology is more high-throughput and generates less false positives then DD-RTPCR, the short cDNA fragments need to be subcloned or extended to yield more information about the sequence of corresponding transcripts [91,92]. Apart from the characterisation of known
transcripts, SSH also permits the isolation of novel, uncharacterised genes. However, its major drawback is the inability to quantitatively measure the expression of enriched cDNAs. For this purpose, additional mRNA quantitative methods have to be included to determine the expression levels of subtracted genes/ESTs.
2. 3. 2. Gene arrays
Array-based technologies have made it straightforward to simultaneously monitor the expression pattern of thousands of genes across a wide variety of tissues, cell types, and conditions [95,96,102]. The technique is amenable to the analysis of a few hundred well-defined genes or family members as well as to the monitoring of 'global' expression profiles of the entire complement of an organism's expressed genes [103-107]. In addition to providing broad and in- depth information on gene expression patterns, gene microarrays are a powerful tool to dissect the mechanism of action of drug candidates and their metabolic pathways, and/or to identify potential markers to follow effect and dose of drugs in the clinical setting [104,108-110].
Microarrays of gene fragments (PCR/cDNA products) are typically constructed using sequences of characterised genes and/or ESTs [96,111,112]. Nevertheless, one can also readily array inserts from clones randomly picked from a cDNA or subtracted library [107]. The oligonucleotide gene expression chip (Affymetrix, Santa Clara, CA) is designed to contain 25-mer oligonucleotide sequences from a gene/EST of interest tiled directly on the solid glass wafer. The oligonuclotides are organised as perfect match/mismatch pairs (PM/MM) with the mismatch acting as a control for
Introduction
abundant mRNA, improved signal-to-noise ratio, standardised software systems for the collection, quality scoring, and tracking of data, as well as extracting biological information from the immense amount of data [105,113].
3. AIM OF THE PROJECT
One way to decipher the molecular events of the macrophage response during inflammation caused by LPS, and the modulatory role of GCs on this process, is to determine differential changes in genes expression.
To meet this objective, suppressive subtractive hybridisation (SSH) and gene array hybridisation approaches, techniques that rely on quantitative and qualitative analysis of mRNA content, were employed. In order to confirm that GC effects are mediated specifically via the GR, and to dissect the mechanisms of GR actions on modulating the expression of LPS induced/repressed genes, gene expression profiling analysis was performed using peritoneal macrophages obtained from GRLysCre and GRdim mutant mice. Dimerisation-defective GRdim mice will address whether GCs-mediated induction/repression of LPS-target genes is achieved in a DNA-binding dependent or independent manner by GR interaction with other transcription factor (proteins).
The results obtained using a combination of state of the art expression profiling approaches with functional and tissue-specific mouse mutants should provide a deeper understanding of the molecular pathogenesis of LPS and the molecular mechanisms of anti-inflammatory actions of GCs.
Results
4. RESULTS
4. 1. In vitro CULTURE OF PERITONEAL MACROPHAGES
Macrophages have evoked the ability to recognise bacterial products and to initiate an immune response to clear the invading agent [85]. An innate pattern of this response is triggered by LPS, which promotes rapid changes in signalling pathways within macrophages and adaptive changes in gene expression [6,85]. In order to examine how the gene expression profile in macrophages is affected upon LPS stimulation, an in vitro model of peritoneal macrophages was established. To obtain primary peritoneal macrophages (PMΦ), mice were injected intra-peritoneal with thioglycollate and the cells were harvested by peritoneal lavage [114]. To confirm that the isolated cells were macrophages and to determine the purity, immunohistochemical staining was performed with M3/84 macrophage monoclonal antibody, which detects Mac-3 antigen on tissue and thioglycollate-elicited PMΦ. After overnight culture, 90-95% of the adherent cells stained positively for the expression of Mac-3 as illustrated in Figure 4. The remaining 5-10% of the cells represented mostly lymphocytes and some granulocytes.
lymphocyte
macrophage
Figure 4. Staining of macrophage cytospin section using M3/84 antibody Cytospin sections were prepared using 100,000 cells obtained by peritoneal lavage. Immunohistochemical staining was performed with the M3/84 antibody which reacts with the Mac-3 antigen expressed on mononuclear phagocytes. The analysis was performed by Prof. Dr. H-J. Gröne from the Department of Cell and Molecular Pathology, German Cancer Research Centre, Heidelberg.
In order to monitor the process of macrophage activation by LPS, isolated PMΦ were treated with LPS and the mRNA expression of two major proinflammatory cytokines known to be induced by LPS (TNF-α and IL-6) was measured using the RNase protection assay. Already after 30 min of LPS (100 ng/ml) application, the mRNA expression of both cytokines was increased and reached a maximum at 1h (42-fold increase) and 6h (16-fold increase) for TNF-α and IL-6, respectively
Results
Figure 5. Time course of TNF-α and IL-6 mRNA expression upon LPS- stimulation of PMΦ
mRNA expression of TNF-α and IL-6 was analysed by RNase protection using total RNA obtained from unstimulated PMΦ and cells stimulated by LPS (100 ng/ml) for the indicated times. α-32P-UTP antisense RNA probes for TNF-α, IL-6 and cytochrome C (cyt-C) were in vitro transcribed and hybridised against 5 µg of total RNA from each treatment. Cyt-C was used to normalise the data. Signal intensities were quantified by PhosphoImager and the analysis is shown in the lower panel. The data are representative of two RNase protection experiments.
0 10 20 30 40 50
0 2 4 6 8 10 12 14 16 18 20 22 24
time (hours) fold
induction
IL-6/cyt TNF-alpha/cyt IL-6
cyt-C TNF-α
0´ 30´ 1h 2h 6h 10h 24h
4. 2. GENE EXPRESSION PROFILING OF PERITONEAL MACROPHAGES
As demonstrated previously, LPS promotes rapid production of TNF-α, IL-6 and other pro- and anti-inflammatory mediators, which are involved in the endotoxin signalling cascade [85]. To address experimentally early LPS-mediated activation events, PMΦ were stimulated in vitro by LPS (100 ng/ml) for 2h. Further more, the role of glucocorticoids (GC) in modulating the LPS elicited response at molecular level was investigated upon dexamethasone administration to PMΦ (1 µM dex added 1h prior to LPS).
In order to decipher the molecular mechanisms of GC-mediated action, mice containing two different types of mutation in the GR were used in this study. GRdim mutant mice were generated by gene targeting to have impaired dimerisation. However, those GR interactions, which are independent of receptor binding to DNA, are preserved in these mice [79]. The second strain of mutant mice, GRLysCre, have been generated to selectively lack the GR in cells of the myeloid lineage and are therefore expected to be refractory to GC treatment (Dr. F. Tronche, unpublished data).
Differential gene expression of LPS-stimulated PMΦ and the modulatory role of GCs on this process was examined by exploiting the methods of suppressive subtractive hybridisation (SSH) combined with real-time quantitative PCR, and oligonucleotide gene chip arrays.
Results
In order to identify genes and ESTs differentially expressed in LPS stimulated PMΦ, a subtracted and normalised library was constructed using the SSH technology (see Material and Methods Section). The mRNAs prepared from LPS-stimulated PMΦ of wild type animals (tester) were subtracted against unstimulated mRNAs (driver). The resulting cDNA pool should thus be enriched for transcripts that are up regulated in LPS stimulated cells. 290 clones were picked from the SSH library and processed by automatic PCR sequencing. This analysis revealed 212 clones containing inserts of 300-500 bp in size on average, which were used in homology search in GenBank and EMBL databases using BLAST (available at http://www.ncbi.nlm.nih.gov/BLAST/) algorithm. An outline of the procedure is given in Figure 6. The results of the database homologies found were classified into the following categories: known mouse genes (for sequences with high identity over the majority of the insert) and ESTs (expressed sequence tags of unknown function which are either homologous to mouse ESTs or represent novel transcripts). 61 known genes were identified from the SSH library screen. They were grouped into 8 functional categories based on the information derived from the PubMed literature, as shown in Table 1. Some genes were represented by multiple SSH-fragments, which often derived from different parts of the gene. For example, the immune-responsive gene (Irg1) was represented by 10 SSH-fragments. However, most identified genes were represented by only one or two SSH-fragments. Out of 76 ESTs obtained, 63 had partial homologies to sequences in the databases whereas 13 ESTs corresponded to novel transcripts.
292 sequenced clones
80 clones
with non-readable or vector sequences
212 clones
with SSH-fragments used for database homology search
136 SSH-fragments corresponding to 61 known mouse gene
76 SSH-fragments corresponding to 63 homologous ESTs and 13 novel ESTs
Results
Table 1. Functional classes of homologous genes found in the SSH library
4. 2. 1. 1. Quantitative expression analysis of transcripts obtained by SSH: Measuring the expression levels on nylon arrays containing transcripts from SSH-library
In order to enable a high-throughput quantitative expression analysis of subtracted genes/ESTs, with the intent of identifying those associated with the LPS phenotype in PMΦ, gene array technology was employed [95,111]. For this purpose, inserts from SSH clones were PCR amplified and spotted on to nylon Hybond N+ membranes using robotic printing. Multiple housekeeping genes and randomly selected DNAs were also spotted and served as internal/normalisation controls. The 'SSH-arrays' were then hybridised with α-32P dATP labelled first strand cDNA probes derived from the tester and driver samples (Figure 7). To permit comparison between multiple array experiments, the data set were normalised to each other using the average expression level of selected house-keeping genes (for details see Material and Methods).
Results
A. unstimulated (ctrl)
1 2 3 4 5 6 7 8 9 10 11 12
B. stimulated with LPS (LPS)
1 2 3 4 5 6 7 8 9 10 11 12
C. Comparison of expression levels in unstimulated and LPS-stimulated PMΦ
Figure 7. Expression profile of LPS-stimulated PMΦ as assessed by hybridisation of SSH-arrays
The SSH-arrays were hybridised with α-32P dATP-labelled first-strand cDNA probe derived
Results
Using the criteria of differential expression by a factor of two or more, the expression level of 34, out of 140 unique SSH genes/ESTs, were found to be induced by LPS. These mRNAs correspond to 21 known genes and 13 ESTs which are listed in Table 2. The gene information provided by SSH-array analysis is available at http://www.dkfz.de/tbi/macrophage.
cted genes/ESTs upon LPS stimulation of PMΦ by array hybridisation
Results
The table illustrates hybridisation intensities from SSH-array experiments of 21 genes and 13 ESTs, whose expression was increased by more than 2-fold upon LPS stimulation in comparison to levels in unstimulated cells. The hybridisation intensities of unstimulated (ctrl) and LPS-stimulated PMΦ (LPS) are shown as average values, calculated from two or three hybridisation experiments, indicated as #1, #2 and #3. Fold changeis calculated relative to the value from unstimulated cells (LPS / ctrl). Values obtained by SSH-array hybridisation analysis are indicated in yellow. ctrl - unstimulated PMΦ from wild type mice; LPS - PMΦ from wild type mice stimulated for 2 h with LPS (100 ng/ml); StDev - Standard deviation; Acc. Num. - Accession Number; ~ - no data available
4. 2. 1. 2. Quantitative expression analysis of transcripts obtained by the SSH:
Evaluation of SSH-array data using real-time quantitative PCR
Quantitative real-time PCR (LightCycler, Roche) was used to confirm and more accurately measure differential expression of 21 genes, identified by SSH-array analysis. This method allows measurements to be made during the log-linear phase of a PCR, in contrast to conventional PCR, where quantification is acquired only in the plateau phase (end-point determination) [115]. For this purpose, fluorescent dsDNA SYBR Green I dye was used, which allowed on-line monitoring of product synthesis during each PCR cycle. The hypoxanthine phosphoribosyltransferase (HPRT) gene was used as an 'external standard' and normalisation reference gene. The analysis was performed using first strand cDNAs obtained from unstimulated and LPS stimulated PMΦ from wild type mice. The expression of 21 LPS-inducible genes evaluated by real-time quantitative PCR is shown in Table 3.
Results
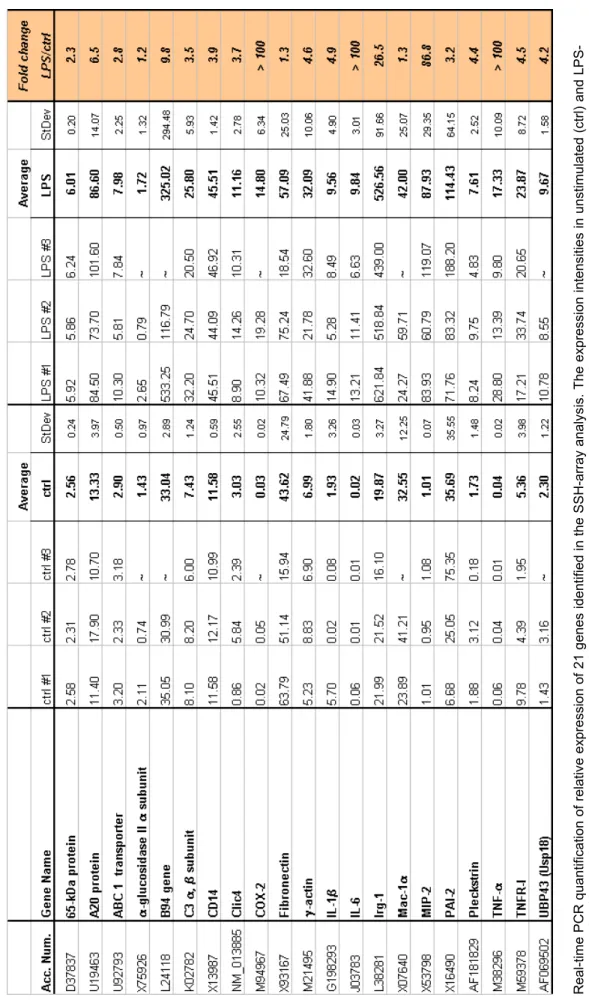
R
Table 3. Confirmation and quantification of relative gene expression by real-time quantitative PC Real-time PCR quantification of relative expression of 21 genes identified in the SSH-array analysis. The expression intensities in unstimulated (ctrl) and LPS- stimulated (LPS) cells from wild type mice were quantified and normalised to HPRT expression. The fold change was calculated relative to the value from unstimulated cells (LPS / ctrl). The average values from two or three real-time PCR experiments (indicated as #1, #2 and #3) are indicated in orange. ctrl - unstimulated PMΦ from wild type mice; LPS - PMΦ from wild type mice stimulated for 2 h with LPS (100 ng/ml); StDev - Standard deviation; Acc. Num. - Accession Number; ~ - no data available
The expression of 18 genes determined by real-time PCR correlated well with data obtained by array analysis (see also Table 2). In contrast, a differential expression of less than 2-fold was detected for Mac-1α, fibronectin and α-glucosidase II α subunit by real-time PCR analysis, which did not correlate with the SSH-array results. These genes were classified as non-differentially expressed genes and were excluded from further analysis.
4. 2. 2. The effects of GCs on the expression of LPS target genes in peritoneal macrophages from wild type and GR mutant mice
The SSH approach, substantiated by array and real-time PCR analysis, provided an initial set of 18 genes whose expression was up-regulated upon LPS stimulation. To investigate the role of GCs and the mechanism(s) of GR action on modulating the expression of these genes, PMΦ were treated with dexamethasone (1 µM dex) 1h prior to LPS stimulation (100 ng/ml; 2h).
Differential gene expression was tested in PMΦ from wild type, GRdim and GRLysCre mice upon LPS and dex+LPS stimulation, using real-time quantitative PCR [79,115]. Table 4 summarises the expression patterns of 9, out of 18 LPS-inducible genes, which were strongly modulated by GCs in PMΦ from wild type mice. The expression levels of Irg-1, B94, A20 protein, γ-actin, TNFR-I, Pleckstrin, C3 α, β subunit, 65-kDa cytosolic protein and ABC1 transporter remained unchanged upon GCs administration (data not shown).
Results
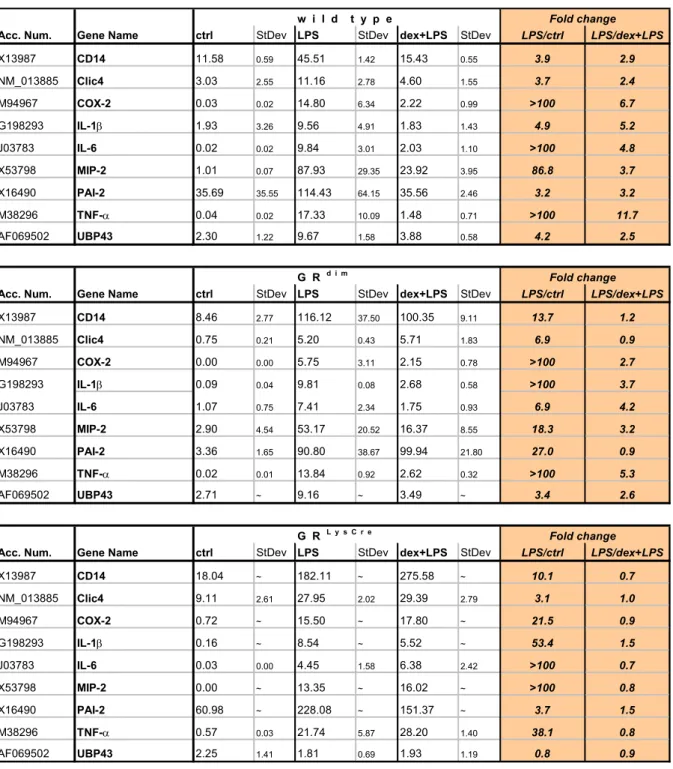
Table 4. Comparison of differential expression of LPS target genes upon GC-stimulation of PMΦ from wild type and GR mutant mice
Quantification of relative gene expression upon LPS and dex+LPS stimulation of PMΦ was analysed using real-time PCR. Listed are those 9 genes whose mRNA expression levels were elevated by LPS and modulated by GCs by more than 2-fold. The expression intensities were quantified and normalised to HPRT expression. The fold change was calculated relative to the value from unstimulated cells (LPS / ctrl), and relative to cells stimulated with dex+LPS (LPS / dex+LPS). The data represent average values from two to three real-time PCR experiments. Values obtained by real-time PCR analysis are indicated in orange.
ctrl - unstimulated PMΦ; LPS - PMΦ stimulated for 2 h with LPS (100 ng/ml); StDev - Standard deviation; ~ - no data available
w i l d t y p e Fold change Acc. Num. Gene Name ctrl StDev LPS StDev dex+LPS StDev LPS/ctrl LPS/dex+LPS
X13987 CD14 11.58 0.59 45.51 1.42 15.43 0.55 3.9 2.9
NM_013885 Clic4 3.03 2.55 11.16 2.78 4.60 1.55 3.7 2.4
M94967 COX-2 0.03 0.02 14.80 6.34 2.22 0.99 >100 6.7
G198293 IL-1β 1.93 3.26 9.56 4.91 1.83 1.43 4.9 5.2
J03783 IL-6 0.02 0.02 9.84 3.01 2.03 1.10 >100 4.8
X53798 MIP-2 1.01 0.07 87.93 29.35 23.92 3.95 86.8 3.7
X16490 PAI-2 35.69 35.55 114.43 64.15 35.56 2.46 3.2 3.2
M38296 TNF-α 0.04 0.02 17.33 10.09 1.48 0.71 >100 11.7
AF069502 UBP43 2.30 1.22 9.67 1.58 3.88 0.58 4.2 2.5
G R d i m Fold change
Acc. Num. Gene Name ctrl StDev LPS StDev dex+LPS StDev LPS/ctrl LPS/dex+LPS
X13987 CD14 8.46 2.77 116.12 37.50 100.35 9.11 13.7 1.2
NM_013885 Clic4 0.75 0.21 5.20 0.43 5.71 1.83 6.9 0.9
M94967 COX-2 0.00 0.00 5.75 3.11 2.15 0.78 >100 2.7
G198293 IL-1β 0.09 0.04 9.81 0.08 2.68 0.58 >100 3.7
J03783 IL-6 1.07 0.75 7.41 2.34 1.75 0.93 6.9 4.2
X53798 MIP-2 2.90 4.54 53.17 20.52 16.37 8.55 18.3 3.2
X16490 PAI-2 3.36 1.65 90.80 38.67 99.94 21.80 27.0 0.9
M38296 TNF-α 0.02 0.01 13.84 0.92 2.62 0.32 >100 5.3
AF069502 UBP43 2.71 ~ 9.16 ~ 3.49 ~ 3.4 2.6
G R L y s C r e Fold change
Acc. Num. Gene Name ctrl StDev LPS StDev dex+LPS StDev LPS/ctrl LPS/dex+LPS
X13987 CD14 18.04 ~ 182.11 ~ 275.58 ~ 10.1 0.7
NM_013885 Clic4 9.11 2.61 27.95 2.02 29.39 2.79 3.1 1.0
M94967 COX-2 0.72 ~ 15.50 ~ 17.80 ~ 21.5 0.9
G198293 IL-1β 0.16 ~ 8.54 ~ 5.52 ~ 53.4 1.5
J03783 IL-6 0.03 0.00 4.45 1.58 6.38 2.42 >100 0.7
X53798 MIP-2 0.00 ~ 13.35 ~ 16.02 ~ >100 0.8
X16490 PAI-2 60.98 ~ 228.08 ~ 151.37 ~ 3.7 1.5
M38296 TNF-α 0.57 0.03 21.74 5.87 28.20 1.40 38.1 0.8
AF069502 UBP43 2.25 1.41 1.81 0.69 1.93 1.19 0.8 0.9
A comparison of differential gene expression in unstimulated, LPS and dex+LPS stimulated cells from wild type, GRdim and GRLysCre mice, demonstrated that the expression levels of 18 LPS- inducible genes identified in wild type PMΦ were also increased in PMΦ derived from GR mutant mice. Therefore, the cell response to LPS does not involve the activation of GR-dependent genes.
Of these 18 genes, the expression of 6 (TNF-α, IL-6, IL-1β, MIP-2, COX-2 and UBP43) was down- modulated by GCs by more than 50% in cells of wild type and GRdim mice. In GRdim PMΦ, GCs exert their effects by binding to a dimerisation-defective glucocorticoid receptor, which is able to mediate gene repression by interacting with other proteins, such as NF-κB and AP-1, in a DNA- binding independent manner [79]. 3 genes (CD14, PAI-2 and Clic4) were found to be repressed in PMΦ from wild type but not but not GRdim mice, suggesting that they are regulated in a GR-DNA dependent manner. PMΦ from GRLysCre mice lack a functional GR and are therefore expected to be refractory to GCs. None of the 18 LPS-inducible genes was repressed by GCs in GRLysCre PMΦ, confirming that the observed effects are indeed GR-specific.
Collectively, these data illustrated the use of the SSH technique to obtain numerous transcripts which are differentially expressed in LPS-stimulated PMΦ. Some of the identified genes have already been described in the extensive literature on macrophage biology (e.g. TNF-α, IL-6) [116], whereas others such as ubiquitin binding protein (UBP43) [117] and chloride intracellular channel (Clic) 4 [118], are reported here for the first time as LPS-inducible transcripts. In addition, investigation of GCs modulatory roles on the expression of LPS inducible genes with the use of functional and cell-specific GR mutant mice provided insight into the mechanisms by which GR
Results
4. 2. 3. Identification of differentially expressed mRNAs by oligonucleotide gene chip analysis
Gene chip technology was used in addition to SSH, to provide a more global profiling of differential expression of a variety of genes and gene families encoding for proteins with a wide range of functions [96,110,112]. Although restricted to a number of selected genes and ESTs, a major advantage of this method is the simultaneous profiling and quantitative analysis of mRNA changes in a single hybridisation experiment.
The oligonucleotide gene chip station, provided by the company Affymetrix, Santa Clara, CA, was used to analyse expression patterns of a variety of genes upon LPS-stimulation and to explore the role of GCs in modulating their expression. The MuU74Av2 oligonucleotide gene chip, which contains 12488 oligonucleotide probe sets corresponding to more than 8000 murine genes and 4000 ESTs, was used to reveal patterns of gene expression in unstimulated, LPS stimulated (100 ng/ml; 2h) and dex+LPS stimulated PMΦ (1 µM dex added 1h prior to LPS). Cells were obtained from wild type and two mutant mouse strains, generated by gene targeting to have either impaired dimerisation function of the GR (GRdim) [79], or to lack GR in cells of the myeloid lineage (GRLysCre) (F. Tronche et al., unpublished).
The standard labelling protocol, suggested by Affymetrix, recommends the use of 1 µg of poly(A)+RNA or 8-10 µg of total RNA, as starting material [106,112,119]. The RNA is subjected to one round of mRNA amplification by in vitro transcription (IVT) [119]. This method is believed to maintain the complexity and linearity (relative distribution) of the original mRNA population, and as such should be suitable to produce specific probes for high-throughput studies, and to detect differentially expressed genes [106,112]. A recently published report described a modified amplification protocol, which minimises the generation of template-independent products and generates the sufficient quantities of message-derived material [120]. By applying a second round of cDNA synthesis and in vitro transcription, the required starting material was reduced significantly such that quantities between 2 and 200 ng of total RNA were used [120]. This experiment recaptured very well the trends and salient features of the data set obtained using 10 µg of total RNA in standard Affymetrix protocol, with high correlation coefficients (0.994 > r > 0.984) [120].
Since on average 5-7 µg of total RNA was obtained from one mouse (corresponds to 1-3 x 10⁶ PMΦ), the hybridisation probes were therefore generated using 200 ng of total RNA as staring material and two rounds of IVT according to the modified amplification protocol (for details please refer to the Material and Methods Section).
cRNA probes generated from unstimulated, LPS and dex+LPS-stimulated PMΦ from wild type, GRdim and GRLysCre mice, were hybridised with the MuU74Av2 oligonucleotide gene chips. The array images were captured and reduced to intensity values [Average Differences (AD)] and absolute calls [Present (P) / Absent (A) / Marginal (M)] using GeneChip Software (MicroArray Suite version 4.0, Affymetrix, Santa Clara, CA). The expression level for each gene was derived from the 16 representative oligonucleotide pairs using a trimmed mean algorithm. Those genes/ESTs which were rated as present (P) by the GeneChip software (Affymetrix) and which fulfilled certain criteria were selected for further analysis.
After 2h of LPS treatment, the RNA expression levels of 327 transcripts, corresponding to 158 genes and 169 ESTs, were significantly and reproducibly elevated by more than 2-fold in PMΦ from wild type, GRdim and GRLysCre mice. The expression of 225 of these transcripts was not changed by treatment with GCs in PMΦ from wild type, GRdim or GRLysCre mice. On the other hand, the expression of 102 of the LPS-induced transcripts was modulated by GCs by more than 2-fold in wild type PMΦ. 11 genes/ESTs, out of these 102, were affected by GCs to similar extent in cells from both GRdim and wild type mice, indicating that GR-mediated regulation of these genes is independent of the receptor binding to DNA. 91 genes/ESTs were repressed by GCs in cells from
dim
Results
4. 3. CORRELATION BETWEEN SSH-ARRAY AND OLIGONUCLEOTIDE GENE CHIP DATA
Gene array approaches provided a cross-section of the diversity of macrophage genes, whose mRNA expression levels were altered at a given time point after LPS and/or dex+LPS stimulation. Several of the identified transcripts such as TNF-α, IL-6, COX-2, IL-1β, TNFR-I, MIP-2 and Irg-1 were identified by both SSH and oligonucleotide array analysis confirming the validity of the generated data. In addition, these data showed that changes in patterns of gene expression agreed qualitatively but that there was certain quantitative variation. To ameliorate such discrepancies in order to define the expression pattern(s) of an identified target gene with high reliability, an independent verification using real-time PCR was performed. As illustrated in Table 5, quantitative disagreements were observed when the expression of TNF-α, IL-6, MIP-2 and IL- 1β genes was measured by oligonucleotide gene chip arrays and by real-time PCR. In those cases where array and real-time PCR results were in disagreement, the later were taken as a more reliable measurement of gene expression [115]. This decision was based on experiments showing that real-time quantitative PCR is highly sensitive and reproducible method. The product synthesis and reliable quantification analysis of relative gene expression was observed in intra- (two repeats on one LightCycler run) and inter-assay (two independent runs), over six orders of magnitude under a satisfactory test linearity (0.98 < r < 1.00). Finally, expression of 2 of these questionable genes was further substantiated by RNase protection assays (data not shown).
isted in the expression columns extracted from the respective databases. Differential gene expression by SSH- (yellow), oligonucleotide gene array analysis (green) and real-time PCR (orange). Discrepancies in gene e indicated in blue. with LPS (100 ng/ml); dex+LPS - PMΦ stimulated 1h with dex (1µM) prior to LPS (100 ng/ml; 2 h); Acc. Num.
n patterns
Results
All together, these results suggest that the semiquantitative array techniques can reliably detect trends in altered gene expression but may over or underestimate the magnitude of these changes.
This limitation may not be only due to the method used to estimate gene expression but also due to alternative splice isoforms or closely related genes that give different measurements depending on the sequences (i.e. oligonucleotide) used to represent a gene. Parameters that may contribute to disconcordance between array and real-time PCR results are summarised in Table 6.
cies between arrays and real-time PCR data Oligonucleotide gene chip Real-time quantitative PCR Oligonucleotide probe pairs;Gene-specific primer pairs can be 16 oligonucleotide pairs (PM/MM);designed from any selected part 3'-UTR biasedof a gene; Usual primer length: 18-22 nt; Additional primers can be included to cover other regions of a gene; Gene specificity can be achieved by blasting primer sequences 200 ng of total RNAfirst-strand cDNA (RT using 0.5-2 µg of total RNA) T7 RNA amplification none 1. two rounds of IVT amplification 2. shortening of the 5'-region of template during IVT, due to use of random hexamers 3. fragments are proned to overamplification (preferential amplification of short fragments) fluorescentfluorescent biotin labelling during the last IVT(SYBR Green I dye) ) using 11-bio-NTP) nes;hybridisation of glass slide arrays;PCR amplification; correlation cofficient < 0.9980.98 < correlation cofficient < 1.0 e from a highly homologue gene or splice variant Microarray Suite Genechip software vs. 4.0none rspike-in controls usually one house- keeping gene (defined by manufacturer) Microarray Suite Genechip software; ExcelLightCycler SDM-method (Roche) n arrays (SSH- and oligounucleotide gene chip) and real-time PCR analysis. Several steps that may contribute to disagreement of to the Material and Methods Section; NC - not changed; RT - reverse transcription; IVT - in vitro transcription; SDM -
Results
4. 4. PATTERNS OF GENE EXPRESSION; MOLECULAR MECHANISMS OF GR ACTION
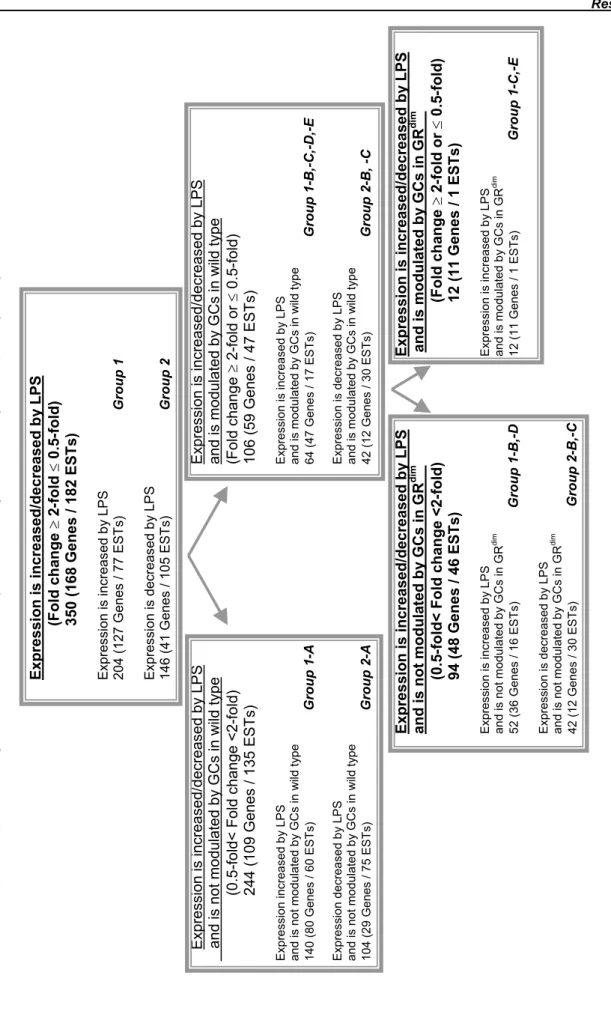
To obtain a broad range of information on the response of PMΦ to LPS stimulation and modulatory role of GCs on this process, SSH and oligonucleotide gene chip techniques were used in the current study. The results which identified differential expression of numerous genes/ESTs in response to LPS suggested that the macrophage's transcriptional machinery undergoes a massive change following this stimulation. Specifically, the expression of 350 Genes/ESTs were found to be modulated by LPS by more than 2-fold. These transcripts were classified into Group 1 (204 genes/ESTs) and Group 2 (146 genes/ESTs), according to whether LPS caused an increase or decrease of gene/EST expression, respectively (Table 7). Similar patterns of gene expressions were also observed in GRdim and GRLysCre PMΦ. Of these 350 LPS-regulated genes/ESTs, 244 (69.7 %) did not respond to GC treatment [Fold change (LPS/dex+LPS) less than 2-fold]. These genes/ESTs are classified into Group 1-A and 2-A (Table 7, Figure 8). Upon LPS-stimulation, the expression level of the 140 gene/ESTs belonging to Group 1-A, was increased by several fold by LPS and was unaffected by treatment with dex+LPS, in PMΦ from wild type, GRdim and GRLysCre mice
(Table 7, Figure 8). Expression level of the 104 genes/ESTs belonging to Group 2-A, where decreased by LPS stimulation.
Of the identified LPS target genes/ESTs, 106 (30.3%) were regulated by GCs, since their expression levels were either down- or up-regulated by dex+LPS treatment of PMΦ obtained from wild type animals (Fold change=LPS/dex+LPS is ≥ 2-fold or ≤ 0.5-fold) (Table 7). It was expected that the expression of some genes/ESTs, upon LPS or dex+LPS stimulation, would follow similar patterns (trends) in wild type and in GRdim PMΦ. This would support a mechanism of GR action independent of its binding to DNA, where GR interacts with other transcription factors (or proteins) to regulate gene transcription. Some genes/ESTs while regulated by GCs in cells from wild type mice may not be regulated in PMΦ from GRdim mice. These genes would require an interaction of GR with DNA to be modulated by GCs.
Based on this, 6 additional subgroups can be distinguished according to the molecular mechanisms by which GR mediates repression/induction of LPS target genes/ESTs, as illustrated in Figure 8:
• Group 1-B and Group 2-C, consist of 47 and 4 genes/ESTs, respectively, which are repressed upon GCs in wild type but not in GRdim mice, indicating that GR acts in a DNA-binding dependent manner.
• Group 1-C represents 10 genes/ESTs which were repressed by the GR in cells from wild type and in GRdim mice. These genes thus require DNA-binding independent action of the GR for their regulation.
• Group 1-D and Group 2-B represent 5 and 38 genes/ESTs, respectively, whose expression was further increased by dex+LPS treatment compared to LPS alone. In this case, GR acts in a DNA-binding dependent fashion, since induction in gene expression was observed only in cells from wild type but not GRdim mice.
• Group 1-E consists of only 2 genes. The expression of these genes was increased by GCs
in PMΦ from wild type and GRdim mice indicating that GR acts in a DNA-binding independent fashion.
In total, 182 ESTs have been identified by SSH and oligonucleotide gene chips analysis as being significantly modulated by LPS and by GCs, which did not match any gene name in the public databases. This is only an approximate estimate of the number of novel genes found because a fraction of the mRNAs for known genes still have poor 5' representation and even