Contents lists available atScienceDirect
Journal of Sound and Vibration
j o u r n a l h o m e p a g e : w w w . e l s e v i e r . c o m / l o c a t e / j s v i
Eigenfrequency maximisation by using irregular lattice structures
Simone Andresen
a,b,∗, Annette Bäger
c, Christian Hamm
aaAlfred Wegener Institute, Helmholtz-Center for Polar and Marine Research, Bionic Lightweight Design and Functional Morphology, Bussestraße 27, 27570, Bremerhaven, Germany
bUniversity of Bremen, Bibliothekstraße 1, 28359, Bremen, Germany
cGerman Aerospace Center, Institute of Space Systems, Mechanics and Thermal Systems, Robert-Hooke-Straße 7, 28359, Bremen, Germany
a r t i c l e i n f o
Article history:
Received 6 June 2019 Revised 14 October 2019 Accepted 16 October 2019 Available online 21 October 2019 Handling Editor: Erasmo Carrera
Keywords:
Biologically inspired structures Damping
Evolutionary strategic multi-objective optimisation
Parametric construction Vibration experiment
a b s t r a c t
Lightweight structures are susceptible to vibration due to their reduced mass. However, con- ventionally used techniques to avoid high vibration amplitudes (such as increasing the mass and/or applying damping mechanisms) are contradictory to the original goal of designing a lightweight structure. An increase of eigenfrequencies above external, exciting frequencies helps to prevent resonance phenomena. Here, we use a combined design and optimisation method to generate irregular lattice structures to investigate their potential of reaching much higher eigenfrequencies than those of regular structures, while retaining low weight and high stiffness. We generate parametric constructions of lattice structures with different degrees of structural irregularities, including regular lattices with constant and functionally graded strut cross-sections, and irregular lattices. Evolutionary strategic optimisation is used to maximise the first eigenfrequency. Geometric restrictions associated with selective laser melting are considered, and three optimised lattice structures are manufactured in selective laser melting using aluminium (AlSi10Mg). Their eigenfrequencies are measured in vibration experiments with a shaking table. Our approach allows the efficient generation of more than 500 lattice structures. The results show that by using irregular lattice structures, the first eigenfrequency is increased by 58% compared to a regular lattice structure of the same mass. The numerically obtained eigenfrequencies coincided well with the experimental results. It is argued that the implementation of higher degrees of structural irregularities allows the development of solu- tions with even higher first eigenfrequencies. In conclusion, we show that irregular lattice structures have a high potential to manipulate the eigenfrequencies of lightweight structures.
©2019 The Authors. Published by Elsevier Ltd. This is an open access article under the CC BY license (http://creativecommons.org/licenses/by/4.0/).
1. Introduction
Lightweight structures are susceptible to vibration because reduced masses are more easily excited by external influences (such as vibrations and individual shocks) than those of heavy, massive constructions [16]. In other words, lightweight structures tend to ‘rattle’ more than heavyweight structures. Traditional methods of reducing high vibration amplitudes include increasing the mass and/or structural damping [3]. However, this often contradicts the original design goal of generating lightweight struc-
∗Corresponding author. Alfred Wegener Institute, Helmholtz-Center for Polar and Marine Research, Bionic Lightweight Design and Functional Morphology, Bussestraße 27, 27570, Bremerhaven, Germany.
E-mail address:simone.andresen@awi.de(S. ).
https://doi.org/10.1016/j.jsv.2019.115027
0022-460X/©2019 The Authors. Published by Elsevier Ltd. This is an open access article under the CC BY license (http://creativecommons.org/licenses/by/4.0/).
Most technical lightweight structures, such as typical honeycomb sandwich constructions, lattice structures or steel girders used for planes, buildings, or cranes have mostly regular periodic geometries. However, natural lightweight structures are often highly complex and irregular, even if they follow the same basic construction principles of using ribs, lattices, and honeycombs [13]. In particular, planktonic organisms with biomineralised cell covers (such as diatoms and radiolarians) have developed an extremely high diversity of irregular structures. In contrast to technical production processes (with the exception of 3D- printing, to a certain extent) the natural process of morphogenesis (generation of forms) in diatoms and radiolarians allows the production of almost any form, including irregular lattice structures [12,25,27]. The feeding tools of copepods feeding on diatoms have been shown to vibrate, and an adaption to this specific load case would provide an evolutionary advantage. Aside from this, little is known about the purpose of diatom cell covers as a result of challenges related to acoustic properties. However, it is obvious that the concept to generate, optimise, and apply such highly complex irregular structures allows the substantial manipulation of vibration properties [14].
Cellular structures including foams, honeycombs and regular lattice structures have been a common subject of current research. They can be divided into stochastic (foams) and periodic (honeycomb and lattice) cellular structures. An overview on the properties of foams and lattices was provided by Ashby [4].
Besides their lightweight potential, cellular structures exhibit high energy absorption during compression [15,41], good heat-dissipation (cooling) performance, and highly efficient cross-flow heat exchange [11,35]. Several studies on periodic and stochastic cellular structures have emphasised the enhanced performance of periodic structures compared to stochastic struc- tures of the same relative density, e.g., higher stiffness and strength [10,11,36].
Regarding the impact of structural irregularities on mechanical properties, Silva et al. [30] studied two-dimensional cellular solids, and demonstrated that the elastic properties of honeycombs almost conformed to those of irregular arranged cell walls of the same density. However, later studies by Van der Burg et al. [34], Zhu et al. [42], and Zhu et al. [43] revealed that the Young’s modulus increased significantly with an increase in the irregularity of the cell arrangement.
The potential to use irregular versatile structures for multi-functionality [11] makes them highly useful in a broad field of applications. The growing interest regarding cellular structures coincides with the improving additive manufacturing possibili- ties, which allow the fabrication of complex lattice structures using different materials [33].
While most research has investigated the mechanical properties of complex cellular structures, little is known about their dynamic properties, particular their vibration properties. Several studies have been conducted on sandwich beams. Sandwich structures are likely to have high eigenfrequencies because of their large bending stiffness per mass [11], which has been con- firmed by comparing a solid beam with a sandwich beam of the same mass [17]. Ruzzene [26] studied the vibration and acous- tic behaviour of sandwich beams with honeycomb truss cores. Several studies showed that the eigenfrequencies of sandwich beams are sensitive to the lattice core design [6] and to other geometric parameters, e.g., to an increase in the core thickness of a sandwich beam with a lattice truss core [17,18,39].
Regarding two-dimensional honeycomb structures, Wang and Stronge [38] proposed an integral method to solve regular honeycombs under dynamic loads. Sorokin et al. [31] actively shifted the eigenfrequency of a sandwich plate with a honeycomb core owing to parametric stiffness modulation by changing the orientation of cell elements. Banerjee and Bhaskar [5] showed that macroscopic cellular structures can be abstracted as a homogeneous continuum to calculate low eigenfrequencies, which helps to reduce computing effort in obtaining eigenfrequency values.
A lattice can be defined as a connected network of struts [4]. There have been few studies published regarding the analysis of the dynamic properties of ‘larger-scaled’ lattice structures. Yan et al. [40] conducted compression tests on additive manufac- tured, stainless steel regular lattice structures based on different unit cells. Their results indicated a Young’s modulus decrease with an increase in unit cell size. Ozdemir et al. [24] also conducted compression experiments on additive manufactured regular lattice structures and showed that the structures reduced the peak impact stress by temporally spreading the impact loading.
Maskery et al. [19] found that the cell size of a metal lattice structure has a significant impact on the failure mechanism under compression. Implementing post-manufacture heat-treatment leads to reduced peak stresses at the same amount of compres- sive deformation. Maskery et al. [20] showed that functionally graded regular lattice structures lead to far higher energy absorp- tion during compression than non-graded regular lattice structures of the same mass. Studies on functionally graded foams [8,22] and honeycombs [9,23] also demonstrated improved mechanical properties under compression and an enhanced capa- bility of sound absorption. Maskery et al. [21] analysed the mechanical properties of different triply periodic lattice structures of the same mass based on gyroid, diamond, and primitive unit cells. The additive manufactured structures made out of poly- mer were tested under tension and compression and were also simulated. They showed that the lattices deformed differently depending on their unit cell geometry.
Very few studies have investigated the vibration characteristics of irregular lattice structures. Syam et al. [32] studied dif- ferent regular lattice structures in vibration isolation applications. They conducted simulations and experiments of additively manufactured lattices made out of Nylon_12 for validation and examined large differences in eigenfrequencies of regular lattice structures based on different unit cells. They showed that the first lattice eigenfrequency was proportional to both
√k m and to
√I
m. However, the masses of their models differed up to 20% and may have had a significant impact on the eigenfrequency.
Besides the graded lattice structures analysed by Maskery et al. [20], all the above-mentioned studies used regular (periodic) lattice structures. Moreover, little effort has been made to analyse the vibration properties of lattice structures or to maximise
their eigenfrequencies. The first study on biologically inspired lattice structures indicated the high potential of these complex structures to maximise eigenfrequencies [1]. In addition, the application of these irregular lattice structures to magnet-girder structures of particle accelerators has been discussed [2].
Altogether, as an increase in eigenfrequency can substantially reduce the dynamic response of a structure [29], an eigenfre- quency maximisation is of great interest for many technical applications.
Here, we show a design and optimisation method for regular and irregular lattice structures and investigate the potential of irregular lattice structures to manipulate eigenfrequencies as compared to regular structures. The investigation was divided into three steps: lattice design and optimisation, vibration measurements, and further lattice optimisations (see A).
2. Material and method
2.1. Lattice design and optimisation
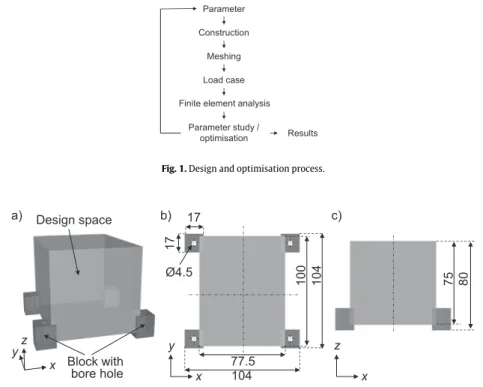
To evaluate the impact of structural irregularities on vibration characteristics, three lattice structures were designed and simulated: (a) regular lattice with constant cross-sections, (b) regular lattice with irregular cross-sections, and (c) irregular lattice with irregular cross-sections. The software Rhinoceros (version 6 SR10, Robert McNeel & Associates) with its plug-In Grasshopper®(version 1.0.0007, Robert McNeel & Associates) allowed a parametric and algorithm-based development and variation of the lattice structures. The additional Grasshopper®-based module ELISE (version 0.1.3,www.elise.de) offered algo- rithms to create biologically inspired lattice structures, and permitted the construction of the entire design and simulation process (Fig. 1). The solver OptiStruct (Altair®HyperWorks®Version 2017) was used to obtain the numerical results of the finite element analysis models.
Each lattice was constructed inside a defined design space (Fig. 2), which was connected to four blocks with bore holes to screw the lattice onto an adapter plate during the subsequent vibration measurements.
While the four blocks were meshed with solid elements (CTETRA), the lattice struts were incorporated as beams (CBEAM) connected to the blocks via RBE3 elements. The blocks’ lower surfaces were mounted. The aluminum alloy AlSi10Mg (Young’s modulus: 75,000 MPa, density: 2.7·10−9t mm−3, Poisson’s ratio: 0.33) was defined as a lattice material. A modal load case was specified to obtain the structure’s eigenfrequencies. The three types of lattices were designed as follows:
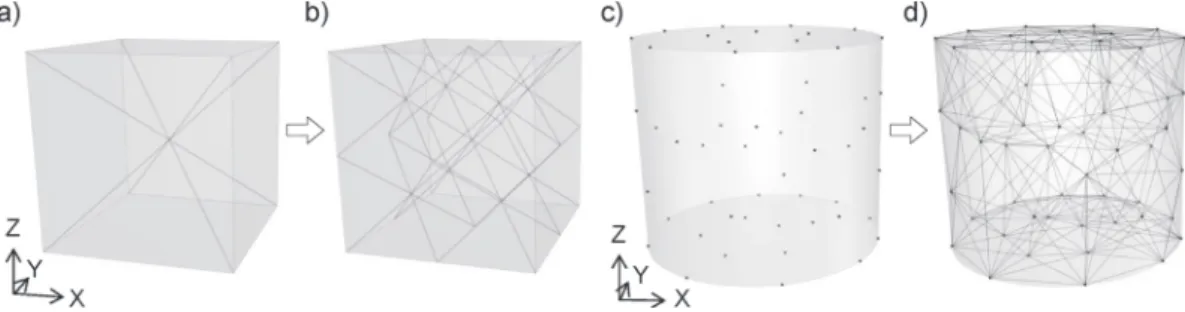
a)Regular lattice with constant cross-sections (Lattice 1):This lattice was based on a simple unit cell composed of four diagonal struts (Fig. 3a). A parameter study varying the number of unit cell repetitions in each axis from 2 to 8 for axes x and y and from 1.5 to 7.5 for axis z was conducted. The circular strut cross-section with a diameter of 2.08 mm remained constant.
Regarding the evaluation, only lattice structures with angles between the strut and the horizontal axis of more than 35◦were considered, as demanded by the subsequent additive manufacturing process. The lattice structure with the lowest mass at a
Fig. 1.Design and optimisation process.
Fig. 2.a) 3D view, b) top view, and c) side view of the lattice design space.
Fig. 3.Unit cell of the regular lattices exemplarily shown for a cube (a). The unit cell was repeated twice in all three axes (b). Based on a specified point distribution inside a defined cylindric design space (c), an irregular lattice was built by connecting each point to its neighbouring points (d).
Fig. 4.Schematic illustration of data interpolation based on an area governed by an attractor value, a global area ruled by a global value, and a transition area in between defined by a decay factor.
first eigenfrequency of 1,500 Hz (value given by the later-used test facility operating sphere) was chosen as test body L1.
b) Regular lattice with irregular cross sections (Lattice 2):This lattice configuration corresponded to the chosen L1 structure. To provide varying diameters of the circular cross-sections along one strut, each strut was divided into three to five sections, depending on the strut length. The parametric strut diameters were interpolated as shown inFig. 4, considering the lower design space-surface as the attractor. The parameter definition ranges and starting values are summarised inTable 1.
Table 1
Parameter definition ranges and starting values for lattice cross-section interpolation.
Global diameter Attractor diameter Attractor area height Attractor decay factor
Range 2.00–3.00 mm 1.50–2.30 mm 30–50 mm 1.0–2.0
Starting value 2.50 mm 1.90 mm 40 mm 1.1
Fig. 5.Optimisation and evaluation process.
Table 2
Parameter definition ranges and starting values for Lattice 3 optimisation.
Point distribution density interpolation
Global distance Attractor distance Attractor area radius Attractor decay factor
Range 10.0–40.0 mm 5.0–40.0 mm 2.0–4.0 mm 5–20
Starting value 25.0 mm 22.5 mm 3.0 mm 13
Connecting neighbouring points to build the lattice
Number of neighbours Min. angle between strut and horizontal Min. angle between two struts
Range 5–30 35◦-60◦ 20◦-60◦
Starting value 18 48◦ 40◦
Strut cross-section diameter interpolation
Global diameter Attractor diameter Attractor area height Attractor decay factor
Range 1.5–5.0 mm 1.5–5.0 mm 10–40 mm 2.0–4.0
Starting value 3.3 mm 3.3 mm 25 mm 3.0
The cross-section optimisation was conducted using an evolutionary algorithm implemented in the Grasshopper®optimiser
‘Octopus’ allowing the definition of various objectives. Two objective functionsobj1andobj2were defined as followed:
obj1= −f1 (1)
obj2=|m−mL1| (2)
wheref1is the first eigenfrequency,mthe structural mass andmL1the structural mass of the chosen L1 structure. Both objective functions formed the fitness in equal parts.
The optimisation and evaluation process is shown inFig. 5. The gene pool contained 100 structures, and the population size Pwas 50. Evaluating the last generation lattice structures, the lattice structure with the highest first eigenfrequency at a maximal mass difference of 0.5% compared tomL1was selected as the test body.
c) Irregular lattice with irregular cross-sections (Lattice 3): The irregular lattice design was based on a point distribution inside the design space. The point distribution density was interpolated as previously illustrated inFig. 4with the design space centre point as the attractor. By connecting each point to a varying number of neighbouring points, the lattice struts were constructed (Fig. 3d). In the case of two struts forming an angle smaller than 20◦, the larger strut was discarded to avoid disorder. The irregular cross-section diameters were interpolated analogous to Lattice 2. All parameter definition ranges and starting values (middle value of each range) are listed inTable 2.
The optimisation process was conducted in the same way as that of Lattice 2. However, the gene pool contained 200 struc- tures, and the population size was augmented to 100 because of the higher number of parameters. To conform with Lattice 2, all lattice structures of the last generation were evaluated. The chosen test body corresponded to the lattice with the highest first eigenfrequency at a maximal mass difference of 0.5% compared tomL1.
The three lattice test bodies chosen were transferred into 3D models and meshed with CTETRA elements (element size 0.5 mm). Modal analyses with boundary conditions in analogy to the beam models led to structural eigenfrequency values of the solid models. Both the beam and solid models were also calculated considering three accelerometers each as a point mass of 0.6 g, which were implemented in the subsequent vibration measurements.
To compare the first eigenfrequencies obtained by the beam modelf1,beamand the solid modelf1,solid, the differences𝛿were calculated as follows:
𝛿= f1,solid−f1,beam
f1,solid ·100[%] (3)
The three lattice test bodies were manufactured out of AlSi10Mg using the selective laser melting additive manufacturing system EOS M 290.
2.2. Lattice vibration measurements
The vibration measurements were performed at the German Aerospace Centre (DLR) vibration laboratory in Bremen, Ger- many. During measurements, the cleanroom (class ISO 8) had a constant temperature of 20.5± 0.5◦C at ambient pressure and a constant humidity of 57.5 ±1.5%rF. The test facility TIRAvib 51010/LS (TIRA GmbH) was used.
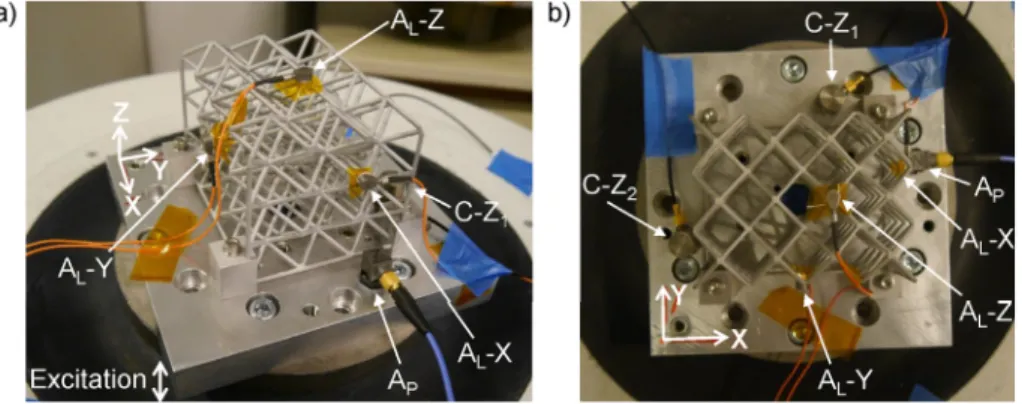
The test bodies were screwed to an aluminum adapter plate as shown inFig. 6. Two uniaxial accelerometers (Delta ShearⓇ, Type 4371, Brüel & Kjær) controlling the vertical movement of the shaker, and one triaxial accelerometer (Triax-ICPⓇ, Type 356A33, PCB Piezotronics, Inc.) were fixed with resin to the adapter plate. Each test body was equipped with three uniaxial accelerometers (Delta ShearⓇ, Type 4517-C, Brüel & Kjær) at three different positions connected to a charge amplifier (Type 2692 Nexus, Brüel & Kjær).
Fig. 6.a) 3D and b) top view of the vibration test setup for L1 lattice structure including uniaxial control accelerometers C-Z1and C-Z2, a triaxial accelerometer on the adapter plate AP, and three uniaxial accelerometers on the lattice structure AL-X, AL-Y, and AL-Z.
Table 3
Sinusoidal (a) and random (b) vibration test levels.
Test body Frequency range Level Overall level
a) Lattice 1 (L1) 600–2,500 Hz 1.0 g –
Lattice 2 (L2) 1400–3,000 Hz 1.0 g –
Lattice 3 (L3) 2000–4,000 Hz 1.0 g –
b) Lattice 1 (L1) 500–2,500 Hz 5.0·10−4g2Hz−1 1.000gRMS
Lattice 2 (L2) 500–2,500 Hz 5.0·10−4g2Hz−1 1.000gRMS
Lattice 3 (L3) 500–4,000 Hz 3.0·10−4g2Hz−1 1.025gRMS
Vertical acceleration considering sinusoidal and random vibration was applied to each of the three test bodies. Random vibration was employed for 4min per test body with a frequency resolution of 0.5 Hz. Sine-up and sine-down sweeps were then conducted with a sweep rate of 1 Hz s−1. The vibration test levels are summarised inTable 3.
For each test body, the first three eigenfrequencies and the vibration amplitude were calculated. Differences between the solid model and the measurement results were obtained by equation(3). The half-power bandwidth method demonstrated inFig. 7was used to estimate the damping ratio for the first eigenfrequency in excitation direction z of each test body. This method assumes a symmetrical response curve, light damping, and no effect of neighbouring modes on the analysed mode [7].
The damping ratio𝜁was defined as 𝜁=12fmaxf−fmin
0
(4)
heref0denotes the resonance frequency andfminandfmaxthe frequencies at the half-power amplitudeY√max 2 .
The calculated damping ratios for the first eigenfrequency were applied to the frequency-response analysis of each structure to assess the consistency between simulations and measurements.
Fig. 7.Half-power bandwidth method.
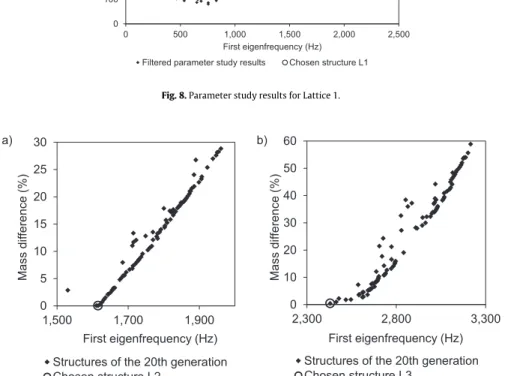
Fig. 8.Parameter study results for Lattice 1.
Fig. 9.Optimisation results for a) Lattice 2 and b) Lattice 3.
2.3. Further lattice optimisation
The initial optimisation round comprised first eigenfrequency maximisations of different lattice structures, including the structure fabrication and the execution of experiments. Additional optimisations were then conducted to investigate the pos- sible development of further-improved lattice structures. Based on the optimised lattice structures for Lattices 2 and 3, the parameter definition ranges were confined so that the parameter values of the printed structures remained inside the newly defined ranges. For both Lattices 2 and 3, optimisations configured as previously were conducted, and the results were evalu- ated likewise, leading to the best structures L2∗and L3∗.
To analyse whether the acceptance of struts oriented less than 35◦to the horizontal leads to structures with higher eigen- frequencies, another optimisation was conducted. Here, the lattice generation and the optimisation approach were based on those of Lattice 3, but the minimum angle between the struts and the horizontal plane was set to 0◦. After obtaining the best lattice structure based on the specified evaluation method (Lattice L4), the parameter definition ranges were reduced around the parameter values of the obtained best lattice structure as before. Furthermore, the maximum number of generations was changed from 20 to 40 to provide a longer optimisation process. The evaluation method led to the best lattice structure L4∗. 3. Results
3.1. Lattice design and optimisation
Fig. 8shows the parameter study results filtered by a minimum angle between the strut and the horizontal of 35◦. The lattice structure revealing the lowest mass of 127.7 g at a first eigenfrequency of 1,500 Hz was chosen. It was built by three, four and three and a half unit cell repetitions in the x, y and z axes, respectively.
Fig. 9a shows the structures forming part of the last generation developed during the optimisation process. The structure with the lowest mass difference compared to Lattice 1 of 0.03 g and a first eigenfrequency of 1,615 Hz was selected as the test body. The global cross-section diameter was 2.41 mm, the diameter at the attractor was 1.79 mm, the attractor space height was 40 mm and the attractor decay factor was 1.1. Thus, the application of the strut diameter grading from larger diameters at the lower part of the structure to smaller diameters at the top led to an eigenfrequency increase of 7.7% compared to that of lattice L1.
Global distance Attractor distance Attractor area radius Attractor decay factor
Value 36.5 mm 16.0 mm 2.5 mm 12
Connecting neighbouring points to build the lattice
Number of neighbours Min. angle between strut and horizontal Min. angle between two struts
Value 18 59◦ 33◦
Strut cross-section diameter interpolation
Global diameter Attractor diameter Attractor area height Attractor decay factor
Value 2.5 mm 2.1 mm 22 mm 2.5
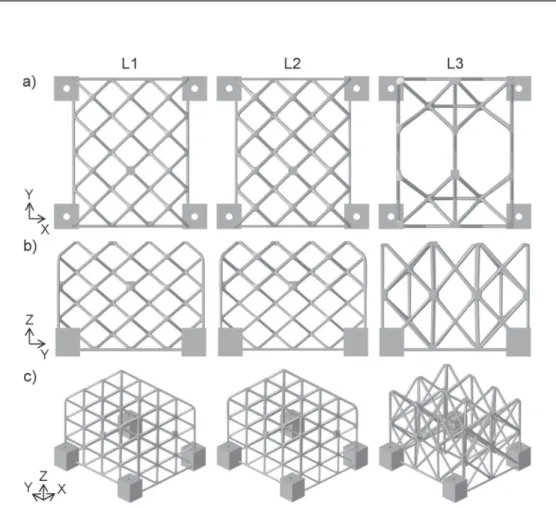
Fig. 10.a) Top view, b) side view, and c) 3D view of the lattice structures L1, L2 and L3.
Fig. 9b shows the last generation structures for Lattice 3. The structure with the lowest mass difference compared to structure L1 of 0.55 g and a first eigenfrequency of 2,430 Hz was chosen as the test body.Table 4summarises the defined parameter values for reaching the chosen lattice design. The obtained lattice structure’s eigenfrequency was increased by 62% compared to the L1 structure. The three chosen lattice structures L1, L2 and L3 are illustrated inFig. 10. L2 differs from L1 by showing graded cross-section diameters from smaller values at the bottom to higher values at the top. The irregular lattice structure L3 has two symmetry axes parallel to the XZ and the YZ plane.
Table 5summarises the first eigenfrequencies for the three test bodies obtained by the beam and the solid model as well as by neglecting or including the accelerometers. Inclusion of the accelerometers resulted in slightly lower frequency values for both models. The eigenfrequencies obtained by the beam models including the attached accelerometers were about 7%–22%
lower than that of the solid models. The masses of L1, L2, and L3 showed only small differences for both models. However, the conversion of the beam models into solid models led to a slight decrease in mass up to 7%.
The structural masses of the manufactured lattice structures L1, L2 and L3 were 124.9 g, 124.6 g and 123.4 g, respectively, and differed less than 5% from the solid model masses (Table 5).
Table 5
First eigenfrequencies in Hz of the three test bodies L1, L2, and L3 obtained by the beam model and solid model, both with accelerometers (acc.) neglected (negl.) and included (incl.), as well as the model masses in g and the eigenfrequency difference of the beam and solid models with accelerometers included.
Beam model Solid model Difference
acc. negl. acc. incl. mass acc. negl. acc. incl. mass acc. incl.
L1 1,500 Hz 1,471 Hz 127.7 g 1,925 Hz 1,895 Hz 119.3 g 22.4%
L2 1,615 Hz 1,586 Hz 127.7 g 2,073 Hz 2,028 Hz 119.1 g 21.8%
L3 2,430 Hz 2,404 Hz 127.2 g 2,619 Hz 2,581 Hz 121.4 g 6.9%
Table 6
Measured first eigenfrequencies based on random and sinusoidal-up and -down excitation and calculated damping ratios for the first eigenfrequency based on sinusoidal excitation.
First eigenfrequency (Hz) Damping ratio (−)
Random Sine up Sine down Sine up Sine down Average
L1 X 1812 1809 1807
Y 1811 1814 1815
Z 1810 1809 1807 0.0044 0.0043 0.0044
L2 X 1995 2009 2010
Y 1995 2007 2008
Z 1995 2003 2005 0.0104 0.0096 0.0100
L3 X 2565 2568 2570
Y 2565 2568 2570
Z 3877 3877 3879 0.0026 0.0026 0.0026
3.2. Lattice vibration measurements
The obtained first eigenfrequencies of the three lattice structures by applying random vibration and by sine-up and sine- down sweep are shown inTable 6. The random and sine sweep eigenfrequency values coincided very well. For L1 and L2, the three accelerometers measured the same eigenfrequency values. However, the first eigenfrequency in the z direction of L3 was significantly higher than that in the x- and y-direction.
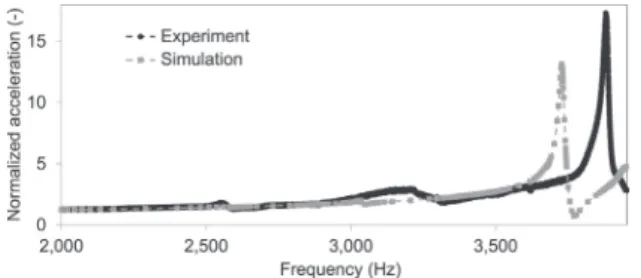
Table 6also lists the calculated damping ratios for the three structures using the half-power bandwidth method. Lattice L3 showed the lowest damping ratio of 0.0026 for the first eigenfrequency in excitation direction z followed by L1 with 0.0044. The highest damping ratio of 0.01 was calculated for L2. Applying the averaged damping ratios to the frequency-response analysis showed response curves similar to the measured values as shown inFig. 11for L3. The peak position values of 3,725 Hz for the simulation and 3,877 Hz for the experiment differed by 3.9%, whereas the peak height of 17.3 for the experiment was 23.7%
higher than the simulation peak height of 13.2.
Comparing the numerically obtained eigenfrequencies of the solid model with attached accelerometers with the measured eigenfrequencies showed a difference of less than 5% (Table 7). For all structures, the numerically obtained values were slightly higher.
3.3. Further lattice optimisation
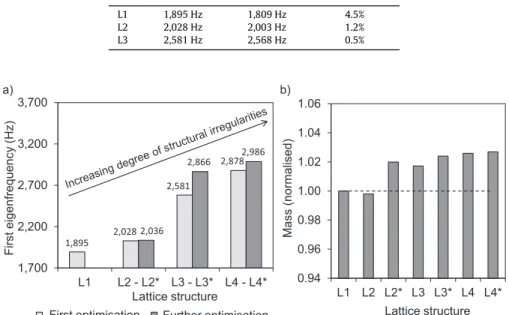
The measured data coincided well with the numerical data of the solid models, therefore, the solid model results were also considered in the further lattice optimisations.Fig. 12a shows the first eigenfrequency of the four lattice structures and the further-optimised lattice structures L2∗, L3∗, and L4∗. Although there was only a slight difference in the eigenfrequency values of L2 and L2∗, further optimisations led to significantly higher first eigenfrequencies for L3∗and L4∗compared to the lattice structures of the first optimisation. Altogether, the first eigenfrequency was increased by 58% comparing L4∗to L1. All lattice
Fig. 11.Frequency response curves for L3 obtained by experiment and simulation using a solid model including accelerometers with a damping ratio of 0.0026.
sinusoidal-up excitation.
Simulation Measurement Difference
L1 1,895 Hz 1,809 Hz 4.5%
L2 2,028 Hz 2,003 Hz 1.2%
L3 2,581 Hz 2,568 Hz 0.5%
Fig. 12.a) First eigenfrequencies obtained numerically using solid models including accelerometers and b) mass values obtained numerically using solid models normalised with a L1 mass of 119.3 g.
masses differed less than 3% from the L1 solid mass (Fig. 12b).
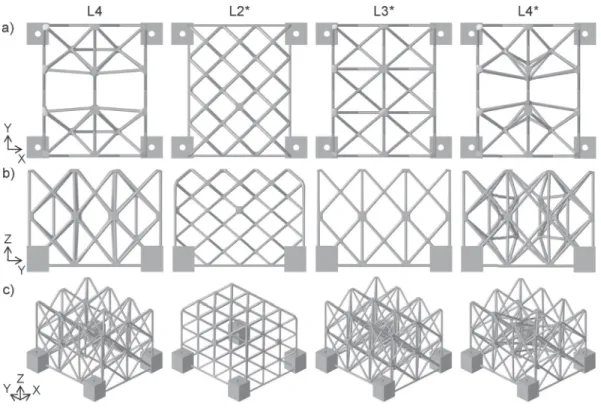
The chosen lattice structures of each model are shown inFig. 13. While L2∗was very similar to L2, the struts and their cross-sections of L3∗differ from L3. The lattice structure L4∗shows a higher complexity than L4.
4. Discussion
4.1. Lattice design and optimisation
The lattice design method used allowed the development of lattice structures with increasing degrees of structural irregular- ity involving an enhancement of the structural eigenfrequencies. It was possible to increase the first eigenfrequency by 7% from L1 to L2 and by 36% from L1 to L3. Using beam models facilitated the optimisation procedure because far less computational time was required in comparison to that of the solid models.
The regular lattice with constant cross-sections L1 was based on a simple unit cell with diagonal struts. Considering the vibration analyses of different regular lattice structures conducted by Syam et al. [32], it is likely that the inclusion of horizontal struts into the unit cell forming the structure L1 leads to higher first eigenfrequency. However, as our aim was to meet the fabrication requirements of the angles between the struts and the horizontal of more than 35◦, the horizontal struts were neglected.
The optimisation results for Lattice 2 and 3 showed an increase in the first eigenfrequency with an increase in the mass difference compared to the structural mass of L1. Regarding a single degree of freedom (SDOF) system, the eigenfrequency f0,SDOFdepends on the stiffnesskand the massmand is defined according to Schmitz and Smith [28] as
f0,SDOF= 1 2𝜋·
√k
m (5)
Note that a larger lattice mass can lead to a lower eigenfrequency. However, the increasing mass owing to changes in the lattice structures results in a higher stiffness and thus to enhanced eigenfrequencies.
The defined optimisation objectives led to structures with high eigenfrequencies and low mass differences. However, most of the last-generation structures showed masses exceeding the aimed 0.5% mass difference compared to the mass of L1, and were therefore neglected. The first eigenfrequencies of the chosen L2 and L3 structures were among the lowest first eigenfrequencies of all structures forming the last generation while complying with the weight limit. It is likely that improving the definition of
Fig. 13.a) Top view, b) side view, and c) 3D view of the lattice structures L4, L2∗, L3∗and L4∗.
the optimisation objectives will result in more structures with acceptable (e.g. lower) mass differences, e.g., by implementing the mass difference constraint directly into the evolutionary algorithm.
The cross-sections of the structure L2 were graded from a thinner cross-section diameter at the bottom to a higher diameter at the top. The results showed that the applied small-scale grading led already to an eigenfrequency increase of almost 8%.
Maskery et al. [20] also showed that the implementation of grading to regular lattice structures leads to improved properties at similar masses. However, they analysed the energy absorption capacity under compression.
The conversion of the beam models into solid models led to a slight decrease in mass, because the strut intersection points were combined to form one solid connection. This connection was stiffer than the connection simulated in the beam model.
Therefore, the overall first eigenfrequency was also higher. As L1 and L2 were quite similar, the differences between the beam and solid model results coincided. However, for L3, the differences between the beam and solid model were far less because of the lower number of strut intersection points compared to that of L1 and L2. Accordingly, there was a smaller increase in stiffness in the solid model compared to the beam model for structure L3 and consequently a smaller increase in the first eigenfrequency.
4.2. Lattice vibration measurements
The measurements were successful, because the obtained first eigenfrequency of the random and the sine-up and -down excitation coincided very well. Moreover, the numerical results of the solid models corresponded to the measurement results by more than 95%. The slightly higher simulation results might be because of the high stiffness of the fixed support in comparison to the fixation of the lattice structures with four screws to the adapter plate during measurements. Thus, the higher stiffness led to slightly higher eigenfrequencies in the simulation.
The masses of the additive manufactured structures hardly differed from those of the solid model masses indicating a suc- cessful manufacturing process. However, the manufactured lattice structures were not analysed in detail to check for the exis- tence of cracks or micro-structural imperfections.
Previous studies comparing numerical results with measurements on additive manufactured lattice structures revealed higher differences between simulation and measurement results of 4%–14% for eigenfrequencies [32] and 4%–18% for elastic moduli [21]. In both studies, these differences were justified with imperfections in the material properties and, in the second case, with a high surface roughness of the additive manufactured structures which can lead to a reduction in stiffness. However, the differences between measurements and simulations were quite low in the present study. Consequently, the conducted sim- ulations can be declared as validated, and the numerical results of the further lattice optimisations can be assumed to represent reality.
The calculated damping ratios were the highest for L2, followed by L1 and L3. For all three lattice structures, the damping ratios of the sine-up and -down excitation coincided very well, although the values were rather low. Considering the analysis
of a single degree of freedom system and might thus overestimate the damping ratios. However, the numerically obtained frequency response curve showed good conformity with the measurements, especially regarding the peak positions. The exist- ing differences in the amplitude values might indicate an overestimation of the damping ratio in the simulation, because the consideration of the calculated damping ratios in the simulation led to lower amplitudes than in the experiments.
Separate systematic investigations to analyse the damping properties of lattice structures with different degrees of structural irregularities would be highly promising for potential applications, because eigenfrequencies apparently do not correlate with damping properties.
It was not possible to verify the calculated eigenmodes of the lattice structures experimentally, because the three uniaxial accelerometers were placed at different locations. In continuative studies, the lattice structures should be equipped with more triaxial accelerometers to measure not only the eigenfrequency, but also the mode shape. This also allows a more precise char- acterisation of the damping ratios of each lattice structure. In this study, however, the intention of the vibration measurements was to obtain the eigenfrequencies to validate the simulation results.
4.3. Further lattice optimisation
The evolutionary strategy was used to generate optimised lattice structures, because it allowed the generation of multiple optimised structures that represent a compromise of various defined objectives. Moreover, the evolutionary strategic optimi- sation can be applied to optimisation problems including many parameters and large parameter definition ranges, whereas the conduction of a parameter study involving the analysis of all parameter combinations would not have been possible. How- ever, although elitism of 50% was specified to avoid local optimisation, the optimisation results of this approach might still not include the best possible lattice structures. Therefore, further lattice optimisations were conducted based on the results of the first optimisations. The aim was to develop lattice structures with even higher first eigenfrequencies. The results showed only a slight eigenfrequency improvement of 0.4% for Lattice 2. This indicates that the first optimisation had already generated an almost optimal lattice structure under the defined constraints. Regarding Lattice 3 and 4, however, further optimisations led to significantly improved lattice structures. This indicates that conducting lattice optimisation in two steps is a valid approach to exploit the full potential of the respective lattice design concepts.
It is important to point out that the structure L4 clearly showed a higher first eigenfrequency than that of the structure L3.
Thus, the implementation of nearly horizontally oriented struts into an irregular lattice seemed to enhance the eigenfrequency.
Similar results have been published by Syam et al. [32]. Although they solely studied regular lattice structures based on different unit cells, some of the unit cells contained horizontal struts. The lattice structures with the lowest eigenfrequencies were lack- ing horizontal struts. However, the additive manufacturing process of lattice structures including horizontal struts involves the use of support structures which must be subsequently removed. Here, the first eigenfrequency of the further-optimised struc- ture L3∗was already quite close to the first eigenfrequency of the structure L4∗, although the latter contained nearly horizontal struts. This shows the possibility of designing lattice structures with high first eigenfrequencies that meet the additive manufac- turing requirements to reduce the amount of support structures. However, it is likely that the implementation of higher degrees of irregularities and more delicate structures would lead to even higher first eigenfrequencies. This should be demonstrated in further studies focusing on eigenfrequency maximisation without manufacturing restrictions.
5. Conclusion
We have shown that the generation and modification of complex irregular lattice structures can be used to manipulate the eigenfrequencies of technical lightweight structures in an evolutionary optimisation process. Thereby, the potential to increase eigenfrequencies is a function of the permitted degree of structural irregularities within the respective design concepts. While this approach has the highest potential if the degree of complexity and irregularity are not limited, substantial improvements can also be achieved under the typical geometric restrictions of 3D-printing or casting processes. We also found first indications that a similar optimisation approach can be used to increase the damping properties of lightweight structures. We conclude that complex irregular lattice structures have a high potential in the development of technical lightweight solutions with sig- nificantly improved vibration properties.
Declaration of competing interest
None.
Acknowledgments
This study was financially supported by the Alfred Wegener Institute, Helmholtz Centre for Polar and Marine Research (AWI) and the German Electron Synchrotron (DESY), a research centre of the Helmholtz Association. The authors acknowledge the comments and suggestions of reviewers and the assistance of Selina Linnemann.
Appendix A. Overview of the study
The conducted study contained a lattice design and optimisation, vibration measurements, and further lattice optimisations (Fig. A1).
Fig. A1Overview of the study containing lattice design and optimisation (solid line), vibration measurement (dotted line), and further lattice optimisations (dashed line).
Appendix B. Supplementary data
Supplementary data to this article can be found online athttps://doi.org/10.1016/j.jsv.2019.115027.
References
[1] S. Andresen, Optimizing the PETRA IV girder by using bio-inspired structures, in: V.R.W. Schaa, K. Tavakoli, M. Tilmont (Eds.), Proceedings of the 10th Mechanical Engineering Design of Synchrotron Radiation Equipment and Instrumentation (MEDSI’18) Conference, JACoW Publishing, Geneva, Switzerland, 2018a, pp. 297–301,https://doi.org/10.18429/JACoW-MEDSI2018-THOAMA01.
[2] S. Andresen, Untersuchung von Eigenschwingung und Leichtbaupotenzial Unterschiedlicher Gitterstrukturen am Beispiel von Magnetuntergestellen von Teilchenbeschleunigern [Analysis of Natural Vibrations and Lightweight Potential of Different Lattice Structures using the Example of Magnet Underframes of Particle Accelerators], vol.12, NAFEMS Magazin, 2018b.
[3] D. Anthony, S. Elliott, A. Keane, Robustness of optimal design solutions to reduce vibration transmission in a lightweight 2-d structure, part i: geometric design, J. Sound Vib. 229 (2000) 505–528,https://doi.org/10.1006/jsvi.1999.2493.
[4] M. Ashby, The properties of foams and lattices, Philos. Trans. R. Soc. A Math. Phys. Eng. Sci. 364 (2006) 15–30,https://doi.org/10.1098/rsta.2005.1678.
[5] S. Banerjee, A. Bhaskar, Free vibration of cellular structures using continuum modes, J. Sound Vib. 287 (2005) 77–100,https://doi.org/10.1016/j.jsv.2004.
10.051.
[6] S. Banerjee, A. Bhaskar, The applicability of the effective medium theory to the dynamics of cellular beams, Int. J. Mech. Sci. 51 (2009) 598–608,https://doi.
org/10.1016/j.ijmecsci.2009.06.001.
[7] C. Beards, Structural Vibration: Analysis and Damping, John Wiley & Sons Inc., New York, Toronto, 1996.
[8] A.H. Brothers, D.C. Dunand, Mechanical properties of a density-graded replicated aluminum foam, Mater. Sci. Eng. A 489 (2008) 439–443,https://doi.org/
10.1016/j.msea.2007.11.076.
[9] L. Chen, J. Zhang, B. Du, H. Zhou, H. Liu, Y. Guo, W. Li, D. Fang, Dynamic crushing behavior and energy absorption of graded lattice cylindrical structure under axial impact load, Thin-Walled Struct. 127 (2018) 333–343,https://doi.org/10.1016/j.tws.2017.10.048.
[10] V.S. Deshpande, N.A. Fleck, M.F. Ashby, Effective properties of the octet-truss lattice material, J. Mech. Phys. Solids 49 (2001) 1747–1769,https://doi.org/
10.1016/S0022-5096(01)00010-2.
[11] A.G. Evans, J.W. Hutchinson, N.A. Fleck, M.F. Ashby, H.N.G. Wadley, The topological design of multifunctional cellular metals, Prog. Mater. Sci. 46 (2001) 309–327,https://doi.org/10.1016/S0079-6425(00)00016-5.
[12] E. Haeckel, Die Radiolarien, Georg Reimer, Berlin, Germany, 1862.
[13] C. Hamm, V. Smetacek, Armor: why, when, and how, in: Evolution of Primary Producers in the Sea, Elsevier, 2007, pp. 311–332,https://doi.org/10.1016/
B978-012370518-1/50015-1.
[14] A. Keane, A. Bright, Passive vibration control via unusual geometries: experiments on model aerospace structures, J. Sound Vib. 190 (1996) 713–719, https://doi.org/10.1006/jsvi.1996.0086.
[15] Z. Li, J. Zhang, J. Fan, Z. Wang, L. Zhao, On crushing response of the three-dimensional closed-cell foam based on voronoi model, Mech. Mater. 68 (2014) 85–94,https://doi.org/10.1016/j.mechmat.2013.08.009.
[16] F. Ljunggren, A. gren, Development of a new damper to reduce resonant vibrations in lightweight steel joist floors, Appl. Acoust. 63 (2002) 1267–1280, https://doi.org/10.1016/S0003-682X(02)00025-7.
[17] J. Lou, L. Ma, L.Z. Wu, Free vibration analysis of simply supported sandwich beams with lattice truss core, Mater. Sci. Eng., B 177 (2012) 1712–1716,https://
doi.org/10.1016/j.mseb.2012.02.003.
[18] J. Lou, B. Wang, L. Ma, L. Wu, Free vibration analysis of lattice sandwich beams under several typical boundary conditions, Acta Mech. Solida Sin. 26 (2013) 458–467,https://doi.org/10.1016/S0894-9166(13)60041-5.
Plast. 53 (2017b) 151–165,https://doi.org/10.1177/0021955X16639035.
[21] I. Maskery, L. Sturm, A. Aremu, A. Panesar, C. Williams, C. Tuck, R.D. Wildman, I. Ashcroft, R.J. Hague, Insights into the mechanical properties of several triply periodic minimal surface lattice structures made by polymer additive manufacturing, Polymer 152 (2018) 62–71,https://doi.org/10.1016/j.polymer.
2017.11.049.
[22] S.G. Mosanenzadeh, H.E. Naguib, C.B. Park, N. Atalla, Design and development of novel bio-based functionally graded foams for enhanced acoustic capabil- ities, J. Mater. Sci. 50 (2015) 1248–1256,https://doi.org/10.1007/s10853-014-8681-6.
[23] D. Mousanezhad, R. Ghosh, A. Ajdari, A. Hamouda, H. Nayeb-Hashemi, A. Vaziri, Impact resistance and energy absorption of regular and functionally graded hexagonal honeycombs with cell wall material strain hardening, Int. J. Mech. Sci. 89 (2014) 413–422,https://doi.org/10.1016/j.ijmecsci.2014.10.012.
[24] Z. Ozdemir, E. Hernandez-Nava, A. Tyas, J.A. Warren, S.D. Fay, R. Goodall, I. Todd, H. Askes, Energy absorption in lattice structures in dynamics: experiments, Int. J. Impact Eng. 89 (2016) 49–61,https://doi.org/10.1016/j.ijimpeng.2015.10.007.
[25] F.E. Round, R.M. Crawford, D.G. Mann, Diatoms: Biology and Morphology of the Genera, Cambridge University Press, Cambridge, United Kingdom, 1990.
[26] M. Ruzzene, Vibration and sound radiation of sandwich beams with honeycomb truss core, J. Sound Vib. 277 (2004) 741–763,https://doi.org/10.1016/j.jsv.
2003.09.026.
[27] A.M.M. Schmid, R.K. Eberwein, M. Hesse, Pattern morphogenesis in cell walls of diatoms and pollen grains: a comparison, Protoplasma 193 (1996) 144–173, https://doi.org/10.1007/BF01276642.
[28] T.L. Schmitz, K.S. Smith, Mechanical Vibrations: Modeling and Measurement, Springer Science & Business Media, New York, Dordrecht, Heidelberg, London, 2012https://doi.org/10.1007/978-1-4614-0460-6.
[29] M. Shimoda, T. Nagano, T. Morimoto, Y. Liu, J.X. Shi, Non-parametric free-form optimal design of frame structures in natural frequency problem, Int. J.
Mech. Sci. 117 (2016) 334–345,https://doi.org/10.1016/j.ijmecsci.2016.08.024.
[30] M.J. Silva, W.C. Hayes, L.J. Gibson, The effects of non-periodic microstructure on the elastic properties of two-dimensional cellular solids, Int. J. Mech. Sci.
37 (1995) 1161–1177,https://doi.org/10.1016/0020-7403(94)00018-F.
[31] S.V. Sorokin, S.V. Grishina, O.A. Ershova, Analysis and control of vibrations of honeycomb plates by parametric stiffness modulations, Smart Mater. Struct.
10 (2001) 1031–1045,https://doi.org/10.1088/0964-1726/10/5/320.
[32] W. Syam, W. Jianwei, B. Zhao, I. Maskery, W. Elmadih, R. Leach, Design and analysis of strut-based lattice structures for vibration isolation, Precis. Eng. 52 (2018) 494–506,https://doi.org/10.1016/j.precisioneng.2017.09.010.
[33] M.K. Thompson, G. Moroni, T. Vaneker, G. Fadel, R.I. Campbell, I. Gibson, A. Bernard, J. Schulz, P. Graf, B. Ahuja, F. Martina, Design for additive manufacturing:
trends, opportunities, considerations, and constraints, CIRP Ann. 65 (2016) 737–760,https://doi.org/10.1016/j.cirp.2016.05.004.
[34] M.W.D. Van der Burg, V. Shulmeister, E. Van der Geissen, R. Marissen, On the linear elastic properties of regular and random open-cell foam models, J. Cell.
Plast. 33 (1997) 31–54,https://doi.org/10.1177/0021955X9703300103.
[35] H.N. Wadley, D.T. Queheillalt, Thermal applications of cellular lattice structures, in: Materials Science Forum, Trans Tech Publications Ltd., 2007, pp.
242–247,https://doi.org/10.4028/www.scientific.net/MSF.539-543.242.
[36] J.C. Wallach, L.J. Gibson, Mechanical behavior of a three-dimensional truss material, Int. J. Solids Struct. 38 (2001) 7181–7196,https://doi.org/10.1016/
S0020-7683(00)00400-5.
[37] J.T. Wang, F. Jin, C.H. Zhang, Estimation error of the half-power bandwidth method in identifying damping for multi-dof systems, Soil Dyn. Earthq. Eng. 39 (2012) 138–142,https://doi.org/10.1016/j.soildyn.2012.02.008.
[38] X. Wang, W. Stronge, Micro-polar theory for a periodic force on the edge of elastic honeycomb, Int. J. Eng. Sci. 39 (2001) 821–850,https://doi.org/10.1016/
S0020-7225(00)00065-3.
[39] M. Xu, Z. Qiu, Free vibration analysis and optimization of composite lattice truss core sandwich beams with interval parameters, Compos. Struct. 106 (2013) 85–95,https://doi.org/10.1016/j.compstruct.2013.05.048.
[40] C. Yan, L. Hao, A. Hussein, D. Raymont, Evaluations of cellular lattice structures manufactured using selective laser melting, Int. J. Mach. Tool Manuf. 62 (2012) 32–38,https://doi.org/10.1016/j.ijmachtools.2012.06.002.
[41] Z. Zheng, J. Yu, J. Li, Dynamic crushing of 2d cellular structures: a finite element study, Int. J. Impact Eng. 32 (2005) 650–664,https://doi.org/10.1016/j.
ijimpeng.2005.05.007.
[42] H.X. Zhu, J.R. Hobdell, A.H. Windle, Effects of cell irregularity on the elastic properties of open-cell foams, Acta Mater. 48 (2000) 4893–4900,https://doi.
org/10.1016/S1359-6454(00)00282-2.
[43] H.X. Zhu, J.R. Hobdell, A.H. Windle, Effects of cell irregularity on the elastic properties of 2d voronoi honeycombs, J. Mech. Phys. Solids 49 (2001) 857–870, https://doi.org/10.1016/S0022-5096(00)00046-6.