Chapter 12: Geochemistry of the Solid Earth II: The Crust
Introduction
We now turn our attention to the crust. Though the crust forms only a small fraction of the mass of the Earth (about 0.5%), it is arguably the most varied and interesting fraction. Further, itÕs the frac- tion we can examine directly and therefore know most about. The crust has formed through igneous processes from the mantle over geologic time. There are two fundamental kinds of crust: oceanic and continental. Oceanic crust, created by magmatism at mid-ocean ridges, is basaltic in composition, thin, ephemeral, and relatively uniform. It is important in a number of respects, however. First, its composition tells us much about the composition of the mantle from which it is derived. Second, oce- anic crust may be, at least some times, the raw material from which continental crust is formed. Thus we begin by briefly examining the composition of oceanic crust and the factors that control this compo- sition. We then turn our attention to the continental crust, which is much thicker, essentially perma- nent, and on average andesitic in composition. The continental crust is also much more varied in com- position. Although it too has formed by magma- tism, its evolution is far more complex than t h a t of oceanic crust. Though we have an excellent un- derstanding of how oceanic crust forms, our under- standing of the processes that have led to t h e present continental crust is far from complete.
Subduction-related, or Ôisland arcÕ volcanism ap- pears to play a particularly important role in t h e formation of the continental crust, so we will pay special attention to processes in islands arcs. W e will then consider the problem of interaction of mantle-derived magma with the crust, then t h e problems of the composition and evolution and the continental crust, and finally differentiation of the crust through melting and metamorphism.
The Oceanic Crust
The crust beneath the oceans differs from t h e continental crust in a number of important re- spects. First, it is thinner, with a typical thick- ness of 6 km or, compared to an average thickness of 35 km or so for continental crust. Second, it is more mafic, i.e., richer in Mg and Fe and poorer in Si that the continental crust. Third, it is tempo- rary, on average, the time between its creation a t mid-ocean ridges and destruction at subduction zones is 100 million years or less, compared to an average age of about 2 billion years for the conti- nental crust. Finally, it is essentially monoge- netic; the vast majority of oceanic crust is created at mid-ocean ridges. As a result, it is much more uniform in composition than the continental crust.
In this section, we will focus entirely on the igne-
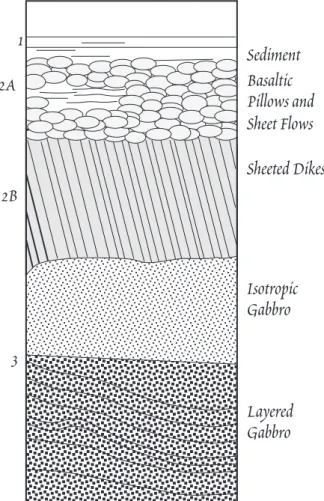
Basaltic Pillows and Sheet Flows Sheeted Dikes
Isotropic Gabbro
Layered Gabbro Sediment 1
2A
2B
3
Figure 12.1. Schematic cross-section of the oce- anic crust. Numbers on the left indicate t h e designation of seismically identifiable layers.
ous part of the oceanic crust. The geochemistry of ocean sediments and hydrothermal interaction be- tween seawater and oceanic crust are discussed in a Chapter 15.
In a 1962 paper that he called Òan essay in geopoetry,Ó Harry Hess summarized his radical views on seafloor spreading. He speculated t h a t mid-ocean ridges were produced by rising mantle convention currents, and that these convection cur- rents then moved laterally away from the mid- ocean ridges, producing the phenomenon of conti- nental drift. This concept now forms the basis of plate tectonics, the fundamental paradigm of ge- ology. Hess did miss one detail, however. He thought the oceanic crust was hydrated mantle, consisting of Òserpentinized peridotite, hydrated by release of water from the mantle over the ris- ing limb of a [convection] current.Ó However, when mantle decompresses as it rises, it does not merely dehydrate, it melts. This melting gener- ates the basalts that form the oceanic crust. In some respects, though, HessÕs mistake is a very minor in- deed. Oceanic crust is very ephemeral, and for this rea- son, it is sometimes better to think of it as part of t h e mantle reservoir than the crustal one. Nevertheless, ig- neous processes at mid-ocean ridges have fascinated many geochemists and much has been learned about them in the past several decades.
Seismic studies show that the oceanic crust has a l a y - ered structure (Figure 12.1). The uppermost layer, which is not present at mid-ocean ridges, consists of sediments (Seismic Layer 1). Beneath this lies Layer 2, composed of basaltic lava flows and the dikes that fed their erup- tion (the Òsheeted dike complexÓ), and finally gabbros (Layer 3). The gabbros apparently consist both of basal- tic magmas that crystallized in place (isotropic gabbros) and accumulations of minerals that crystallized as t h e basaltic magma was held in crustal magma chambers (layered gabbros). Because of the latter, the gabbros are probably somewhat more mafic on average than are t h e basalts. Layer 2 is often divided into Layer 2A and Layer 2B, with the latter having slightly higher seis- mic velocities. For many years it was thought t h a t boundary between the two was the boundary between the lava flows and the dikes. Based on the re- sults the Ocean Drilling Program, however, it appears the seismic boundary reflects instead a change in porosity due to filling of voids and fractures by secondary minerals in Layer 2B. It is thus a meta- morphic boundary, with the transition to the sheeted dike complex actually occurring within Layer 2B.
The average and standard deviations of the major oxides in basalts from the East Pacific Rise are listed in Table 12.1. An average of trace element concentration in mid-ocean ridge basalt (MORB) is listed in Table 12.2. The incompatible trace element abundances and isotope ratios are controlled
Table 12.1: Composition of MORB
EPR MORB1 Primitive MORB2 Average Std Dev.
SiO2 50.39 1.89 49.10
TiO2 1.72 0.47 0.6
Al2O3 14.93 1.13 16.4
ΣFeO 10.20 1.52 8.8
MnO 0.18 0.04
MgO 7.34 1.30 10.3
CaO 11.29 1.38 12.4
Na2O 2.86 0.46 1.9
K2O 0.25 0.47 0.1
P2O5 0.35 0.48
99.52 99.60
1Average of 1266 analyses of basalts from t h e East Pacific Rise compiled by C. Langmuir.
2A primitive MORB composition from B a s a l - tic Volcanism on the Terrestrial Planets
Table 12.2. Concentrations of Trace Elements in Average MORB
Element ppm Element ppm
K 883.7 Nd 11.18
Sc 41.37 Sm 3.752
Co 17.07 Eu 1.335
N i 149.5 Gd 5.077
Cu 74.4 Tb 0.885
Rb 1.262 Dy 6.304
Sr 113.2 Ho 1.342
Y 35.82 Er 4.143
Zr 104.2 Tm 0.621
Nb 3.507 Yb 3.90
Sn 1.382 Lu 0.589
Cs 0.0141 H f 2.974
B a 13.87 Ta 0.192
La 3.895 Pb 0.489
Ce 12.00 T h 0.1871
Pr 2.074 U 0.0711
From Hofmann (1988).
mainly by mantle chemistry, which we discussed in the preceding chapter. Hence here we will focus mainly on the major element composition of MORB, which is controlled mainly by igneous processes.
There was a considerable debate in the late 1960Õs and throughout the 1970Õs whether mid- ocean ridge basalts were ÔprimaryÕ (or close to pri- mary), i.e., whether they were direct mantle melts or whether they had experienced extensive frac- tionation crystallization before eruption. In t h e 1980Õs, this debate was resolved in favor of t h e view that most MORB had experienced extensive fractional crystallization. A critical observation is that all primary mantle-derived magmas must be in equilibrium with olivine of the composition found in the mantle. Mantle olivine is typically 90-92% forsterite and according to experimental studies such as that of Roedder and Emslie (1972) (see Chapter 4), a melt would have to have an atomic Mg/(Mg+Fe2+) ratio of around 0.72 to be in equilibrium with such olivine. The average compo-
This ratio, multiplied by 100, is called the ÔMg numberÕ, generally written Mg#.
0 10 20 30 40 50 60 70
50 100 150 200 250 300 50 100 150 100 200 300 400
Ave Mg# = 57.1 SLO< 50 mm/yr
Ave Mg# = 52.7 INTERMEDIATE 50-80 mm/yr
Ave Mg# = 52.8 FAST
> 80 mm/yr
Mg # Indian Pacific Atlantic
Frequency
Figure 12.2. Mg# in basalts from mid-ocean ridges of differing spreading rates. The Mg#
is used as an index of the extent of fractional crystallization. Because olivine is the pri- mary crystallizing phase, and because t h e Mg# of olivine is much higher than that of the liquid, Mg# will decrease during frac- tional crystallization. The figure shows that basalts from slow spreading ridges ex- perience somewhat less fractional crystal- lization on average than basalts from fast spreading ridges. The most fractionated ba- salts occur on intermediate spreading rate ridges where small discontinuous melt lens can occur. After Sinton and Detrick (1992).
H E J
AADTamayo Kolbeinsey
E H
J J J J
J J
JJ J JJ
J J
J JJ J JJ
J J JJ EEE
E E
EEE E E EE
E EE
E E
EE E E E EE E E E E
HH HH H H HHHH H HH H H H H H HH H
4
3
2
6 7 8 9 10
5 MgO %
Na2O % Na8.0 =2.31
Figure 12.3. Na2O vs. MgO in MORB from three ar- eas of the mid-ocean ridge system: the Australian- Antarctic Discordance, the Tamayo Fracture Zone area of the East Pacific Rise, and the Kolbeinsey Ridge, just north of Iceland. Thick arrows show calculated fractional crystallization paths (Ôliquid line of descentÕ) for each data set. Na8.0 values are the intersection of the fractional crystallization path with MgO concentration of 8%. This is illustrated for the Tamayo data (dashed lines), which has Na8.0 of 2.31. After Klein and Langmuir (1987).
sition listed in Table 12.1 has an Mg# of 59, and therefore could not be in equilibrium with mantle olivine. From this we can conclude that the oceanic crust, including the gabbroic section, is probably somewhat more mafic than the average MORB listed here. The primitive MORB composition in Ta- ble 12.1 has an Mg# of 70 and is close to a possible ÔprimaryÕ composition.
One of the remarkable features of basalts erupted at mid-ocean ridges is their uniform chemistry.
Nevertheless, the small variations in chemistry that do occur are significant in that they reveal t h e details of the magmatic processes at mid-ocean ridges. As the discussion above suggests, fractional crystallization is an important control on MORB composition. Olivine, augitic clinopyroxene, calcic plagioclase, and spinel, are, with rare exceptions, the only minerals to crystallize from MORB before eruption. Spreading rate, which is closely related to magma supply rates, seems to be an important factor in the extent of fractional crystallization: basalts erupted on fast spreading ridges are gener- ally more fractionated than those erupted on slow spreading ridges (Figure 12.2). On fast spreading ridges, such as the East Pacific Rise, magma supplies rates are generally sufficient to maintain a small steady-state magma chamber, perhaps a few hundred meters deep and 1-2 km wide, at a depth of a few kilometers beneath
the ridge axis (Sinton and Detrick, 1992). Melt trapped in this chamber will cool and crystallize. New magma ris- ing from the mantle will mix with the fractionated magma in the chamber before erup- tion. In contrast, magma sup- ply rates on slow spreading ridges, such as the Mid-Atlan- tic Ridge, are too low to main- tain a steady-state magma chamber. As new magma in- jected into the crust can erupt without mixing with older, more fractionated magma.
The other factors that con- trol the major element compo- sition of MORB are the degree and depth of melting. The ef- fects of these factors were in- vestigated by Klein and Lang- muir (1987). The difficulty with understanding the melt- ing process is that all MORB have suffered some fractional crystallization, and this tends to obscure the melting effects.
Klein and Langmuir found that MORB major oxide data from each locality on the mid-ocean ridge system formed a coherent and distinct array when oxide abundances or ratios of oxides were plotted against MgO (Figure 12.3). Calculated frac-
ZZZ F
A J Z B
ATLANTIC PACIFIC
BACK ARC BASINS CAYMAN & WOODLARK
INDIAN
A
A
J
B
Z
F
JJ J J
JJ J
J J JJ
J J Z
J J
J JJ J JJ
JJJ J
J JJJJ
J J J A A A AA AA AA A AA
F F
Z JJ
J Z
B B
Z BZ
Z ZZ
ZZ Z Z Z Z ZZ
ZZ
A
2..5 3.0 3.5
2.0 1.5
A J
Z B A
J
J J J J
J JJ J
J J J
J JJ
J
J J
J J J J J
J J J J J
J
J JJ J J
JJJ A A
A A A A
A A AA A
B B
B A Z
Z ZZ
Z Z ZZ
ZZ ZZ
Z Z Z ZZZ
Z Z A Z
J
FF F
6 8 10 12
Fe8.0
0 1000 2000 3000 4000 5000 6000
Depth, m Na8.0
Figure 12.4. Relationship between Na8.0 and Fe8.0 in MORB and axial depth of mid-ocean ridges. Data from regions near hot spots are circled. Data from ridge segments near the Gal‡pagos, Azores, and Jan Mayen hot spots, which are enclosed in the dashed field, appear to have anomalously low Fe. From Klein and Langmuir (1987).
tional crystallization paths, illustrated in Figure 12.3, passed through these arrays, so they concluded that the trends observed in these plots reflected fractional crystalliza- tion. They then argued that differences be- tween the trends reflected differences in t h e melting process.
Rather than attempt to solve the difficult problem of determining the composition of parental magmas, Klein and Langmuir sim- ply corrected regionally averaged data to a common MgO concentration of 8%. They did so simply by projecting each regional array on an oxide versus MgO plot to 8% MgO. For example, a line drawn through Na2O data from the Tamayo Fracture Zone region of t h e East Pacific Rise intersects 8% MgO at 2.31%
Na2O (Figure 12.3). They called this t h e Na8.0 value; thus Tamayo has an Na8.0 of 2.31. So instead of comparing primary magma compositions, they compared compo- sitions that had experienced similar extents for fractional crystallization.
Klein and Langmuir found that the re- gional corrected averages correlated strongly with the depth of the ridge axis (Figure 12.4). Comparing the variations in concen- trations they observed with those in experi- mentally produced partial melts, they found that both variations in the mean pressure of melting and in the mean extent of melting were required to explain the data. For ex- ample, sodium concentrations in partial melts appears to be controlled only by the ex- tent of partial melting. Iron concentrations, on the other hand, are only weakly affected
by degree of partial melting, but are strong functions of the pressure at which melting occurs (Figure 12.5).
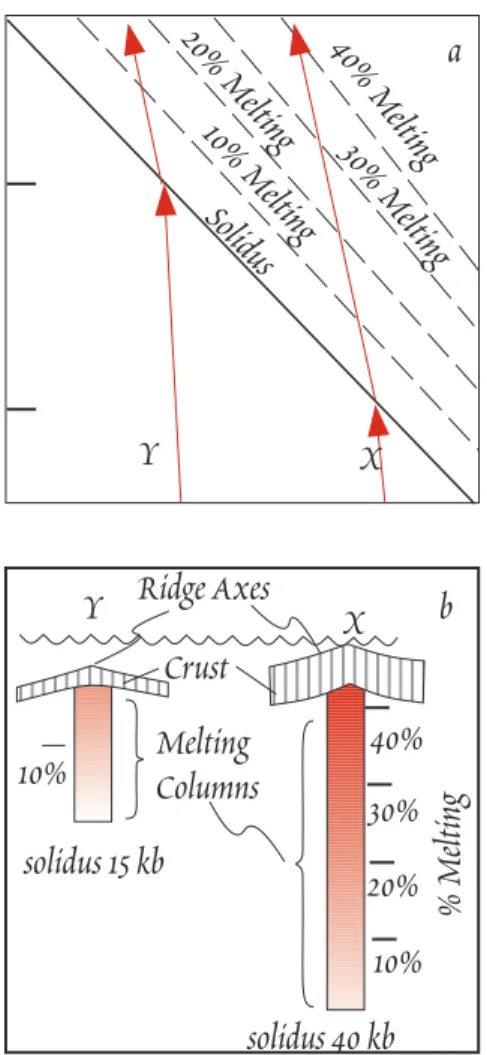
Klein and Langmuir concluded mantle temperature was probably the key factor in accounting for both depth of the ridge axis and the composition of melts erupted, because mantle temperature affects both degree of melting and the mean depth of melting. Shallow segments of the mid-ocean ridge sys- tem overlie relatively hot mantle. The hot mantle intersects the solidus at greater depth and ulti- mately melts to a greater degree (Figure 12.6). Hotter mantle is less dense and therefore more buoy- ant, so that ridges overlying hotter mantle will be more elevated. Cooler mantle will not begin to melt until it reaches shallower depth, and total extent of melting will be more limited. Klein and Langmuir concluded that a range in degree of melting of 8-20% and in mean pressure of melting of 0.5 to 1.6 GPa were required to produced the range in compositions observed. The hottest regions of the man- tle occur near mantle plumes such Iceland. The coolest region occurs at the Australian-Antarctic Dis- cordance, a region where the ridge is particularly deep and isotope studies have suggested is a bound- ary between mantle convection cells. Overall, the data suggested a range in mantle temperature of some 250¡ C.
15 kb 10 kb 5 kb
Paths of Adiabatic Melting
fractional crystallization of olivine AAD Tamayo Kolbeinsey Maximum
Melting 25
20
15
10
12 10
8 6
4
FeO (mole %)
MgO (mole %)
Maximum M elting
Figure 12.5. Variation of MgO and FeO in partial melts of mantle peridotite. Grayed fields show t h e compositions of experimental produced partial melts of peridotite at 3 different pressures. Hashed fields show compositions of high MgO basalts from the AAD, Tamayo, and Kolbeinsey regions. Curves for the calculated compositions at maximum and minimum melting are also shown. Dashed arrows show the path of melt composition produced by melting of adiabatically rising mantle. Curved ar- row shows how the compositional a 15 kbar melt will evolve due to fractional crystallization of oli- vine. After Klein and Langmuir (1987).
Processes in Subduction Zones and Island Arc Geochemistry
Though the evolution of the continental crust has undoubt- edly been complex and involved a number of processes, there is virtual unanimous agreement among scientists that magma- tism is primary way in which the continental crust has formed. Today, and throughout the Phanerozoic, additions to the continental crust occur primarily by magmatism associated with subduction. As we shall see, there are also good chemi- cal arguments that subduction zone volcanism has been t h e most important, though not necessarily exclusive, mechanism by which the continents have formed. Volcanos of the Andes Mountains of South America, which overlie the subducting Nazca Plate, are perhaps the best example of this process.
Not all subduction zones are located along continental mar- gins; indeed, most are not. The Marianas are a good example of an intra-oceanic subduction zone. Some old island arcs, however, such as Japan, parts of Indonesia, and the Aleutians have crustal seismic structures that are intermediate between those of continental and oceanic crust. This suggests that is- land arcs may eventually transform to continental crust. Plate motion may eventually result in these arcs accreting to conti- nents. Thus intra-oceanic arcs may also contribute to continen- tal growth. Thus in attempting to understand how the conti- nental crust has formed, it is well worth while to consider subduction zone processes.
Subduction zones are, of course, the place where oceanic crust and lithosphere (often referred to as Òthe slabÓ) are re- turned to the mantle. However, oceanic crust is not chemically identical to the basalt produced at mid-ocean ridges. Two im- portant things have happened to the crust between its crea- tion and subduction. First, it has reacted with seawater at a variety of temperatures. This process, which we discuss in de- tail in Chapter 15, hydrates the oceanic crust, adds some ele- ments to it from seawater (e.g., Mg, U), and extracts others.
Isotopic exchange with seawater affects the isotopic composi- tion of Li, B, and Sr. The second thing that happens is t h a t the oceanic crust acquires a sedimentary veneer. Elements gained through hydrothermal alteration and the elements in sediments are derived almost entirely from the continental crust. Thus the subducting oceanic crust carries with it a cer- tain amount of continental crustal material (particularly when sediment is subducted) and subduction zones are there- fore the principle sites of crustÑtoÑmantle mass transfer.
Major Element Composition
Magmas found in island arcs (we'll use the term island arc for all subduction zone magmatism, including continental mar- gin type) appear to be predominantly andesitic. It seems un- likely that andesite is the principle magma produced in arcs,
40%
30%
20%
10%
solidus 15 kb
solidus 40 kb
10% Melting
Columns Ridge Axes
Crust
Y X b
% Melting
Solidus 10% M
elting 20% M
elting
30% M elting 40% M
elting
Y X
a
Figure 12.6. a.) Cartoon of t h e pressure-temperature relationship of adiabatically rising mantle undergoing melting. Hotter mantle (X) intersects the solidus at higher pressure and ultimately melts to a higher degree than cooler mantle (Y). The break in slope occurs because energy is consumed by melting (enthalpy of fusion). b.) Cartoon illustrating the re- lationship between axial depth, crustal thickness, melting, and mantle temperature. Hotter mantle (X) maintains the ridge a t higher elevation because of its buoyancy. It also has a deeper melt column and melts to a greater degree, producing thicker crust than cooler mantle (Y). After Klein and Langmuir (1989).
however. Generally, we don't see the lower parts of arc volcanic edifices, which may be basaltic. There is also considerable doubt whether an andesite can be produced by par- tial melting of the mantle, particularly a t depth. Most arcs sit about 100 km above t h e Benioff zone, and magmas may be generated close to this depth. A safer bet is that the pri- mary magma is actually basaltic, of which an- desites are fractional crystallization products.
In any case, basalt is not uncommon in intra- oceanic arcs.
In major element composition, island-arc volcanics (IAV) are not much different from other volcanic rocks. Compared to MORB, t h e principal difference is perhaps simply that si- liceous compositions are much more common among the island-arc volcanics. Most IAV sil- ica saturated or oversaturated; silica under- saturated magmas (alkali basalts) are rare. In that sense, we might call them tholeiitic.
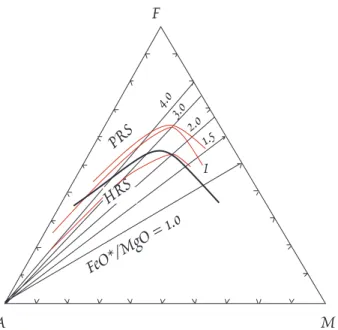
However, in the context of island arc magmas, the term tholeiite has a more restrictive meaning. Two principal magma series are rec- ognized, one called tholeiitic, the other called calc-alkaline. The principle difference is that the tholeiites differentiate initially toward higher Fe and higher Fe/Mg than the calc-al- kaline lavas. This is illustrated in Figure
12.7. In addition, the tholeiites tend to be poorer in K and some other incompatible elements than the calc-alkaline rocks. Kay et al. (1983) argued that the difference, at least for the Aleutians, relates to tectonic environment and depth of magma stagnation and crystallization. Tholeiites occur in ex- tensional environments in the arc where magma can ascend relatively rapidly and cool less. Fractional crystallization occurs at shallow levels. Calc-alkaline lavas ascend more slowly and undergo crystallization at greater depth.
A third series is sometimes defined, the high-alumina se- ries. IAV in general tend to have slightly higher Al contents on average than MORB or OIB, but there is very considerable overlap with the OIB and MORB fields.
IAV also tend to be somewhat poorer in Ti than MORB and OIB, though this is not necessarily a primary feature. Perfit et al. (1980) argued that the difference in Ti content is due to early crystallization of Fe-Ti oxides (e.g., magnetite and i l - menite) in IAV, which buffers the Ti concentration. Thus t h e higher Ti concentrations in MORB may reflect the way t h e magmas differentiate rather than higher Ti concentrations of MORB primary melts or MORB sources. The same is true for iron enrichment. Fe-Ti oxide precipitation may in turn depend
2 J
J J J
J J J
J J J
J J
J J J
J J JJ JJ J
J J J
J J J JJ
J JJ
JJ J J
J J
J J
J J J
J J J
10 20 30 40 50 60 70
1 3 4
6 8 10 12 14
Crustal Thickness (km) Ca6.0Na6.0
Figure 12.8 Correlation of Ca6.0 and Na6.0 with crustal thickness in is- land arc basalts. Ca6.0 and Na6.0
are the CaO and Na2O concentra- tions after correction for fractional crystallization to 6.0 MgO. From Plank and Langmuir (1988).
4.03.0 2.01.5
FeO*/MgO = 1.0 PRS HRS
I
F
A M
Figure 12.7 AFM (A=K2O+Na2O, F=FeO+MnO, M=MgO) diagram illustrating the difference be- tween tholeiitic and calc-alkaline lava series of island arcs. Calc-alkaline rocks plot below t h e heavy line, tholeiites above. PRS is Kuno's pi- geonite rock series; HRS is Kuno's hypersthene rock series. I is the Thingmuli series of Iceland.
After Carmichael, et al. (1973).
on oxygen fugacity. Oxygen fugacity is higher in IAV because of the higher water contents. IAV are enriched in water as well as other volatiles compared to MORB and at least some OIB (e.g., H a - waii). Island arc volcanics may also have higher CO2/H2O ratios than MORB (Perfit et al., 1980).
Plank and Langmuir (1988) investigated the factors that control the major element composition of island arc basalts. They treated the data in a manner analogous to Klein and Langmuir (1987), cor- recting regional data sets to a common MgO content, but they used 6% MgO rather than the 8% used by Klein and Langmuir. They found that Na6.0 and Ca6.0 (i.e., Na2O and CaO concentrations corrected to 6% MgO) correlated well with crustal thickness (Figure 12.8). They argued that crustal thickness de- termines the height of the mantle column available for melting. Most island arc volcanoes are lo- cated above the point where the subducting lithosphere reaches a depth of 100-120 km. This suggests that melting begins at a relatively constant depth in all island arcs. If this is so, then over which mantle can rise and undergo decompressional melting will be less if the arc crust is thick, leading to smaller extents of melting beneath arcs with thick crust, and higher Na6.0 and Ca6.0 in the parental magmas.
Trace Element Composition
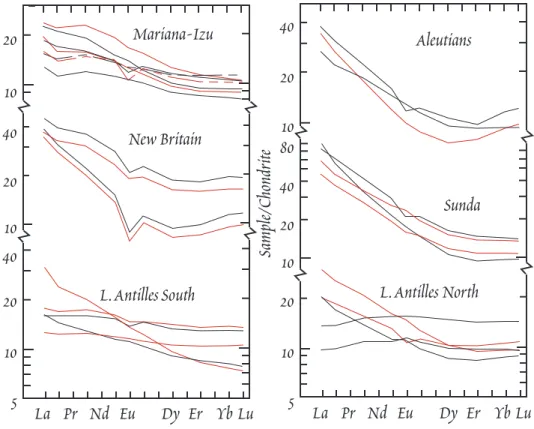
The differences in trace elements between island arc volcanics and those from other tectonic envi- ronments are probably more significant than the differences in major elements. Rare earths, however, are not particularly distinctive. There is a very considerable range in rare earth patterns: from LRE depleted to LRE enriched (Figure 12.9). IAV are virtually never as LRE depleted as MORB, but abso- lute REE concentrations are, however, often low, and it is not unusual for the middle and heavy rare earths to be present at lower concentrations than in MORB. One other aspect is of interest. Ce anoma- lies occur in some IAV, whereas they are never seen in MORB or OIB, though they have been observed in continental carbonatites and kimberlites. The significance of the Ce anomalies remains uncertain.
La Pr Nd Eu Dy Er YbLu La Pr Nd Eu Dy Er YbLu 5
10 20 10 20 40 8010 20 40
5 10 20 10 20
40 40 10
20 Aleutians
Sunda
L. Antilles North L. Antilles South
New Britain Mariana-Izu
Sample/Chondrite
Figure 12.9. Rare earth patterns of some typical island arc volcanics. From White and Patchett (1984).
Ce anomalies occur in sediment, so there is the immediate suspicion t h a t the anomalies in IAV could be inher- ited from subducted sediment.
Island-arc volcanics are richer in the incompatible alkalis and alkaline earths (K, Rb, Cs, Sr, and Ba) relative to other incompatible elements when compared with MORB or OIB. This is illustrated in Figure 12.10, using t h e Ba/La ratio. Though both IAV and oceanic basalts can have a large range in rare earth patterns, as illustrated by the range in La/Sm ratios, t h e Ba/La ratios of IAV are generally higher.
Island-arc volcanics tend to be poor in the so-called high-field-strength elements (HFS), i.e., those elements with charge of +4 or +5 (Chapter 7).
While Nb and Ta are almost invaria- bly depleted in arcs, Zr, Hf, and T h are not. It would be better to speak of Nb and Ta depletion. This is illus- trated in Figure 12.11.
Figure 12.12 is a spider diagram summarizing the trace element differ- ences between island arc volcanics and MORB. To summarize, IAV
may be either light-rare- earth enriched or light-rare- earth depleted. They gener- ally are enriched relative to MORB in the alkalis and a l - kaline earths. Significantly, these are the elements most enriched in sediments, and t h e most soluble elements. Rela- tive to MORB, IAV tend to be depleted in Nb, and Ta, and sometimes in Ti, Hf, and Zr.
These are the elements least enriched in sediments, and are generally highly insoluble in aqueous solutions because of their high ratios of ionic charge to radius (Z/r).
E
E
E E
E
E EE E
E E E E E E E
E EE E
E EE E
E E E E EE EE E
EE
EE E E E
EE E E E
E E E E E EEEEE E EE EE
EE E E E E E E E E E
E EEE E E EE E
E EEE E E E EE EE EE E E E
E EEE E E EE E EEE
EEEEEEE E E
E E
E E
EE E E
E E E EE E E
E E
E E
E E
E EE
E
1 2 3 4 5 6
1 2 3 4 5
6
7 8 9 10 11
(La/Sm)N
Oceanic Basalts
(Ba/La)N
Figure 12.10. Relative alkali-alkaline earth enrichment of IAV illustrated by plotting the (Ba/La)N ratio vs. t h e (La/Sm)N ratio. The subscript N denotes normalization to chondritic values. From Perfit et al. (1980).
E C
G B J
Lesser Antilles SW Pacific Sunda Scotia Aleutians
J E C
B BB
B B B B
BB B BB BB B
B
B B
BB B BB B G G CCCCCGG CCC C
C C CCCC CC CCC
GG E E
E
C C C
C C C
GG
CEEC E B
C C
CC C
C CC C C CC
J JJ
C J C
CC J J JJ JJ CJ
JJ J J J
C CC
C B
B C BJ
B BB B B B J
B B B
B B BB B B J
B BB BB JJ
J J J
B B B
BBJJ B B
J
J J
J J J BB
B
BB B B JJ
J CC B CC B C
B J JJ J J C J
J B
B
G C
C C B BB B B
J J
B B B
B BB
J J
J
B C C
40 30 20 10
200 400 600 800 1000 1200
Ba, ppm Hawaii
MOR Iceland
Chondr itic
Nb, ppm
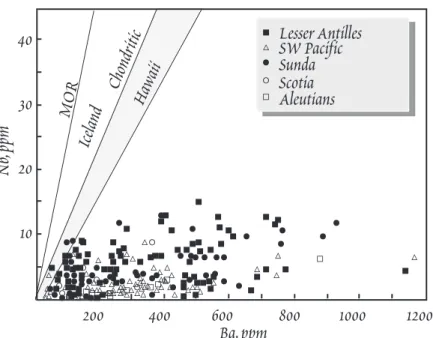
Figure 12.11. Low Nb concentrations of IAV compared to MORB and OIB illustrated by plotting Nb vs. Ba. From Perfit et a l . (1980).
Isotopic Composition and Sediment Subduction
Island arcs overlie subduc- tion zones, which raises t h e obvious question of the degree to which subducting oceanic crust and sediment might con- tribute to island arc magmas.
These questions have been most successfully addressed through isotope geochemistry.
Sr isotope ratios are gener- ally higher, and Nd isotope ratios generally lower than in MORB, with 87Sr/86Sr ratios around 0.7033 and εNd of +8 be- ing fairly typical of intra- oceanic IAV (Hawkesworth et al., 1991). Though there is considerable overlap with oceanic basalts (MORB and J J J J J J J
J J J
J J J J J J
▲
Cs Ba U N K La
Sr SmEu Dy
Ti Zr
Hf Y Er Yb Lu
Nd Ta Ce
Th
Rb Gd
5 10 50 100
1
▲ ▲ ▲ ▲ ▲ ▲ ▲ ▲ ▲
▲▲
▲▲
▲
▲▲ Arc Tholeiite
calc-alkaline basalt high-Al basalt alkaline basalt
MORB
Normalized Concentration
Figure 12.12. Spider diagram comparing typical incompatible ele- ment contents of island arc volcanics and MORB. Note the relative enrichment in alkalis and alkaline earths and the depletion in Ta in the island arc volcanics. After Sun (1980).
15.3 15.4 15.5 15.6 15.7 15.8 15.9
17 17.5 18 18.5 19 19.5 20
MORB Indian MORB
Sediments Sunda
Marianas
Philippines S. Sandwich
L. Antilles
Taiwan
Aleut ians
Banda
206Pb/204Pb
207 Pb/204 Pb
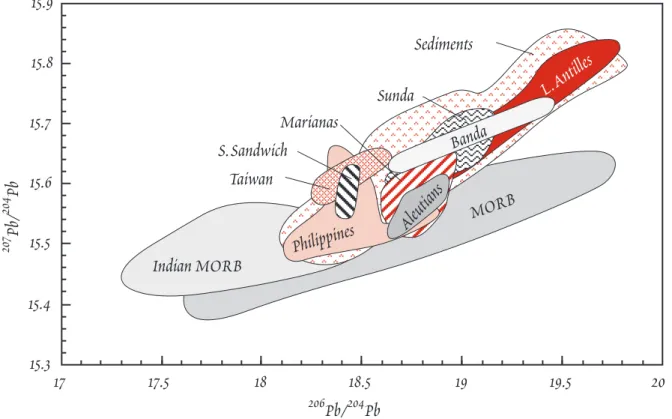
Figure 12.13. Pb isotope ratios in island arc volcanics. Fields for the South Sandwich, Lesser An- tilles, Aleutians, Marianas, Philippines, Taiwan, Banda and Sunda arcs are shown and compared with fields for Atlantic and Pacific MORB (field labeled MORB) and Indian Ocean MORB (IMORB), and modern marine sediments.
OIB), there is a slight tendency for IAV to have higher Sr isotope ratios for a given Nd isotope ratio and hence plot to the right of the oceanic basalt ar- ray on a NdÐSr isotope ratio plot. This shift to higher Sr isotope ratios appears to result from a con- tribution of subducted oceanic crust to IAV magma sources. This conclusion is based on the observation that during weathering and hydrothermal altera- tion of the oceanic crust, isotopic exchange with seawater shifts Sr isotope ratios of the oceanic crust to higher values. Nd isotope ratios, are virtually unaffected by these processes because of the ex- tremely low concentration of Nd in seawater.
206Pb/204Pb isotope ratios overlap values of oceanic basalts, but generally having a more restricted range.
207Pb/204Pb ratios are typically higher IAV than most oceanic basalts. They tend to form steeper arrays on
207Pb/204PbÐ206Pb/204Pb plots, and overlap the field of marine sediments (Figure 12.13). For most island arcs, Pb isotope ratios in the arc volcanics lie be- tween sediment local to the arc and the MORB field (Karig and Kay, 1980). We pointed out in the last chapter that Indian Ocean MORB have lower
206Pb/204Pb and higher 207Pb/204Pb than do MORB from the Atlantic and Pacific. This presumably reflects a difference in the isotopic composition between t h e
upper mantle beneath the Atlantic and Pacific on the one hand and the Indian on the other. Interest- ingly, the Pb isotope arrays for Indian and southwestern Pacific arcs (Sunda, Banda, Philippines, and Taiwan) are elongate toward the Indian Ocean MORB field rather than Atlantic and Pacific MORB.
On the whole then, Pb in island arc magmas appears to be a mixture Pb from local sediment and local upper mantle.
The Lesser Antilles arc illustrates this particularly well. The Lesser Antilles arc lies on the Car- ibbean Plate just to the north of South America. The Orinoco River, which drains the Archean Guiana Highland, delivers sediment that contains particularly radiogenic Pb to the front of the arc.
As a result, the Pb isotope ratios in sediments of the Demerara Abyssal Plain decrease systematically from south to north (Figure 12.14). A similar pattern of decreasing Pb isotope ratios can be seen in t h e volcanics of the arc, apparently reflecting the changing isotopic composition of the sediment being subducted.
Pb isotope ratios are particularly sensitive to the presence of subducted sediment because the con- centration of Pb in sediment is so much higher, well over two orders of magnitude, than in the mantle.
In a mixture of sediment and mantle, the Pb isotope ratios of the mixture are virtually identical to those of the sediment when as little as 2 to 3% sediment is present in the mixture. This is not true of Sr and Nd isotope ratios.
10Be is an even more sensitive indicator of the presence of sediment in IAV magma sources than Pb, because it is present in young sediment, but entirely absent from the mantle. As we found in Chapter 8,
10Be is a cosmogenic isotope; it is produced in the atmosphere by cosmic ray spallation of 14N. It has a half-life of only 1.5 million years, so we would not expect to find significant amounts of 10Be in t h e Earth's interior; any created before the solar system formed has long since decayed away. 10Be cre- ated in the atmosphere is purged by rainfall and is strongly absorbed by clays of sediment and soil.
15°
10°
65° 60° 55°
18.95 18.91
19.219.3 19.519.5 19.3
19.5 19.3
19.2 19.1 19.0 18.9 206Pb/204Pb
Or inoco R .
Lesser llAnti se
South America
Figure 12.14. Pb isotope ratios in volcanics of the Lesser Antilles island arc and on the At- lantic Plate subducting beneath it. Contours show the 206Pb/204Pb ratios in the sediment, which increases from north to south due to the increasing contribution of Orinoco River sediment. The average 206Pb/204Pb for each island, which is shown beside the island, also increases from south to north. From White and DuprŽ (1986).
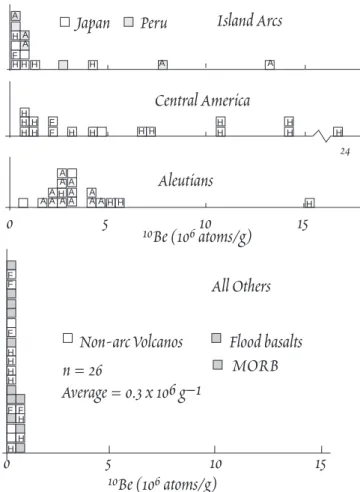
Workers at Carnegie Institution of Washington turned to 10Be when they were seeking a means of determining subduction rates. They decided to attempt to deter- mine the amount of 10Be in island arc vol- canics on the assumption that sediments containing 10Be were subducted, and by comparing the amount in arc volcanics with the amount of sediment, they hoped to de- termine how much had decayed away, and thereby how much time had elapsed since the sediment left the surface. The problem proved to be too complex to determine sub- duction rates quantitatively. However, in the course of this attempt, they produced by far the best evidence that sediment is indeed subducted in island arcs. Figure 12.15 compares the amount of 10Be in arc lavas with that in non-arc lavas. 10Be has not been found in measurable quantities (106 atoms per gram) in non-arc lavas, but has been found in lavas of some arcs. The inter- pretation is that the 10Be originates from sediment subducted to the magma genesis zone. The absence of 10Be in other arc lavas does not mean sediment is not subducted in those arcs. Only very young sediment, <
10-15 Ma, will contain appreciable amounts of 10Be, so if the uppermost sedi- ment is removed in an accretionary wedge, no 10Be will be delivered to the magma genesis zone even though deeper, older sediment is being subducted.
Figure 8.36 showed that IAV have higher and more variable δ18O than either MORB or OIB. This may also be attributed to a contribu- tion of subducted oceanic crust and sediment. Indeed, as we have said before, oxygen isotope ratios can be changed only at or near the surface of the Earth, so this is the only way the δ18O of IAV can be readily explained.
Magma Genesis in Subduction Zones
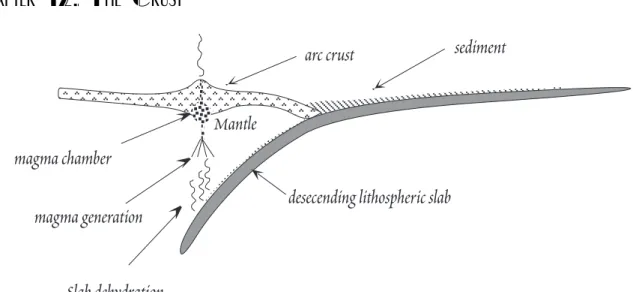
Now that we have an overview of the composition of arc magmas, letÕs consider in more detail t h e processes that lead to the unique geochemistry of island arc magmas. Figure 12.16 summarizes petro- genesis in the subduction zone environment.
Most geochemists and petrologists believe that arc magmas are produced primiarily within t h e mantle wedgeà (e.g., Hawkesworth et al., 1991; Kay and Kay, 1994). The evidence for this is: ( a ) Primary arc magmas differ only slightly in their major element chemistry from oceanic basalts, which are definitely mantle-derived. The andesitic nature of many arc magmas probably results from fractionation crystallization in a crustal or subcrustal magma chamber. It is therefore most
à The mantle wedge is the part of the mantle overlying the subducting slab; because the slab descends at an angle, this region in triangular, or wedge-shaped.
A A A A A A A
A A A H F
A A
H H H
H H H H
H H
H H H H H H
F H H
H H H H
F A A
H AA A
Aleutians Central America Peru
Japan
0 5 10 15
24
Island Arcs
10Be (106 atoms/g)
H
F
H H F H H H H F F F
Non-arc Volcanos Flood basalts n = 26 MORB
Average = 0.3 x 10⁶ g–1
0 5 10 15
All Others
10Be (106 atoms/g)
Figure 12.15. 10Be in arc and non-arc lavas. ÒAÓ indi- cates sample from active volcano, ÒHÓ a historic erup- tion, and ÒFÓ (fresh) indicates collected during erup- tion. From Tera et al., 1986.
likely they are partial melts of peridotite rather than subducted basalt or sediment. (b) Radiogenic isotopic and trace element systematics generally allow only small fraction of sediment (generally a few percent or less) to be present in arc magma sources. Relatively high 3He/4He ratios in arc lavas confirm this. (c) Rare earth patterns of island arc magmas are consistent with these magmas being generated by partial melting of peridotite, but not by partial melting of eclogite, which would be t h e stable form of subducted basalt at 100 km depth (the subducting lithosphere is typically located a t about 100 to 120 km depth beneath island arc volcanos). Because the heavy rare earths partition strongly into garnet (e.g., Figure 6.15), melts of eclogite should show steep rare earth patterns, with low concentrations of the heavy rare earths. This is not generally the case. Rare high magnesium an- desites, sometimes called ÒadakitesÓ (after a well documented occurrence on Adak Island in the Aleu- tians) with steep rare earths patterns may represent exceptions to this rule and may indeed by gener- ated by small extents of melting of subducted oceanic crust (Kay, 1978; Defant and Drummond, 1990).
It is possible that such Òslab meltsÓ were more common several billion years ago. We discuss this pos- sibility later in the chapter. Finally, we should point out that some scientists believe arc magmas are indeed generated in the subducting slab (e.g., Brophy and Marsh, 1986).
We have seen that isotope systematics, particularly Pb and 10Be, provide evidence of subducted sediment in the sources of most arcs. Subducted sediment appears to influence the trace element com- positions of arc lavas as well. Plank and Langmuir (1993) carried out careful study of the composition of volcanics from 8 arcs and the sediments being subducted beneath them. By analyzing representa- tive samples from the sediments and considering the proportions of sediment types being carried be- neath the arc, they estimated the flux of elements being carried by sediment beneath the arc. They found they could relate the degree of enrichment of most incompatible elements to the sediment flux of that element. For example, the Ba/Na and Th/Na ratio (after correction for fractional crystalli- zation to 6% MgO) correlate strongly with the Ba and Th sediment fluxes (Figure 12.17). Different arcs are enriched to different degrees in these elements: for example, the Lesser Antilles arc has mod- erate Th/Na ratios but low Ba/Na ratios. The difference appears to be due to the difference in t h e sediment flux.
The trace element geochemistry of island arc magmas cannot, however, be explained solely by par- tial melting of simple bulk mixtures of mantle, sediment and subducted oceanic crust. In particular, the characteristic enrichment of the alkalis and alkaline earths cannot be accounted for in this way.
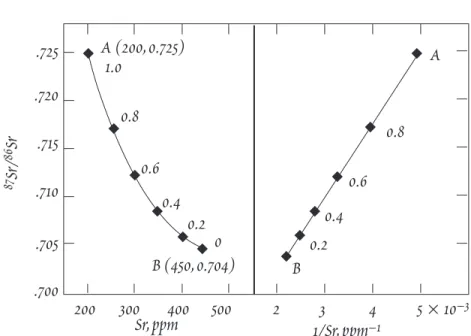
This is illustrated in Figure 12.18, which compares the observed enrichment of Lesser Antilles low-K basalts in incompatible elements with the enrichment predicted assuming the source was a mixture of depleted mantle and sediment. White and DuprŽ (1986) calculated the fraction of sediment in t h e mixture from Nd isotope ratios of the basalts, and assumed simple batch melting. This simple model
Slab dehydration magma generation magma chamber
arc crust
desecending lithospheric slab Mantle
sediment
Figure 12.16. Cross-section of a subduction zone illustrating island arc magma genesis.