Value of statistical data and predictive model transferability
Predictive Customer Data Analytics – The Value of Public Statistical Data and the
Geographic Model Transferability
Completed Research Paper
Konstantin Hopf University of Bamberg
Kapuzinerstraße 16, 96047 Bamberg konstantin.hopf@uni-bamberg.de
Sascha Riechel University of Bamberg
Kapuzinerstraße 16, 96047 Bamberg sascha-riechel@gmx.de
Mariya Sodenkamp University of Bamberg
Kapuzinerstraße 16, 96047 Bamberg mariya.sodenkamp@uni-bamberg.de
Thorsten Staake University of Bamberg
Kapuzinerstraße 16, 96047 Bamberg thorsten.staake@uni-bamberg.de
Abstract
Companies pay high prices for detailed customer information (e.g., income, household type) for gaining insights and conducting targeted marketing campaigns. We argue that companies can utilize predictive analytics artifacts to derive such information from existing customer data in combination with freely available data sources, such as open government data. In this study, we use a machine learning artifact for a specific yet highly relevant case from the utility industry, trained on data of 7,504 energy customers and investigate two important aspects for predictive business analytics:
First, we identified the sparsely available open government statistics and found that even that limited amount of open data can increase our artifact’s performance. Second, we applied the predictive models, trained with a regional customer dataset, on households in other geographic regions with acceptable performance loss. The results support the development of systems aiding managerial decision-making, predictive marketing and showcase the value of open data.
Keywords: Predictive Analytics, Transferability, Supervised Machine Learning,
Open Government Data, Public Sector Information, Data Integration
Introduction
Information on customers, beyond the customer core data that is usually gathered for order fulfillment and invoicing, attracts high interest among companies. Such data serves as source for targeted marketing campaigns, including up- and cross-selling, sales forecasts, or companies’ strategic alignment.
Energy retailer particularly rely on such data to realize customer loyalty and energy-efficiency campaigns.
Such campaigns for retaining existing or attracting new customers became necessary in consequence of increased market pressure due to the ongoing energy retail market liberalization in many countries.
Customer churn rates in that industry are at substantially high levels: for example, 6.4% in Germany 2015 (BNetzA 2016 p. 184), 10.3% in Sweden 2014 and 12.7% in Norway 2014 (NordREG 2017). Another reason is the fact that utility companies need to carry out cost-effective energy saving campaigns among residential customers, triggered by a growing number of energy-efficiency mandates. Such mandates range from incentives for efficient behavior to subsidies for energy-efficient construction – for example in Germany (BMUB 2014) – to mechanisms that decouple the amount of energy sold from the profit of utilities in some states of the U.S. (Eto et al. 1997).
The knowledge on individual residential customer details (e.g., whether the household belongs to the group of families with children vs. retirees, electric vs. oil/gas heating, or the age of household members) can be utilized for the above-mentioned purposes in marketing and energy efficiency. For instance, utilities can tailor energy saving advices to specific customer groups or give consumption feedback that includes references to similar dwellings addressees, which has been proven to be more effective than unspecific feedback (Ayres et al. 2013; Fischer 2008; Tiefenbeck et al. 2013; Vassileva et al. 2012). From the retailing perspective, the shift from mass-marketing campaigns with high scattering loss towards individualized customer communication and one-to-one marketing campaigns, that treat each customer uniquely according to its living situation and preferences, has been shown to create competitive advantage (Bose 2002; Xu and Walton 2005).
For large-scale implementations of such targeted campaigns, companies need a reliable base of household data. It is common practice that companies purchase such information from data providers and spend a considerable amount of their marketing budget for such information. Together with our partners from the utility industry, we asked address trading companies for enriching a customer core dataset from a utility company. The prices ranged from about € 0.10 per address for general statistical data (e.g., population density, buying power, mean household size) to a range of € 0.10 – € 0.30 for one or more micro-census criteria per address (e.g., estimated number of residents and their most frequent age in one household, the housing type and age, and the interests of the residents). Some data providers offer even more precise customer data, such as “well-off middle and upper class singles”, but for higher costs per address.
Considering that the cost of a personalized mailing lies at approximately € 1 to € 2, the cost component of such an address purchase amounts to 5-30%.
Alternatively, companies conduct customer surveys themselves, motivate customers to use their online self-service portal (and ask for information during registration and use), or introduce customer-loyalty programs to grasp data on their customer base. Typical problems here are data sparsity (only a small portion of customers return questionnaires or register on online platforms) and self-selection bias (e.g., elderly people are less often willed to participate in online surveys).
Predictive business analytics methods provide the ability to make use of company-owned data and provide in this way business value, as highlighted recently by several information systems (IS) scholars (Lycett 2013; Mithas et al. 2013; Sharma et al. 2014). In the same vein, several data analytics case studies (Habryn et al. 2012; Hopf et al. 2016; Jank and Shrivastava 2015; Sodenkamp et al. 2015) were able to show how companies can make use of their own data (e.g., customer address information and their buying history, and contents in their customer relationship management systems) and predict household characteristics from such company-owned data. However, there appears to be a gap between the abstractly stated “value of business analytics” and the concretely shown business advantages in single case studies.
Our work helps to bridge the gap between abstract and concrete value statements about predictive IS. By
means of a relevant case of the utility industry – the prediction of household characteristics based on
publicly available and company-owned data – we answer two research questions described below with
the help of a comprehensive dataset on 7,504 customers from seven utility companies in Switzerland and Germany. Our paper follows Müller et al.’s (2016) guidelines for presenting data analytics results for IS research. After the presentation of our concrete research questions and a brief summary of related literature, we highlight the theoretical contribution that we seek to make with our study. Thereafter, we describe our predictive IS artifact together with the underlying data, provide the results, offer interpretations on the findings, and summarize our answers to the research questions. We include proper links to all online available datasets and open-source software used in this study. The replication of our analysis should be possible with the provided references and the research presented in this paper.
Research Questions
Our first aspect in this paper is to investigate the value of government statistical data as an addition to company-owned data for the use in customer data analytics by means of a specific but relevant case study. In the recent years, governments have put large effort in making government data available to the public – most notably, the U.S. and the U.K. administrations have started open data initiatives (Immonen et al. 2014). Also the EU decided to publish public sector data (EU 2003, 2013a) and started open data initiatives: In 2007, the INSPIRE project (EU 2007) was launched that aims to build a geographic and environmental data infrastructure with public data of its member countries and in 2013, the Copernicus project (EU 2013b) that has the goal to make data public that stems from the European Space Agency on Earth Monitoring.
Open government data (also known as “public sector information”) is intended to be accessible by everyone, stored using open formats and under open licenses, and attracts multiple volunteer initiatives creating applications and adjacent data collection projects by the crowd. Thereby, the public sector, private companies, civil society and citizens are involved (Jetzek, Avital, and Bjørn-Andersen 2013).
Examples for created artifacts are visualizations, apps and derived new insights to the existing data (Kuk and Davies 2011). The open government data must thereby be seen in the broader context of open data in general. According to the Open Knowledge Foundation (2017), open data is defined as data or “knowledge [that] is open if anyone is free to access, use, modify, and share it — subject, at most, to measures that preserve provenance and openness”. However, the focus of this paper is to investigate open government data and its use for predictive analytics.
The total economic value of published open data in Europe is estimated to be between € 27 billion (Dekkers et al. 2006) and € 140 billion (Vickery 2011). These potential values are high, but the actual value for companies is questionable, since open data in itself creates only value when it is used further (Immonen et al. 2014; Janssen et al. 2012). The first research questions that we aim to answer in this study is therefore:
RQ 1: To what extent can open government statistical data improve the predictive power of machine learning IS artifacts in the specific yet important case of identifying household characteristics of utility customers?
The second aspect of our research is to test the transferability of predictive analytics by means of the present case from the utility industry. This aspect is important for companies operating multi-national and want to overcome the creation of predictive machine learning models for each regional division.
Furthermore, models for business and academia must be general to a large extent, being able to universalize findings using business analytics and machine learning. Building such models is sophisticated (Shmueli and Koppius 2011), and multiple activities are associated with the data collection (i.e., through customer surveys), insight generation from the data (including data preparation and cleaning, model generation and tuning), transforming the insights to decisions and to create business value through correct decisions (Sharma et al. 2014). Especially the step of rising data is problematic:
customer surveys suffer from low response rates, the nonresponse bias (Groves 2006) and fraudulent
answers (Bohannon 2016; Kuriakose and Robbins 2015). Moreover, Müller et al. (2016) state that models
in (big) data analytics are often built for one specific dataset and provide therefore “little theoretical
contribution, but are also vulnerable to changes and anomalies in the underlying data”. Therefore, the
aspect of model transferability relevant, but only sparsely addressed by related studies.
Therefore, we aim to answer the following second research question:
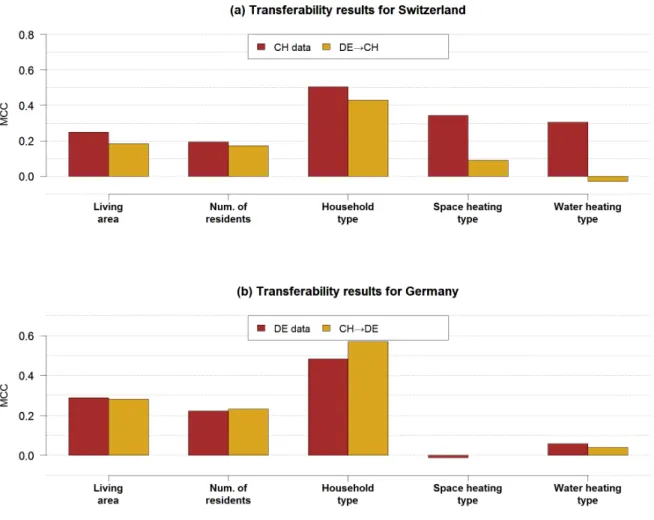
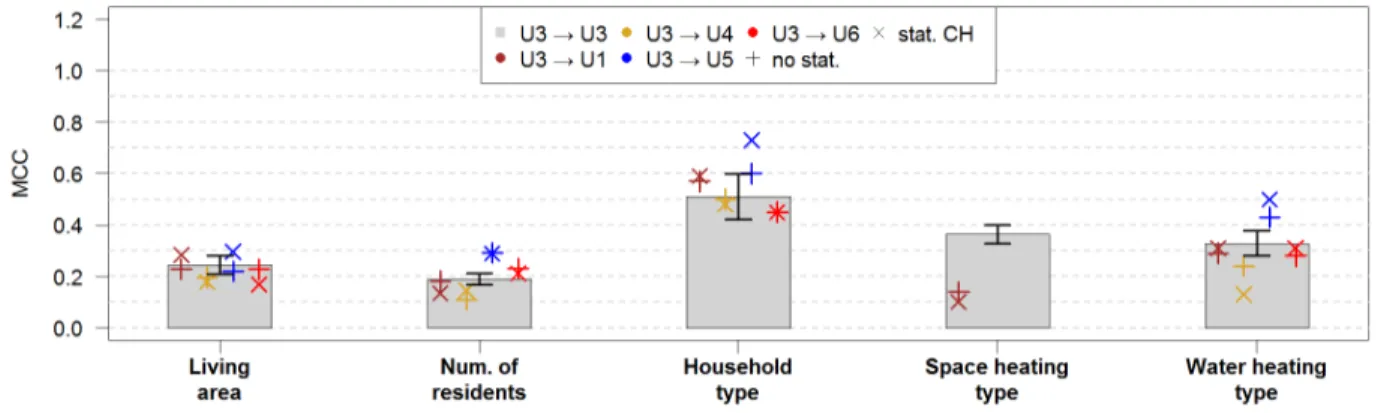
RQ 2: To what extent can a predictive IS artifact that has been trained on data from customers located in one geographic region be used to classify customers located in another geographic region?
This question is further operationalized by the following additional two subordinate research questions:
RQ 2.1: How does the classification quality change, when a predictive model that was trained with customers from one utility company is applied to customers of other utility companies?
RQ 2.2: To what extent can open government statistical data improve the transferability of classification models between companies?
Related Works and Contribution to Theory
This section gives a brief summary of the related research regarding the prediction of household characteristics for energy customers based on data that is available to energy utilities (i.e., customer core data, energy consumption and other data sources), the research related to open government data and the geographical transferability of predictive models.
Several studies exist that infer household characteristics (e.g., size and type of the residency, number of persons in the household, heating type and age) from electricity consumption data that is collected by utilities for order processing and invoicing. This data stems either from conventional meters that are typically read out once a year, or from connected smart meters that send the readings to the utility in up to 15-min intervals. To the best of our knowledge, the first study on household classification was done by Beckel et al. (2013, 2014) who showed the principal feasibility to obtain household characteristics from 30-min smart meter data using predictive machine learning artifacts. In recent studies, we suggested several improvements to this work (Hopf et al. 2014) and adapted the approach to 15-min smart meter data and showed that even purchase interest in a product (solar installations) is possible (Sodenkamp et al. 2017). Since the dissemination of smart meters is currently stumbled in many countries and due to privacy regulations, energy retailers have not always access to fine-grained energy consumption data.
Therefore, the development of such artifacts based on annual energy consumption data still remains a relevant task. In a recent work, we developed such a predictive artifact on the base of annual electricity consumption data in combination with free available geographic data (Hopf et al. 2016) and tested it with a dataset from a utility company in Switzerland with 3.986 customers. This artifact in an extended version is used to answer our research question in this paper.
Multiple studies from the IS field conceptualize the open data phenomenon in general and investigate its characteristics (Chatfield et al. 2015; Janssen et al. 2012; Jetzek, Avital, and Bøjrn-Andersen 2013;
Kalampokis et al. 2011; Marton et al. 2013; Ponte 2015). Other studies focus on the diffusion and adoption of open data in organizations (Alanazi and Chatfield 2012; Gil-Garcia et al. 2007; Ham et al. 2015;
Immonen et al. 2014; Maccani et al. 2015, 2017; Oliveira and Santos 2016). Besides that, multiple case studies have been published that describe the application of open data, for instance in recommender systems for products (Heitmann and Hayes 2010; Pham and Jung 2014), for sustainable mobility projects (Yadav et al. 2017), or the forecasting of electrical load (Vercamer et al. 2016). However, the only quantitative study about the value of open government data that we found is that of Jetzek, Avital, and Bøjrn-Andersen (2013), who investigated how open government data can stimulate value generation (in terms of social welfare) based on macro-economic data from 61 countries. The actual value of open government data for companies (e.g., by using the data in business analytics) remains, however, open and is therefore subject of the research presented in this paper.
Transferability of predictive models have been investigated in studies from the field of geography (e.g., Vanreusel et al. 2007; Wenger and Olden 2012), recreation demand (Loomis et al. 1995), forecasting of travel demand for transportation planning (Everett 2009; Sikder et al. 2013) or accident prediction (Sawalha and Sayed 2006). An evaluation of the geographic transferability of predictive models in customer data analytics was – to the best of our knowledge – not subject to existing research.
With this study, we ultimately aim to contribute three distinct features to the body of knowledge related to
predictive analytics IS. First, this research empirically evaluates the quality and validity of an existing
predictive IS artifact and helps thereby to lay the grounding for future development of design principles for such systems. Second, this research provides descriptive insights on predictive analytics that are already considered as an important toolset for IS research (Shmueli and Koppius 2011). Third, we see our research as a relevant step to develop a theory on the value of different data sources (here: open government data) in business analytics applications by using predictive IS artifacts.
Predictive Customer Data Analytics in the Utility Industry
The subject of our study is a predictive customer data analytics (machine learning) IS artifact that is used to identify household characteristics (e.g., size and type of the dwelling, number of residents, type of heating) from private customers for targeted marketing or energy efficiency campaigns. The artifact is schematically illustrated in Figure 1. The technical implementation of the artifact used in this work, stems from a previous study (Hopf et al. 2016) and was extended to answer the stated research questions.
Figure 1: Predictive customer data analytics IS artifact that predicts household characteristics
As input, four data sources have been considered: A) Annual electricity consumption data and B) household location information (i.e., the address of the household); both items of information are known to utility companies due to order fulfillment and billing purpose. The geographic data (C) and statistical data (D) can be obtained by the company through public data sources. The resulting outputs of the IS artifact are predicted household classes: the type of the household (apartment or house), the number of residents (1, 2, 3-5, or more than 5), the type of heating system, etc. For model building (training) and performance evaluation (test), ground truth data is needed that is usually obtained using customer surveys.
For the implementation of the predictive artifact, we used the statistical programming environment R and the open-source packages “randomforest” (Liaw and Wiener 2002) for classification and “caret” (Wing et al. 2015) for sampling and cross-validation. Implementation details on the features from statistical data are provided later in this paper.
Dataset
For our analysis, a dataset on 7,504 residential customers from seven utility companies in Switzerland
and Germany (see Table 1) was provided by our research partner BEN Energy AG, Zurich (Switzerland).
For each customer, the annual electricity consumption and pseudonymized address data is known from the companies’ core database. Additionally, we have access to survey results on household characteristics (number of persons in the household, living area, heating type, etc.) that were obtained via an online customer portal.
Data subset name CH DE
Location Switzerland Germany
Number of customers with survey responses 5,446 2,058
Number of customers that are usable for analysis Reasons for exclusions are:
1) address-conversion to geo-coordinates not possible 2) less than 100 consumption days or less than three years
5,020 1,843
Number of utility companies 6 1
Timespan of the electricity consumption 2009 – 2014 2009 – 2016 Table 1: Characteristics of the dataset: regional distribution and excluded data
Dependent Variables: Household Properties
Household properties are the dependent variables in the considered prediction model. The information on household properties for all customers have been obtained through surveys on an online customer engagement portal that aims to motivate energy-efficient behavior (Graml et al. 2011). The portals are provided by our research partner as software-as-a-service solutions for utility companies and have been individually branded for each utility. Therefore, the survey data is comparable for all utility companies.
For the property ‘living area’ and ‘number of residents’, customers can insert integer values. We split the classes for these properties according to previous research (Hopf et al. 2016). For the properties
‘household type’, ‘space heating type’ and ‘water heating type’, the class labels have been taken directly from the survey results. The household properties and classes are listed in Table 2, together with the absolute and relative distribution in both countries.
Property Class Class sizes (absolute and relative)
CH DE
1 Living area ≤ 95 m
21,059 21,10% 623 33,80%
≤ 145 m
21,852 36,91% 748 40,59%
> 145 m
22,107 41,99% 472 25,61%
2 Number of residents 1 612 12,26% 354 19,23%
2 2,004 40,14% 653 35,47%
3-5 2,251 45,09% 808 43,89%
> 5 125 2,50% 26 1,41%
3 Household type house 2,228 44,38% 863 46,88%
apartment 2,792 55,62% 978 53,12%
4 Space heating type electric 781 15,65% 39 2,12%
not electric 4,210 84,35% 1,801 97,88%
5 Water heating type electric 2,431 50,03% 187 10,49%
not electric 2,428 49,97% 1,596 89,51%
Table 2: Household properties with class labels and the distribution in both countries
Explanatory Variables (Features)
The input data is reduced to a small set of expressive features. Since the focus of this work is the
evaluation of the transferability of predictive models and the test of statistical data to improve the model
performance, we use empirically defined features on electricity consumption and geographic information
from previous research on similar problems (Hopf et al. 2016; Sodenkamp et al. 2015), where detailed
motivation on these features is given.
Three features are used to describe electricity consumption and household location data:
• Logarithmic annual consumption, normalized by the days in which the energy was consumed
• Consumption trend as the relative change between the consumption of different years, obtained with a linear regression model that uses the normalized consumption of each year as dependent variable and the number of the respective year as the independent variable.
• Neighborhood comparison as the Z-score of the household’s logarithmized normalized consumption deviation from its neighborhood (in the postal code region).
Using the address information of one household, we obtained 66 features from the free geographic database OpenStreetMap. The calculated values can be subsumed under four categories:
• Features on the topology: describing the structure of and relations between one household and spatial neighbors (e.g. lon./lat., frequency objects in the surroundings, distance to city center)
• Features on landmarks and points of interests: describe the meaning of an object within the spatial context it appears (frequency, distance, and other measures to sights, shops, cafes, etc.)
• Features about buildings (e.g. mean/variance of the surface area, the distance to buildings, and the type of buildings in the surrounding)
• Features about land use (land use type embracing the household, area distribution in different land use types, etc.)
Random Forest Classification Model
The core of the studied predictive IS artifact is a Random Forest (Breiman 2001) classifier. The working principle of this supervised learning algorithm is that it generates several (in our instance 500) uncorrelated decision trees based on the training data and forms a predictive model based on the best decision trees.
In fact, there are hundreds of supervised machine learning algorithms that could also be used for the problem, but the Random Forest algorithm showed good performance in previous studies from the energy data analytics field (Hopf et al. 2016; Sodenkamp et al. 2017). Besides that, in a comprehensive study, Fernández-Delgato et al. (2014) tested 179 classifiers from 17 algorithm families and come to the conclusion that random forest or its variants are most likely to be the bests currently known classifier.
One can argue that such ‘black box’ classification algorithms are largely incomprehensible (Martens and Provost 2014) and so, the interpretation of the functional principle cannot fully be done (Müller et al.
2016), but our goal in this paper is to draw conclusions on the value of statistical data for exactly such classification models and the regional transferability of such algorithms. From a theoretical point of view, it seems to be better, to use more explanatory mathematical models (such as logistic regression), but it is questionable whether the results would also be valid for state of the art classification algorithms.
Furthermore, we explicitly do not test multiple classification algorithms or tune the classifier’s parameters, since we do not aim to find the “best model that works for our case”, but we want to derive statements on transferability and the value of statistical data.
Performance Assessment Using Matthews Correlation Coefficient (MCC)
We assess the classification performance by comparing the predictions made by the classification model with the ground truth data and calculate the classification performance. There are multiple classification performance metrics, which all have advantages and drawbacks. The widely used accuracy (measuring the percentage of correct classified examples), for example, is easy to interpret, but it is known that accuracy is influenced by the relative class sizes (Baldi et al. 2000) and therefore unsuitable for our case.
Other measures, such as precision and recall, or measures associated with the Receiver Operating Characteristic (ROC) curve (Fawcett 2006) are only applicable for binary classification problems.
Therefore, we opt to assess the classification quality using Matthews Correlation Coefficient (MCC). This
correlation coefficient quantifies the association between the observed 𝑋 and predicted 𝑌 class
memberships of examples. In the case of binary classification problem, it is equal with the phi statistic (Cramer 1946). We use MCC definition for multiclass problems (Gorodkin 2004; Jurman et al. 2012) relying on the covariance (cov):
𝑀𝐶𝐶 =
𝜙
'𝑓𝑜𝑟 𝑡𝑤𝑜 𝑐𝑙𝑎𝑠𝑠 𝑝𝑟𝑜𝑏𝑙𝑒𝑚𝑠 𝑐𝑜𝑣 𝑋, 𝑌
𝑐𝑜𝑣 𝑋, 𝑋 ∗ 𝑐𝑜𝑣 𝑌, 𝑌 𝑓𝑜𝑟 𝑛 𝑐𝑙𝑎𝑠𝑠 𝑝𝑟𝑜𝑏𝑙𝑒𝑚𝑠
MCC can take values between -1 and 1, where 0 represents random classification, 1 indicates the ideal classification, and -1 is the total disagreement between the predictions and real observations.
For a methodologically correct estimation of the model performance (Hastie et al. 2009, Chap. 7; Shmueli and Koppius 2011), we use 10-fold cross-validation, whenever possible, to calculate the MCC results and avoid selection bias in splitting the data randomly into datasets for training and test. With this approach, the data is split into 10 parts of equal size (folds) and classification MCC estimation is replicated 10 times, where each time another fold is used as test data.
Value of Government Statistical Data for the Use in Predictive Customer Data Analytics
In this part of our work, we evaluate government statistical data for its use in predictive customer data analytics. First, we give an overview to government statistical in Germany, Switzerland and the EU, identify statistics that are household-related, define features from the statistical data, and present an approach to connect the statistical features with customer data in organizations. Second, we assess the overall value of the connected statistical data using our predictive analytics IS artifact and give the answer to RQ 1.
Government Statistical Datasets for Predictive Customer Analytics
For the identification of government statistical datasets in our study area covering Germany and Switzerland, we thoroughly studied the web-catalogs of all existing statistical offices. Each officially published statistical dataset contains figures for one specific statistical geographic region (SGR) that is identified by a unique number. In Germany, federal and state statistical offices exist. The Federal Statistical Office (FSO) offers data for SGRs on the level of German states, which is too coarse for business analytics on individual households. Besides that, statistical data is offered by the joint database of German state statistical offices
1that contains data for SGRs on the level of down to single municipalities. In Switzerland, statistical data is provided by the FSO of Switzerland
2. The statistical office of the EU
3, Eurostat, aggregates data from the EU administration, it’s member states and associated states, such as Switzerland. Most of the data has a national level of detail, but some datasets also have the level of smaller SGRs.
All data catalogs are structured differently, so that an easy mapping of statistical datasets was not possible. According to our goal to find datasets that are usable for predictive analytics in the utility industry, we defined four groups of statistics and categorized the datasets as follows:
Category A: Statistics we identified to be helpful for predictive customer data analytics:
• Housing, number of rooms, usage of real estate
• Population statistics including the population density, age, sex, migration
• Number of businesses (small, medium, large) and economic development (GDP in the region)
1 http://www.statistikportal.de/Statistik-Portal/en/, last access 28.11.2016 2 https://www.bfs.admin.ch/bfs/en/home.html, last access 28.11.2016 3 http://ec.europa.eu/eurostat/home, last access 28.11.2016
Category B: Statistics that are relevant, but have a low geographical granularity:
• Tourism (e.g., arrivals and nights spent at tourist accommodation)
• Health (e.g., health personnel and beds, discharges and hospital days of in-patients)
• Education (e.g., pupils and students by enrolment)
• Research and development (e.g., R&D expenditures, employment in high-tech sector)
Category C: Statistics containing information not immediately related to household customers
• Territory (e.g., sizes of territories and number of municipalities by county)
• Civil register (e.g., marriages, births and deaths in an area, adoption)
• Agricultural economics (e.g., plantings, agricultural businesses, forestry, wood harvest)
• Economy and markets (e.g., bankruptcy, paid insurance output, money growth)
• Employment (e.g., employees in the public sector)
• Energy (e.g., national energy import and export, coal plants and nuclear plants)
• Traffic (e.g., accidents, agricultural vehicles, cars and trucks)
Category D: Statistics that are not available in all countries or the content of the statistics is different in the respective countries so that the data is not comparable
• Politics (e.g., elections and referendums)
• Ethics and religion
• State finances and taxes
Only the statistics in Category A are applicable for predictive analytics in the utility industry. We list them in Table 4, highlight the data source and define three types of features from the statistical datasets:
relative frequencies (rf.*), absolute frequencies (num.*) and averages (mean.*). If the data was given in several intervals (e.g., age of houses), the mean was calculated as the weighted average using the mean of each interval.
The data available for both countries is sparse, since most datasets are available either for Germany or for Switzerland. In fact, only the features rf.male, num.residents, mean.residentialAge, num.migration, mean.HouseAge, rf.newHouses and mean.NumRooms are available for both countries.
The final step that needs to be taken to make government statistical data usable for data analytics in companies, is to connect the statistical data to the customer data. The statistical data is associated to specific SGRs and the definition of the SGRs differs for each statistical office, but mostly the political borders of municipalities, districts or states are used.
One way to integrate statistical data into the customer database is to simply use tables that are prepared
and published by the statistical offices containing a matching criterion for customer data (e.g., the city
name, postal code, or the geo-reference of one point in this SGR). We identified three major problems of
this matching approach: 1) using the postal code or the city name as matching criterion, customers cannot
be uniquely assigned to the SGR, since the spatial extend of postal code regions or cities do not fully
overlap with the SGR borders defined by statistical offices; 2) spelling errors in city names cause serious
problems; 3) when a specific geographical point for each SGR is provided by the statistical office (e.g.,
geo-coordinates of the administrative center), the household cannot be assigned to the SGR by using
shortest-distance to this point, since the location of the given point is arbitrary and must not be the
geometric center of the statistical unit.
Category EU DE CH Description Feature Name building-
statistics
Xa X Frequency of single family homes rf.singleFamilyHome
Xa X Frequency of multiple family homes rf.multipleFamilyHome
X Frequency of residential homes with ancillary use rf.residentialHome WithAncillaryUse X Frequency of houses with partial residential use rf.housePartlyResidential
X X Average house age mean.HouseAge
X X Share of new houses rf.NewHouses
X Number of residents which hold a share or are owner of the building they live in in the region
rf.homeOwners
X X Average number of rooms per apartment mean.NumRooms
Xa Amount of buildings with one apartment rf.oneDwellingBuildings
Xa Amount of buildings with two apartments rf.twoDwellingBuildings Xa Amount of buildings with three or more apartments rf.threeOrMoreDwelling-
Buildings Xa Amount of buildings that are not used for residential purposes rf.nonResidential-
Buildings socio-
demographics
X X X Amount of male population in % rf.male
X Amount of permanent residents rf.permResidentials
X X X Average age of permanent residents mean.ResidentialAge
X X Quantity of permanent residents num.permResidents
X X X Difference of immigration and emigration num.migration X X X Quantity of total residents (permanent and non-permanent) num.residents economic Xb X Amount of businesses that have 0 employees rf.zeroEmployee-
Businesses Xb X X Amount of businesses with 0-9 employees rf.smallBusinesses
X X Amount of businesses with 10-250 employees rf.mediumBusinesses X X Amount of businesses with 250 and more employees rf.bigBusinesses
Xb X Quantity of GDP in Euro per citizen num.gdpEuroPerCitizen
X Relative frequency of investments in buildings by the public sector
rf.publicInvest
X Relative frequency of investments in new buildings instead of renovation
rf.newInvest
Table 4: Statistics that have been identified as meaningful for predictive customer analytics (a = no or incomplete data for Germany, b = no or incomplete data for Switzerland)
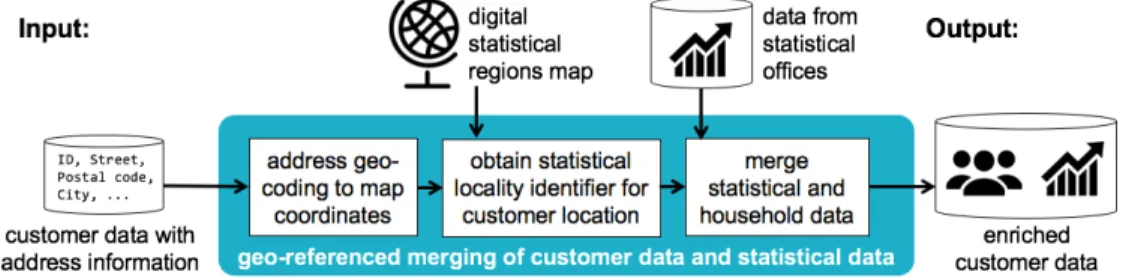
Therefore, we developed a methodology for geo-referenced data integration of customer core data and statistical datasets, that we illustrate in Figure 2. The first step in this approach is the conversion of customer addresses into geo-coordinates. This can be done involving an online service provider. In the second step, the SGR for each customer location is determined. For that, we loaded the digital maps published by respective governmental institutions in standardized formats (i.e., Swiss federal statistical office
4, German federal agency for cartography and geodesy
5and Eurostat
6) and obtained the identifier for
4 https://www.bfs.admin.ch/bfs/de/home/dienstleistungen/geostat.html, last access 28.11.2016
5 http://www.geodatenzentrum.de/geodaten/gdz_rahmen.gdz_div, last access 28.11.2016
6 http://ec.europa.eu/eurostat/web/gisco/geodata/reference-data/administrative-units-statistical-units, last access 28.11.2016