Lehmann and Kessler: Accurate quantification of cholesterol by stable Isotope dilution and field desorption mass spectrometry 893 J. Clin. Chem. Clin. Biochem.
Vol. 20,1982, pp. 893-898
Accurate Quantification of Nonesterified and Total Cholesterol in Plasma and Urine
from Crude Lipid Extracts by Stable Isotope Dilution and Field Desorption Mass Spectrometry By W. D. Lehmann and M. Kessler
Abteilung Medizinische Biochemie, Institut ßr Physiologische Chemie, Universitäts-Krankenhaus-Eppendorf, Hamburg
(Received March 11/July l, 1982)
Summary: Levels of free and total cholesterol were quantified in control sera and human urine using [
2H
7]choles- terol or [
13C2]cholesterol äs internal Standard and field desorption mass spectrometry for the quantification. These analyses are performed using a crude Chloroform extract without Chromatographie Separation of the constituents.
Due to the^extremely soft ionization conditions in field desorption, the constituents of the crude lipid extract pre- dominantly form molecular ion species and only a vefy low amount of fragment ions of low relative abundance thus minimizing the possibility of ion overlap in the mass spectrum. Mass spectrometric quantification of choles- terol in two control sera resulted in data within the ränge of assigned concentrations. The Standard deviations of the mass spectrometric data were around ±2%. Generally, 50 jul of serum or plasma or 500 of urine are extracted and the mass spectrometric quantification performed using an aliquot of 2—10%. A characteristic pattern of intact choles- teryl esters is also obtained.
Quantifizierung von freiem und Gesamt-Cholesterin in Plasma und Urin aus rohen Lipid-Extrakten mit Stäbil-Isotopenverdünnung und Felddesorptions-Massenspektrometrie
Zusammenfassung: Freies Cholesterin und Gesamtcholesterin wurden in Kontrollseren und in Urin mit Felddesorp- tions-Massenspektrometrie und [
2H
7]Cholesterin oder [
13C
2]Cholesterin als internem Standard quantifiziert. Diese Bestimmungen werden mit einem rohen Chloroform-Extrakt ohne chromatographische Auftrennung der Bestand- teile durchgeführt. Aufgrund der extrem schonenden lonisierungsbedingungen bei der Feiddesorption bilden die Komponenten des Lipidexträktes überwiegend Molekülionen und nur wenige Fragmentionen von geringer relativer Häufigkeit, so daß die Wahrscheinlichkeit des Überlagems von lonensignalen minimiert ist. Die massenspektrome- trische Quantifizierung von Cholesterin in zwei Kpntrqllseren ergab Werte innerhalb des Vertrauensbereiches der Sollwerte. Die Standardabweichung der massenspektrometrischen Daten ist etwa ±2%. Typischerweise werden 50 Serum oder Plasma oder 500 Urin extrahiert und die massenspektrometrische Bestimmung wird mit einem 2^-10% Aliquot des Gesamtextraktes durchgeführt. Ein charakteristisches Muster der intakten Cholesterinester wird ebenfalls erhalten.
Introduction ionization conditions in field desorption make this tech- Assäys based oii Isotope düution and mass spectrometry nique uniquely suited for qualitative and quantitative play an important role among recömmended and cancM- mixture analysis since a variety of low molecular bio- date reference methpds in clinical chemistry (1—6). For chemicals predominantly form molecular or quasi- orgänic compounds generally a combination of derivatiza- moleciüar ion species under the conditions of field tion, gas chromatography and selected ion monitoring desorption mass spectrometry (e.g. I.e. (7)) in the in- mass .spectrometry in the eleetron impact modfe is vestigations of purified compounds äs well äs in the emplöyed in these reference methods. analysis of complex mixtures. In the following it is
shown that the high specificity of the analytical proce- In this study, a different approach was chosen based on dure emplöyed enables a fast and accurate quantification the high specificity of both stable isotope dilution and of total and free cholesterol in crude lipid extracts from field desorption inäss spectrometry. The extremely soft human body fluids.
0340-076X/82/0020-0893S02.00
• © by Walter de Gruyter & Co. · Berlin · New York
Materials and Methods Chemicals
Methanol, ethanol, and Chloroform (zur Rückstandsanalyse) were purchased from Merck, Darmstadt, FRG. Cholesterol SRM 911a was purchased from National Bureau of Standards, Washington, USA. 3,4-[13C2]Cholesterol (90 &tom% 13C) was obtained from KOR Isotopes, Cambridge, Mass., USA; its molec- ular ion pattern was determined to be äs follows: [ 13CoJ: 5.8%;
[13CiJ: 12.6%; [13C21: 100%; (13C31: 28.3%; [*3C4]: 4.1%;
l13Cs): 0.4%. [2H7]Cholesterol was a generous gift of G. v.
Unruh, Medizinische Universitätsklinik, Bonn, FRG. The label distribution of this compound was determined to be [2Hsl 0.7%, ['2H6J 3.3%, [2H71 95.7%, corresponding to 99.7 atom%
deuterium in the isopropyl side-chain hydrogen positions.
Control sera
Control serum 1: Precilip E. L. lot 1-305/2-305/3-305/4-305 from Boehringer Mannheim GmbH, FRG. Control serum 2:
product no. R-3626-S, lot no. 51F6113 from Sigma, St. Louis, USA.
Extraction procedure
Initially plasma samples were extracted according to Folch et al.
(8) or using pure Chloroform. For both procedures cholesterol concentrations determined by isotope dilution and mass spectro- metry were identical within the precision of the method. On this basis we preferred to use an extraction with Chloroform alone which was performed äs follows: 50 of plasma or 500 of urine to which an appropriate amount of internal Standard had been added were extracted two times with l ml of Chloroform.
For each Step, sample and solvent were vortexed thoroughly, centrifuged for about 3 min at 3000 min"1, and the Chloroform phase removed. The Chloroform phases were combined and dried under a stream of nitrogen. The residue was redissolved in 50 \ of methylene Chloride and this solution was used for mass spec- trometry.
Quantitative hydrolysis of cholesterol esters was performed ac- cording to.a published procedure (5): l ml ethanol and 100 aqueous KOH (6 mol/1) are added to 50 of plasma. This mix- ture is kept at + 60 °C for l h and after cooling to room tempera- ture it is extracted äs described above. Urinary cholesterol esters were hydrolysed by addition of 2.5 ml of aqueous KOH (6 mol/1) to 500 of sample. This mixture is incubated for l h at 60 °C, cooled to room temperature, and then extracted äs the non- hydrolysed sample.
Mass spectrometry
Mass spectrometry was performed on a double focusing Instru- ment type Vacuum Generators ZAB-1F in the field desorption mode. High temperature activated carbon emitters (9) prepared on a Vacuum Generators activator by a resistance controlled activation procedure (10) were used for all measurements. The average needle length of the emitter carbon micro-needles was 30 . The mass spectra were recorded electrically in the double- focusing mode at the minimal adjustable resolution of about 500-700. The multiplier Signals were fed into a multichannel analyzer type Canberra series 80 via a digitizer model Canberra 6271. The spectra were accumulated using repetitive magnetic scans of the mass spectrometer whieh triggered the multichannel analyzer sweeps. Typical data for the accumulation of selected sections of mass spectra are a dwell time of l ms per channel and the use of 2K channels of the total 8K memory of the multichannel analyzer. Digital read outs of peak heights were used äs the basis for quantitative determinations. The mass spectra were documented using a graphic plotter (Hewlett- Packard 7225 A). The sample Solutions were applied to the field desorption emitter by a microliter syringe under stereomicroscope control at a magnification of 63X. For a single analysis a 2-10%
aliquot of the total lipid extract from 50 plasma or 500 of urine was used.
Results and Discussion
A crude lipid extract from human plasma contäins the five main classes of plasma lipids, namely free fatty acids, free cholesterol, cholesterol esters, phospholipids, and tr>
glycerides. In the sequence qf listing, the?e lipids show increasing moleculär weights, the single classes of com- pounds covering fairly well separated mass regions. Thus, in the analysis of a complex mixture contairiing these classes of lipids by mass spectrometry combined with a soft mode of ionization, such äs field desorption, very little interference from the värious moleculär ion species is to be expected.
In fact, investigation of a crude Chloroform extract from plasma by FD MS shows few prominent ion groups. For instance, the oidy strong signal occurring in the mass region between about m/z 350 to m/z 600 is found at m/z 386 representing the moleculär ion of cholesterol.
Except for the Signals due to the natural isotopic pattem of cholesterol, the background Signals on the high mass side of the moleculär ion are in the order of 0.2^0.4%
relative äbundance, äs can be derived from the mass spectrum in figure l. The spectfum was recorded iri the ränge of heating currents which correspond to optimal desorption of cholesterol.
"m/z 386[
HO
m/z 393
»16
m/z
Fig. 1. Partial field desorption mass spectrum of a crude plasma lipid extract showing the moleculär ion of nonesterified cholesterol. 160 Sweeps were accumulated at 14-16 mA emitter heating curreht.
The low level of interfering ioris near the moleculär ion of cholesterol allows the addition of isotppicälly labelled analogues äs internal Standards for accurate quantifica^
tions (11-13). In addition, a control of the isotopic abundances of the chotesterol molecular ion:,pattern äs shown in table l excludes ä rneasurable overlapping of öther compounds at the mass values 386,387, and 388.
The minor Signals at m/z 385 and 384 äre due to the absträction of öne or two hydrogen atoms by surface reactions on the FD emitter. „ s
J. din, Chem. Clin. Biochem. / Vol. 20,1982 / No. 12
Lehmann and Kessler: Accurate quantification of cholesterol by stable isotope dilution and field desorption mass spectrometry 895
The data in table l also show that the precision of the
isotope abundance determinations by field desorption mass spectrometry in this case is not sufficient to con- firm the presence of small amounts of dihydrochol- esterol, the plasma concentration of which is reported to be on average 0.7% of the cholesterol concentration (14). In the isotopic pattern of plasma cholesterol the abundance of the Signal at m/z 388 appears to be slightly enhanced over the calculated value; however, a similar deviation is observed in the molecular ion pattern of authentic pure cholesterol.
Tab. 1. Comparison of calculated and experimentally observed isotopic abundances of cholesterol.
l 5
t/i
12'S
Relative intensity
m/z 386 (%) m/z 387 (%) m/z 388 (%)
Calculated
10030.95 4.82
Experimental, puiecholesterol 10031.4 ± 0.5
5.6 ± 0.6
Experimental, plasma cholesterol 10031.5 ± 0.6
5.4 ± 0.4
Both deuterated and
13C-labelled cholesterol were available äs internal Standards. With respect to similarity in physico-chemical properties, the
13C-läbelled compound is to be preferred, äs it is characterized by even smaller differences from the riaturally occurring cholesterol than is the deuterated compound. On the other hand, the molecular ion group of [
2H7]cholesterol is completely separated from the group of endogenous cholesterol, whereas the pattem of [
13C
2]cholesterol shows a signifi- cant amount of overlap with the ion Signals of the non- läbelled compound. Thus, the use of the heptadeuterated analogue allows a more simple quantitative evaluation of the mass spectra.
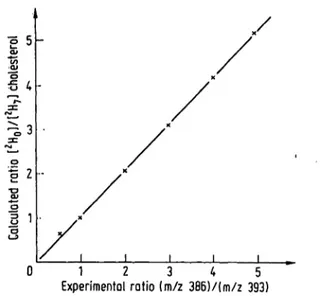
To verify the suitability of these Standards for quantita- tive measurements, calibration curves covering the con- centration ratios of üiterest were establlshed. Reference cholesterol with a specified purity of 99.8 ± 0.1% was used for preparation öf Standard Solutions of nonlabelled mäteriäl. For each quantitative detenriination the com- plete desorption pf the sample was accumulated to cpm- pensate possible isotope effects during desorption espe- cially för the mixtures contaüiing the heptadeuterated compound (15). Figure 2 shöws the calibration curve obtained for the üse öf [
2H
7]cholesterol äs internal Stand-
ard-As expected, the calibrätion eurve iii figure 2 shows a linear relatiön between peak heights and molar concentra- tions with a correlation cpefflciertt very close to ünity and a zero intercept, because the ion groups are completely separated· from each other.
In the investigations of calibration mixtures containing the [
13C
2] labelled andogue an excellent agreement between calculated and experimentally observed isotopic patterns was also obtained. In this case, quantitative evaluation of the inixture pattems was performed by solving a System of linear equations taking into account the experimental
0 1 2 3 4 5
Experimentol rotio (m/z 386)/(m/z 393)
Fig. 2: Calibration curve for cholesterol quantification using [2H7]cholesterol äs internal Standard. For each quantifica- tion 300 sweeps were accumulated at 12-18 mA.
patterns of both sample and Standard plus the small and slightly variable amount of [M-H]* and [M-2H]
+forma- . tiori. With respect to these calibration mixtures, deuter- } ated and
13C4abelled cholesterol were found to be i equally well suited äs internal Standards for cholesterol
quantifications by FD MS. Arbitrarily, we used the [
2H
7]standard for plasma cholesterol determinations and the [
13C
2]standard for measurements of urinary chol- esterol.
In the investigations of plasma samples for free and total cholesterol, a significant difference was observed between hydrolysed and nonhydrolysed samples. This difference was found in the mass region where the loss of water from the protonated cholesterol occurred. Figure 3 illustrates this effect.
12 0][
m/z 386 m/z 369
,/ m/z 376
*]ü*JuuJU( JUuJJJ( .
m/z 368 /Z 369
m/z
Fig. 3. Molecular ion region of cholesterol produced by Held desorption mass spectrometry of a crude Chloroform extract from control serum 1; 200 sweeps were accumu- lated at 16-18 mA emitter heating cuirent:
a) after hydrolysis, 40 Standard solution added to 20 of serum;
b) without hydrolysis, 20 of Standard solution added to 50 of serum.
J. Clin. Chem. Clin. Biochem. / Vol. 20,1982 / No. 12
Tho ion Signals at m/z 386 and m/z 393 correspond to thc moleculax ions of endogenous cholesterol and of the heptadeuterated intenial Standard, respectively. The loss of watcr from the protonated molecules of cholesterol is observed with relative abundance of about 2% at m/z 369 and m/z 376 and the relative intensities of these fragment ions show the same intensity ratio äs the corresponding molecular species, äs can be seen in figure 3a. However, in figure 3b the group of fragment ions additionally shows thc prescnce of two Signals of roughly equal relative intensity of ca. 5% at m/z 368 and m/z 369, which do not originate from cholesterol. We found these ions to be due to the fragmentation of cholesterol esters, which are an important constituent of the lipid extract from nonhydrolysed samples. The quantitatively most impor- tant cholesterol ester in human plasma is cholesteryl linoleate (l 6) with an abundance of ca. 50% among the cholesterol fatty acid esters.
Inspection of the FD mass spectrum of authentic chol- esteryl linoleate at heating currents between 14 and
18 m A corresponding to optimal desorption of chol- esterol, revealed the formation of two fragment ions of about equal intensity at m/z 368 and m/z 369 with ca.
5% relative abundance; in addition, a fragment at m/z 386 is observed with about 2.5% relative intensity. Con- sequently, in quantifications of nonesterified cholesterol the ions in the mass region between m/z 360 and m/z 400 were accumulated and from the peak height at m/z 386 fifty percent of the peak height at m/z 368 was sub- tracted to compensate for the small amount of superposi- tion from the cholesterol ester fragment ion. In the in- vestigation of hydrolysed plasma samples the peak heights at m/z 386 and m/z 393 were used directly for the cal- culation of total cholesterol levels.
Table 2 summarizes the quantitative data obtained in the investigation of two control sera and gives a comparison with the assigned concentration data.
Tab. 2. Cholesterol levels in two control sera determincd by field desorption mass spectrometry and comparison with assigned values.
Nonesterified cholesterol
Enzymatic2) Control serum l 1.39 ± 0.03 mmol/13) 1.47 ± 0.20 mmoi/1
Field desorption mass spectrometry1)
Total cholesterol
Control serum l Control serum 2
Field desorption mass spectrometry 6.08 ±0.16 mmol/1 3.55 ± 0.08 mmol/1
Enzymatic4) 6.32 ± 0.62 mmol/1 3.575) mmol/1
*) average of 4 determinations
2) cholesterol oxidase/catalase without hydrolysis
3) error limits correspond to ± 2 sigma
) cholesterol oxidase/catalase with enzymatic hydrolysis
5) no error limits specified
All data produced by mass spectrometric quantification are within the error limits of the assigned values of the control sera. The mass spectrometric data are character- ized by Standard deviations of around 12% for a single determination. This is a common value for the employed isotope dilution methodology and a sigmficantly higher precision than that observed in the enzymatic routine test. Moreover, due to the high specificity of the mass spectrometric detection and due to the principle of inter- nal standardization using a stable isotope labelled
analogue, the quantitative data produced by this method- ology are also characterized by a high accuracy.
Plasma cholesterol esters
Besides nonesterified cholesterol, a crude Chloroform extract of nonhydrolysed human plasma also contains the variety of intact cholesterol fatty acid esters. There- fore, the FD mass spectrum of this extract shows a characteristic pattern öf the molecular ions of these esters which is displäyed in figure 4.
[ (18:2) m/z 648
R-0
m/z 620 ( (16:0)
m/z 624 .[M (20:4)1*
m/z 67?
m/z
Fig. 4. Field desorption mass spectrum of plasma cholesteryl esters containing long chain fatty aeids; 100 sweeps were accumulated at 16-20 mA emitter heating current.
Except for the small group of ions around m/z 620 which are tentatively assigned äs molecular ions of diglycerides or äs fragment ions of triglycerides, the spectrum in figure 4 shows the molecular ions of cholesterol esters. The most prominent Signal is found at m/z 648 corresponding to the molecular ion pf cholesteryl linoleate, which is the most abundant plasma cholesterol ester. In the pattern around this ion the presence of minor amounts of the linolenate and oleate esters is further indicated by the Signal at m/z 646 and by the intensity of the ion at m/z 650 which is enhanced over the natural isotopic abundan'ce im the cholesteryl linoleate pattern.
In addition to this group of cholesterpl C18-esters small amounts of cholesteryl palmitate at m/z 624 and of cholesteryl arachidonate at m/z 672 aje found. The in-
J. Clin. Chem. Clin. Biochem. / Vol. 20,1982 / No. 12
Lehmann and Kessler: Accurate quantification of cholesterol by stable isotope dilution and field desoiption mass spectrometry 897 tensities of the molecular ion Signals of the cholesterol
esters in figure 4 are in rough quantitative agreement with the average data of the fatty acid distribution of human plasma cholesterol esters (16,17). The FD molec- ular ion pattern in figure 4 shows a good reproducibility,
but it does not directly provide quantitative Information because FD sensitivity differs significantly for the various types of cholesterol esters. For instance, FD sensitivity increases with increasing number of double bonds in cholesterol esters. Another fact hampering a straightfor- ward quantification of cholesterol long chain fatty acid esters is the lack of a commercial source of appropriately labelled cholesterol esters, such äs cholesteryl linoleate.
Urinary free and total cholesterol
Small amounts of cholesterol are also found in urine and they mainly originale from traces of mucous secretions.
Daily urinary cholesterol excretion is in the Order of l mg/24 h, and the correlation of enhanced values with a variety of diseased states has been attempted (e.g. Lc.
(l 8)). Whereas plasma levels of nonesterified and total cholesterol are characterized by a ratio of about 1:3, the corresponding ratio in urine is about l: l .2 (19).
We observed that urine levels of cholesterol, which normally are about three Orders of magnitude lower than plasma levels, can also be quantified by field desörption mass spectrometry using the same simple extraction procedure äs for plasma samples. The molecular ion pat- tern of cholesterol generated from these urinary extracts does not show a measurable superposition of interfering ions and therefore is identical to that given in figufe l and to the data in table l, respectively. In this case we used [13C2]cholesterOl äs internal Standard for the quanti- fications. Figure 5 shows the isotopic patterns obtained from two aliquots of a 24 h urine sample of an apparently healthy volunteer.
Comparison of the molecular ion groups in figures 5a and 5b clearly shows ä slightly enhanced level of cholesterol in the hydrolysed sample compared to the unpröcessed sample. Evaluation of the cholesterpl levels in these
samples gave an excretion of 0.32 mg/24 h for free and of 0.46 mg/24 h for total cholesterol. These values are within the ränge of normal values for cholesterol excre- tion determined for healthy controls by a gas Chromato- graphie method (19).
[%) [ m/z 386 \
m/z 388
m/z 386 \
Jl/U
m/z 388
L
m/z
Fig. 5. Quantification of urinary cholesterol using [13C2jchol- esterol äs internal Standard; 250 sweeps were accumulated at 14—16 mA emitter heating current.
a) without hydrolysis; b) after hydrolysis.
Conclusion
The resiilts show that field desörption mass spectrometry can be used for a fast and highly accurate quantification of free and total cholesterol in small samples of plasma and urine. Due to the outstanding specificity of the mass spectrometric ionization procedure employed, only a simple extraction Step and no Chromatographie purifica- tion of the extract is necessary. Being more expensive and more sophisticated than routine clinical chemical assays fqr chölesteröl quantification, this'method should preferentially be used in studies essentially requiring highly pjrecise and accurate quantitative data or in inves- tigations where only extremely small amounts of sample are available.
References
1. Moore, L. Jf. & Machten, L. A. (1972) Anal. Chem. 44, 2291-2296.
2. Björkhem, 1., Blomstrand, R. & Svensson, L. (1974) Clin.
Chim.Acta 54,185-193.
3. Siekmann, L., Hüskes, K. P. & Breuer, H. (1976) Fresenius Z. Anal. Chem. 279,145-146.
4. Gambert, P., Laljemant, C., Archambault, A., Maume, B. Fi
& Padieu, P. (1979) J. Chromatogr. 162,1-6.
5. Cohen, A., Hertz, H. S., Mandel, J., Paule, R. C, Schaffe?, R., Sniegoski, L. T., Sun, T., Welch, M. J. & White V, E.
(1980) Clin. Chem. 26, 854-860.
6. Schaffer, R., Sniegoski, L. T., Welclj, M. J., White V, E., Cohen, A., Hertz, H. S., Mandel, J., Paule, R. C, Svensson, L., Björkhem, I. & Blomstrand, R. (1982).Clin. Chem. 28, 5-8.
7. Schulten, H.-R. (1979) Int. J. Mass Spectrom. Ion Phys. 32, 97-283.
8. Folch, J., Lees, M. & Sloane Stanley, G. H. (1957) J. Biol.
Chem. 226, 497-509.
9. Schulten, H.-R. & Beckey, H. D. (1972) Org. Mass Spectrom.
5,885-895.
10. Lehmann, W. D. & Fischer, R. (1981) Anal. Chem. 53, 743-747.
11. Millard, B. J., Quantitative Mass Spectrometry, Heyden, London, 1978.
12. Lehmann, W. D. & Schulten, H.-R. (1978) Angew. Chem. 90, 233-250; Angew. Chem. Int. Ed. Engl. 17, 221-238.
13. DeLeenheer, A. P., Cruyl, A. A. (1980) in: Biochemical Applications of Mass Spectrometry (Waller, G. R. & Dermer, O. C., eds.) First Supplementary Volume, Wüey, New York, pp. 1169-1207.
J. Clin. Chem. Clin. Biöchem. / VoL 20,1982 / No. 12
14. Chattopadhyay, D. P. & Mosbach, E. H. (1965) Anal. Bio- 18. Acevedo, H. F., Campbell, ξ. Α., Frich, J. C. Jr., Meikow, L.
ehem. 10, 435-443. P·, Hayeslip; D. & Gilmore, J. (1975) Cancer 36,1459-1469, 15. Lehmann', W. D. & Schulten, H.-R. (1978) Biomed. Mass 19. J ngst, D., Walmer, J., Pickel, A., Stadtler, A., Eiermann,
Spectrom. 5, 208-214. W., Marx, F. J. & Karl, H. J. (1981) ίΟίη. Wochenschr. 59, 16. Schrade, W., Bohle, E., Biegler, R., Teicke, R. & Ullrich, B. 545-552.
(1960) Klin. Wochenschr. 38, 739-753.
17. Perkins, E. G., Hendren, D. J., Bauer, J. E. & El-Hamdy, A. Dr. Wf D. Lehmann
H. (1981) Lipids 16,609-613. · Abteilung Medizinische Biochemie ' Institut f r Physiologische Chemie Universit ts-Kiankenhaus-Eppendorf Martinistr. 52
D-2000 Hamburg 20
i
, Clin. Chem. Clin. Biochem. / Vol. 20,1982 / No. 12