RESEARCH PAPER
Quantification of diacylglycerol and triacylglycerol species in human fecal samples by flow injection Fourier transform mass spectrometry
Verena M. Ertl1&Marcus Höring1&Hans-Frieder Schött1&Christina Blücher1&Louise Kjølbæk2&Arne Astrup2&
Ralph Burkhardt1&Gerhard Liebisch1
Received: 6 November 2019 / Revised: 2 January 2020 / Accepted: 13 January 2020
#The Author(s) 2020
Abstract
The intestinal microbiome plays an important role in human health and disease and fecal materials reflect the microbial activity.
Thus, analysis of fecal metabolites provides insight in metabolic interactions between gut microbiota and host organism. In this work, we applied flow injection analysis coupled to Fourier transform mass spectrometry (FIA-FTMS) to identify and quantify lipid species in human fecal samples. Fecal homogenates were subjected to lipid extraction and analyzed by FIA-FTMS. The analysis of different subjects revealed a vast heterogeneity of lipid species abundance. The majority of samples displayed prominent signals of triacylglycerol (TG) and diacylglycerol (DG) species that could be verified by MS2 spectra. Therefore, we focused on the quantification of TG and DG. Method validation included limit of quantification, linearity, evaluation of matrix effects, recovery, and reproducibility. The validation experiments demonstrated the suitability of the method, with exception for approximately 10% of samples, where we observed coefficients of variation higher than 15%. Impaired reproducibility was related to sample inhomogeneity and could not be improved by additional sample preparation steps. Additionally, these exper- iments demonstrated that compared with aqueous samples, samples containing isopropanol showed higher amounts of DG, presumably due to lysis of bacteria and increased TG lipolysis. These effects were sample-specific and substantiate the high heterogeneity of fecal materials as well as the need for further evaluation of pre-analytic conditions. In summary, FIA-FTMS offers a fast and accurate tool to quantify DG and TG species and is suitable to provide insight into the fecal lipidome and its role in health and disease.
Keywords
Lipidomics . Microbiome . Feces . Triglyceride . Diglyceride . High-resolution mass spectrometry
Introduction
It is now generally accepted that the gastrointestinal system in particular the intestinal microbiome plays an important role in human health and disease [1]. Microbial activity is reflected in
fecal materials that contain unabsorbed metabolites including lipid species. Consequently, analysis of fecal metabolites pro- vides an estimate of metabolic interaction between gut micro- biota and host [2]. To identify subtle metabolic variations in- duced by dietary alterations and to characterize the metabolic impact of variations of the gut microbiota, metabolic profiling gained increasing interest over the last decade.
Feces are composed of water, proteins, bacterial biomass, fat, and indigestible food components, e.g., fibers. Fat contained in feces is a heterogeneous mixture of different lipids and constitutes 8–16% of the dry weight of feces [3–5] and 2–8% of wet weight [6–10]. Fat found within feces comes from bacteria as well as from the undigested remains of dietary lipids [11]. Approximately 60–70% represents non-/
esterified fatty acids; 20–30% is unsaponifiable material [12].
Human feces contain, depending on diet and metabolism, dif- ferent amounts of triacylglycerol (TG) and diacylglycerol (DG), which has been frequently studied in the context of steatorrhea [13] and colon cancer [14].
Published in the topical collectionCurrent Progress in Lipidomicswith guest editors Michal Holčapek, Gerhard Liebisch, and Kim Ekroos.
Electronic supplementary materialThe online version of this article (https://doi.org/10.1007/s00216-020-02416-y) contains supplementary material, which is available to authorized users.
* Gerhard Liebisch gerhard.liebisch@ukr.de
1 Institute of Clinical Chemistry and Laboratory Medicine, University Hospital Regensburg, Franz-Josef-Strauß-Allee 11,
93053 Regensburg, Germany
2 Department of Nutrition, Exercise and Sports, Faculty of Science, University of Copenhagen, Nørre Allé 51,
2200 Copenhagen, Denmark https://doi.org/10.1007/s00216-020-02416-y
/ Published online: 21 March 2020
Lipidomic methods nowadays offer a wide range of possi- bilities to analyze lipid species profiles of biological materials [15]. However, only a few methods are available to study the lipidome of fecal material [2,
16,17]. Most of the describedapproaches focus on the identification and quantification of selected lipid classes like fatty acids [18,
19], bile acids [20],and sterols [21]. Here, we report the evaluation and validation of a method for identification and quantification of DG and TG species of human fecal material using flow injection anal- ysis (FIA) coupled to Fourier transform mass spectrometry (FIA-FTMS).
Materials and methods Chemicals and reagents
Methanol and ethanol absolute (EMSURE) were obtained from Merck (Darmstadt, Germany), and chloroform and 2-propanol from Roth (Karlsruhe, Germany). All solvents were of HPLC grade. Ammonium formate was ordered from Sigma-Aldrich (Taufkirchen, Germany) and isooc- tane (2,2,4-trimethylpentane) > 99% from Honeywell (Seelze, Germany). All chemicals and standards were of high purity grade for analysis (> 95%). Glycerolipid stan- dards were purchased from Larodan (Solna, Sweden):
diarachidin (DG 20:0/20:0), dinonadecanoin (DG 19:0/
19:0), dilinolenin (DG 18:3/18:3), dilinolein (DG 18:2/
18:2), 1,2-distearin (DG 18:0/18:0), triarachidin (TG 20:0/20:0/20:0), trinonadecanoin (TG 19:0/19:0/19:0), trilinolein (TG 18:2/18:2/18:2), triolein (TG 18:1/18:1/
18:1), 1,2-olein-3-stearin (TG 18:1/18:1/18:0), 1,2-stea- rin-3-olein (TG 18:0/18:0/18:1), triheptadecanoin (TG 17:0/17:0/17:0), and tripalmitin (TG 16:0/16:0/16:0).
Purified water was produced by Millipore Milli-Q UF- Plus water purification system (Molsheim, France).
Stock solutions
All diacylglycerol and triacylglycerol standards were dis- solved in isooctane/isopropanol (3:1 v/v) with a concen- tration of 1.0 mg/mL. The internal standard (IS) solution contained trinonadecanoin, triheptadecanoin, and diarachidin each at a concentration of 10
μg/mL inchloroform/methanol (9:1 v/v).
Samples
Human fecal material was obtained from 20 healthy volun- teers for method development. The material was collected in the morning and directly transported to the laboratory (stored on ice). Polypropylene tubes were used for sample collection, immediately stored at
−20 °C, and transported to the
laboratory on ice. Samples were stored at
−80 °C until further processing. Samples used to investigate the influence of stool grade were collected as described by Kjølbæk et al. [22]. This trial was registered under
ClinicalTrials.govIdentifier no.
NCT02215343.
Sample preparation
A randomly selected part of the raw fecal material was ho- mogenized in isopropanol/water (70/30, v/v) using a gentleMACS
™Dissociator (Miltenyi Biotec GmbH, Bergisch Gladbach, Germany) as described previously [21].
The homogenate was diluted in 70% isopropanol to a concen- tration of 2.0 mg dry weight/mL (dw/mL) for further analysis.
Samples were always kept on ice and stored at
−80 °C until further processing. An amount of 50
μL of the internal stan- dard solution (containing 0.54 nmol TG 57:0, 0.59 nmol TG 51:0, and 0.73 nmol DG 40:0) was added to a sample volume of 100
μL (2 mg dw/mL) fecal homogenate prior to lipid extraction and extracted according to the protocol of Bligh and Dyer [23] with a total chloroform volume of 2 mL and an extraction time of 60 min at room temperature. A volume of 1200
μL of the separated chloroform phase was transferredinto a sample vial by a pipetting robot (Tecan Genesis RSP 150) and evaporated to dryness in a vacuum concentrator. The residues were dissolved in 1.0 mL chloroform/methanol/2- propanol (1:2:4 v/v/v) containing 7.5 mM ammonium formate.
Flow injection Fourier transform mass spectrometry
Mass spectrometric analysis of the reconstituted lipid extracts was performed by direct flow injection analysis using Fourier transform mass spectrometry (FIA-FTMS). A hybrid quadrupole-Orbitrap mass spectrometer (QExactive, Thermo Fisher Scientific, Bremen, Germany) equipped with a heated electrospray ionization source was coupled to a PAL autosampler (CTC Analytics, Zwingen, Switzerland) and an UltiMate 3000 isocratic pump (Thermo Fisher Scientific, Waltham, MA, USA). The injection volume was 50
μL anda solvent mixture of chloroform/methanol/2-propanol (1:2:4 v/v/v) delivered at an initial flow rate of 100
μL/minuntil 0.25 min, followed by 10
μL/min for 2.5 min and awashout with 300
μL/min for 0.5 min. The ion source wasoperated in positive ion mode using the following parameters:
spray voltage 3.5 kV, capillary temperature of 281 °C, S-lens RF level 55, aux gas heater temperature of 250 °C, and flow rates of 58 for sheath gas and 16 for aux gas. FTMS data were recorded in positive ion mode with a maximum injection time (IT) of 200 ms, an automated gain control (AGC) of 1·10
6, three microscans, and a target resolution of 140,000 (at
m/z200). Diacylglycerols were measured in a mass rage
m/z450–
800 and triacylglycerols in a range of
m/z750
–1200. MS2
spectra were acquired for 3 min in mass range
m/z450–1200 with a step size of 1.0008 Da and an isolation window of 1 Da with a normalized collision energy of 20%, an IT of 64 ms, AGC of 1·10
5, and a target resolution of 17,500.
Lipid identification and data processing
ALEX software [24] was used for peak assignment of data acquired by FTMS and MS/FTMS (MS2) using an
m/ztoler- ance of ± 0.0045 Da. Peaks with mass deviation of more than 3 ppm were not considered. Species assignment included evaluation of product ion spectra (see Electronic Supplementary Material (ESM) Fig.
S2). The assigned datawere exported to Microsoft Excel 2010 and processed using self-programmed macros. For accurate quantification, intensi- ties were corrected for type I isotope effects (relative isotope abundance; [25]). Type II corrections (overlap mainly resulting from
13C-atoms) were not required at the selected mass resolution due to peak coalescence (Hoering et al., man- uscript in preparation). Quantification was performed by nor- malization of analyte to internal standard intensities multiplied with the spiked amount of the internal standard as described recently [26]. Lipids were annotated as sum composition of acyl chains or without specification of
snpositions using
“_
”as previously proposed [27].
Method validation
Limit of quantification (LoQ) of DG and TG species was determined from serial dilutions of fecal samples. Each level was analyzed in fivefold. The coefficient of variation (CV) and the absolute value of trueness
–100% were determined and plotted against the concentrations. The results were fitted by a power function. LoQ was calculated representing a CVof
≤
20% and absolute value of trueness
–100%
≤20%, respec- tively. The higher concentration of both calculations was de- fined as LoQ (for details, see ESM).
Intra-day precision was assessed for five different samples which were extracted five times and quantified. For inter-day precision, the same samples were extracted and measured on five different days (20 days between first and last measurements).
Linearity of quantification was determined using spiked samples at six concentration levels. Each level was extracted 5-fold. The results were fitted by a linear function.
Dilution integrity of DG and TG species was deter- mined by analysis of stool samples at different concentra- tions (from 1.6 to 0.02 mg dw/mL). Samples were mea- sured in triplicates. The measured quantity was compared with the target quantity determined at the highest sample concentration.
Microscopy
The particle size was documented using phase-contrast mi- croscopy with × 10 magnification (Zeiss Primovert, Jena, Germany) and the ZEN 2.6 lite imaging software.
Results and discussion
Our initial aim was to develop an accurate and fast method for the identification and quantification of lipid species in human fecal material using FIA-FTMS with a quadrupole-Orbitrap hybrid mass spectrometer (QExactive). Crude lipid extracts prepared by chloroform extraction according to the protocol by Bligh and Dyer [23] were analyzed in positive ion mode.
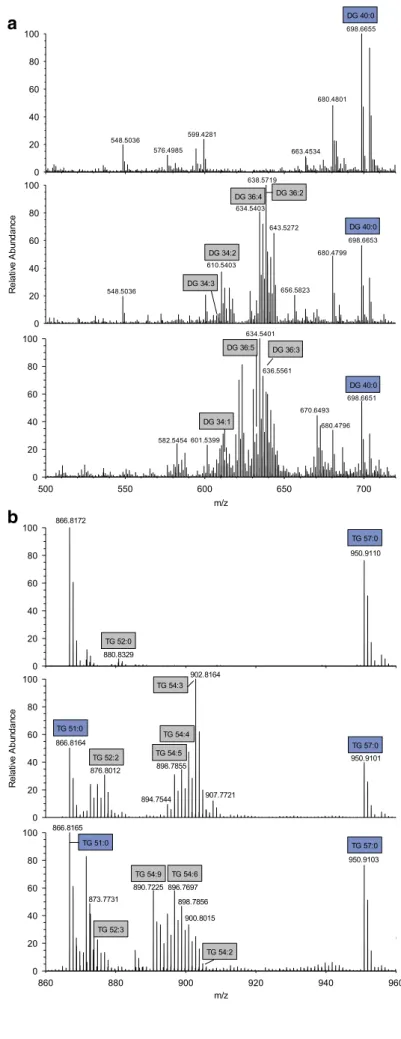
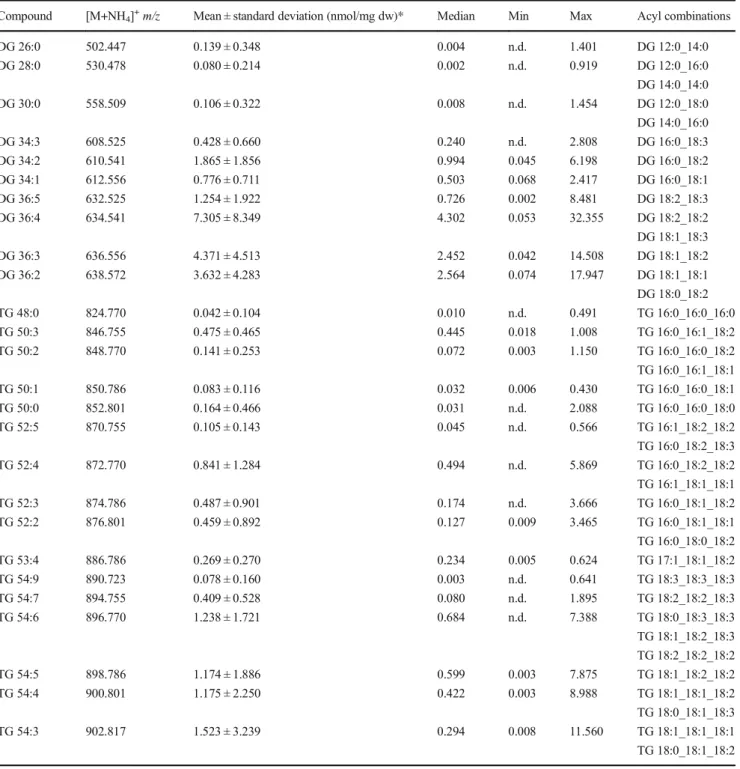
Upon initial evaluation, spectra revealed a high heterogeneity (Fig.
1) and numerous peaks could be assigned to [M+NH4]
+ions of DG and TG species. Other lipid classes were not de- tected in significant amounts not even in negative ion mode spectra (data not shown). Therefore, we decided to focus on the quantification of DG and TG species.
In a first step, 20 different fecal samples were screened for their DG and TG content. None of the analyzed samples contained signals representing a relevant interference with the selected internal standards (IS) DG 40:0, TG 51:0, and TG 57:0 (ESM Fig.
S1). To prove the identity of detectedspecies, MS2 spectra were evaluated and product ions assigned according to the annotation system proposed recently [28] (exemplified in ESM Fig.
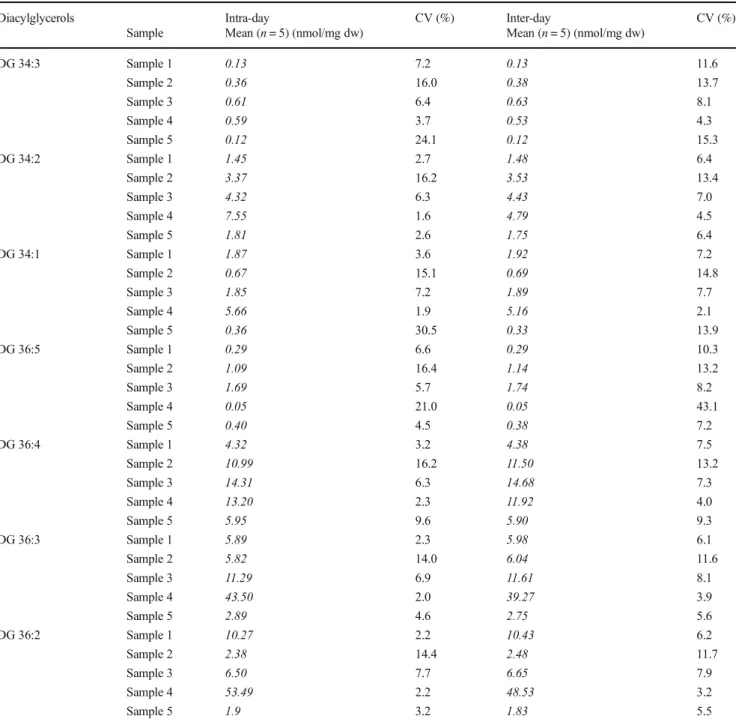
S2). The concentrations of DGand TG species detected in these samples span a range up to or more than three orders of magnitude (Table
1). Highest meanconcentrations were detected for polyunsaturated species with more than two double bonds: DG 36:3, DG 36:4, TG 54:3, TG 54:4, and TG 54:5. The detected acyl fragments comprised mainly acyl chains with 16 and 18 carbons and up to three double bonds. For DG, also species containing FA 12:0 and 14:0 were detected precluding application of DG 28:0 as IS.
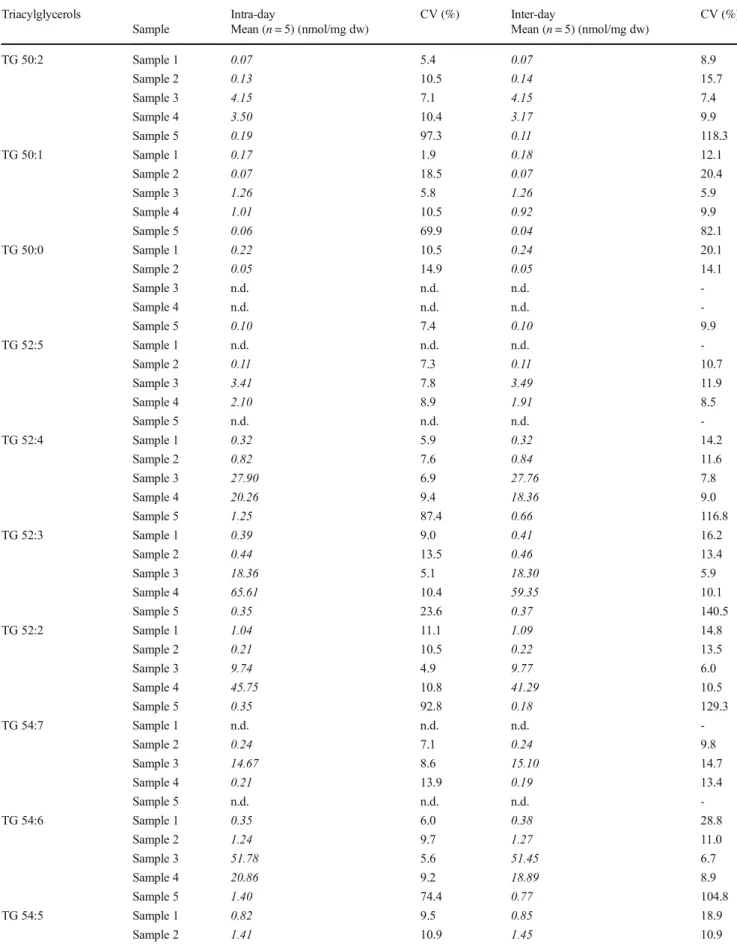
Reproducibility
In an important next step within method development [29,
30], we evaluated the performance of the FIA-FTMS method.Due to sample heterogeneity, intra- and inter-day precisions were evaluated in five different samples (Tables
2and
3). Thecoefficients of variation (CVs) were below 15% or even below 10% for most DG species. For sample 5 significantly higher variations were observed especially for TG species concentra- tions (see also
“Evaluation of reproducibility issues”).Moreover, we observed for this sample a decrease in the con-
centrations of most of the TG species from day to day. Despite
storage of the samples in 70% isopropanol at
−80 °C, this
decline may be related to lipase activity since enzymatic ac-
tivity has been reported also in organic solvents [31,
32].0 20 40 60 80 100
ecnadnubAevitaleR
0 20 40 60 80 100
DG 40:0
DG 40:0 DG 36:2
DG 36:4
DG 34:2
DG 34:3
m/z
500 550 600 650 700
0 20 40 60 80 100
DG 40:0 DG 36:3
DG 36:5
DG 34:1
698.6655
698.6653 638.5719
634.5403
610.5403
698.6651 636.5561
634.5401
601.5399 582.5454
670.6493 680.4796 680.4799 643.5272
656.5823 548.5036
680.4801
599.4281
663.4534 548.5036
576.4985
0 20 40 60 80 100
864 868 872 876 884 888 892 896 904 908 912 916 924 928 932 936 944 948 952 956
ecnadnubAevitaleR
0 20 40 60 80 100
m/z
860 880 900 920 940 960
0 20 40 60 80 100
TG 57:0
TG 52:0
TG 51:0
TG 51:0
TG 57:0
TG 57:0 TG 54:3
TG 54:4 TG 54:5 TG 52:2
TG 52:3
TG 54:9 TG 54:6
TG 54:2 866.8172
866.8164
866.8165
950.9110
950.9101
950.9103 880.8329
876.8012
902.8164
907.7721 898.7855
894.7544
890.7225 896.7697
873.7731 898.7856
900.8015
a
b
Fig. 1 Displayed are mass spectra from three individual human fecal samples analyzed in positive ion mode. Panelashows the mass range of DG species (m/z500– 720) and panelbof TG species (m/z810–980)
Limit of quantification
Higher CV values were most likely related to concentrations close to limit of detection. Therefore, limits of quantification (LoQs) were determined functionally as described previously [21,
33]. Non-endogenous DG and TG species were spiked atvarious concentrations and analyzed in 5-fold. CV and accu- racy were fitted as shown in Fig.
S3(see ESM). The calculated
LoQs were in the range of 0.01–0.2 nmol/mg dw for DG species and 0.01–0.3 nmol/mg dw for TG species. LoQs de- termined at CV of 20% were significantly lower compared with those determined by accuracy. Most of the LoQs derived from CVs were in the range of 0.01 to 0.02 nmol/mg dw which also matched the inter- and intra-day CVs listed in Tables
2and
3. This demonstrates a reproducible analysisbelow 0.1 nmol/mg dw. LoQs derived from accuracy analysis
Table 1 Concentrations and acyl combinations of DG and TG species in human feces from 20 different samples. Data based on a single measurement of the individual samples and acyl combinations were derived from MS2 spectra
Compound [M+NH4]+m/z Mean ± standard deviation (nmol/mg dw)* Median Min Max Acyl combinations
DG 26:0 502.447 0.139 ± 0.348 0.004 n.d. 1.401 DG 12:0_14:0
DG 28:0 530.478 0.080 ± 0.214 0.002 n.d. 0.919 DG 12:0_16:0
DG 14:0_14:0
DG 30:0 558.509 0.106 ± 0.322 0.008 n.d. 1.454 DG 12:0_18:0
DG 14:0_16:0
DG 34:3 608.525 0.428 ± 0.660 0.240 n.d. 2.808 DG 16:0_18:3
DG 34:2 610.541 1.865 ± 1.856 0.994 0.045 6.198 DG 16:0_18:2
DG 34:1 612.556 0.776 ± 0.711 0.503 0.068 2.417 DG 16:0_18:1
DG 36:5 632.525 1.254 ± 1.922 0.726 0.002 8.481 DG 18:2_18:3
DG 36:4 634.541 7.305 ± 8.349 4.302 0.053 32.355 DG 18:2_18:2
DG 18:1_18:3
DG 36:3 636.556 4.371 ± 4.513 2.452 0.042 14.508 DG 18:1_18:2
DG 36:2 638.572 3.632 ± 4.283 2.564 0.074 17.947 DG 18:1_18:1
DG 18:0_18:2
TG 48:0 824.770 0.042 ± 0.104 0.010 n.d. 0.491 TG 16:0_16:0_16:0
TG 50:3 846.755 0.475 ± 0.465 0.445 0.018 1.008 TG 16:0_16:1_18:2
TG 50:2 848.770 0.141 ± 0.253 0.072 0.003 1.150 TG 16:0_16:0_18:2
TG 16:0_16:1_18:1
TG 50:1 850.786 0.083 ± 0.116 0.032 0.006 0.430 TG 16:0_16:0_18:1
TG 50:0 852.801 0.164 ± 0.466 0.031 n.d. 2.088 TG 16:0_16:0_18:0
TG 52:5 870.755 0.105 ± 0.143 0.045 n.d. 0.566 TG 16:1_18:2_18:2
TG 16:0_18:2_18:3
TG 52:4 872.770 0.841 ± 1.284 0.494 n.d. 5.869 TG 16:0_18:2_18:2
TG 16:1_18:1_18:1
TG 52:3 874.786 0.487 ± 0.901 0.174 n.d. 3.666 TG 16:0_18:1_18:2
TG 52:2 876.801 0.459 ± 0.892 0.127 0.009 3.465 TG 16:0_18:1_18:1
TG 16:0_18:0_18:2
TG 53:4 886.786 0.269 ± 0.270 0.234 0.005 0.624 TG 17:1_18:1_18:2
TG 54:9 890.723 0.078 ± 0.160 0.003 n.d. 0.641 TG 18:3_18:3_18:3
TG 54:7 894.755 0.409 ± 0.528 0.080 n.d. 1.895 TG 18:2_18:2_18:3
TG 54:6 896.770 1.238 ± 1.721 0.684 n.d. 7.388 TG 18:0_18:3_18:3
TG 18:1_18:2_18:3 TG 18:2_18:2_18:2
TG 54:5 898.786 1.174 ± 1.886 0.599 0.003 7.875 TG 18:1_18:2_18:2
TG 54:4 900.801 1.175 ± 2.250 0.422 0.003 8.988 TG 18:1_18:1_18:2
TG 18:0_18:1_18:3
TG 54:3 902.817 1.523 ± 3.239 0.294 0.008 11.560 TG 18:1_18:1_18:1
TG 18:0_18:1_18:2
depend on accurate addition of low amounts of DG/TG spe- cies, which may be compromised by many factors including analyte absorption or inhomogeneity issues (described be- low). Except a poor curve fit as a factor, we could not find an explanation for the order of magnitude difference between the LoQs determined for different species. There seems to be neither a relation to species chain length nor number of double bonds. LoQs for DG and TG appear to be similar. Based on these considerations, we applied for practical reasons 0.02 nmol/mg dw as LoD and 0.1 nmol/mg dw as LoQ (this
is also substantiated by data from dilution integrity testing shown below).
Recovery, linearity, and dilution integrity
Recovery of DG and TG species was determined at two spike levels (ESM Table
S1). Most of the determined recoverieswere within the expected range of 85 to 115%. However, considering the high complexity of fecal material as matrix, we think that recoveries between 75 and 135% are acceptable.
Table 2 Coefficient of variation (CV) of intra- and inter-day precision of DG species determined in five different human fecal samples by FIA-FTMS/
MS analyzed in fivefold
Diacylglycerols Intra-day CV (%) Inter-day CV (%)
Sample Mean (n= 5) (nmol/mg dw) Mean (n= 5) (nmol/mg dw)
DG 34:3 Sample 1 0.13 7.2 0.13 11.6
Sample 2 0.36 16.0 0.38 13.7
Sample 3 0.61 6.4 0.63 8.1
Sample 4 0.59 3.7 0.53 4.3
Sample 5 0.12 24.1 0.12 15.3
DG 34:2 Sample 1 1.45 2.7 1.48 6.4
Sample 2 3.37 16.2 3.53 13.4
Sample 3 4.32 6.3 4.43 7.0
Sample 4 7.55 1.6 4.79 4.5
Sample 5 1.81 2.6 1.75 6.4
DG 34:1 Sample 1 1.87 3.6 1.92 7.2
Sample 2 0.67 15.1 0.69 14.8
Sample 3 1.85 7.2 1.89 7.7
Sample 4 5.66 1.9 5.16 2.1
Sample 5 0.36 30.5 0.33 13.9
DG 36:5 Sample 1 0.29 6.6 0.29 10.3
Sample 2 1.09 16.4 1.14 13.2
Sample 3 1.69 5.7 1.74 8.2
Sample 4 0.05 21.0 0.05 43.1
Sample 5 0.40 4.5 0.38 7.2
DG 36:4 Sample 1 4.32 3.2 4.38 7.5
Sample 2 10.99 16.2 11.50 13.2
Sample 3 14.31 6.3 14.68 7.3
Sample 4 13.20 2.3 11.92 4.0
Sample 5 5.95 9.6 5.90 9.3
DG 36:3 Sample 1 5.89 2.3 5.98 6.1
Sample 2 5.82 14.0 6.04 11.6
Sample 3 11.29 6.9 11.61 8.1
Sample 4 43.50 2.0 39.27 3.9
Sample 5 2.89 4.6 2.75 5.6
DG 36:2 Sample 1 10.27 2.2 10.43 6.2
Sample 2 2.38 14.4 2.48 11.7
Sample 3 6.50 7.7 6.65 7.9
Sample 4 53.49 2.2 48.53 3.2
Sample 5 1.9 3.2 1.83 5.5
Table 3 Coefficient of variation (CV) of intra- and inter-day precision of TG species determined in five different human fecal samples by FIA-FTMS/
MS analyzed in fivefold
Triacylglycerols Intra-day CV (%) Inter-day CV (%)
Sample Mean (n= 5) (nmol/mg dw) Mean (n= 5) (nmol/mg dw)
TG 50:2 Sample 1 0.07 5.4 0.07 8.9
Sample 2 0.13 10.5 0.14 15.7
Sample 3 4.15 7.1 4.15 7.4
Sample 4 3.50 10.4 3.17 9.9
Sample 5 0.19 97.3 0.11 118.3
TG 50:1 Sample 1 0.17 1.9 0.18 12.1
Sample 2 0.07 18.5 0.07 20.4
Sample 3 1.26 5.8 1.26 5.9
Sample 4 1.01 10.5 0.92 9.9
Sample 5 0.06 69.9 0.04 82.1
TG 50:0 Sample 1 0.22 10.5 0.24 20.1
Sample 2 0.05 14.9 0.05 14.1
Sample 3 n.d. n.d. n.d. -
Sample 4 n.d. n.d. n.d. -
Sample 5 0.10 7.4 0.10 9.9
TG 52:5 Sample 1 n.d. n.d. n.d. -
Sample 2 0.11 7.3 0.11 10.7
Sample 3 3.41 7.8 3.49 11.9
Sample 4 2.10 8.9 1.91 8.5
Sample 5 n.d. n.d. n.d. -
TG 52:4 Sample 1 0.32 5.9 0.32 14.2
Sample 2 0.82 7.6 0.84 11.6
Sample 3 27.90 6.9 27.76 7.8
Sample 4 20.26 9.4 18.36 9.0
Sample 5 1.25 87.4 0.66 116.8
TG 52:3 Sample 1 0.39 9.0 0.41 16.2
Sample 2 0.44 13.5 0.46 13.4
Sample 3 18.36 5.1 18.30 5.9
Sample 4 65.61 10.4 59.35 10.1
Sample 5 0.35 23.6 0.37 140.5
TG 52:2 Sample 1 1.04 11.1 1.09 14.8
Sample 2 0.21 10.5 0.22 13.5
Sample 3 9.74 4.9 9.77 6.0
Sample 4 45.75 10.8 41.29 10.5
Sample 5 0.35 92.8 0.18 129.3
TG 54:7 Sample 1 n.d. n.d. n.d. -
Sample 2 0.24 7.1 0.24 9.8
Sample 3 14.67 8.6 15.10 14.7
Sample 4 0.21 13.9 0.19 13.4
Sample 5 n.d. n.d. n.d. -
TG 54:6 Sample 1 0.35 6.0 0.38 28.8
Sample 2 1.24 9.7 1.27 11.0
Sample 3 51.78 5.6 51.45 6.7
Sample 4 20.86 9.2 18.89 8.9
Sample 5 1.40 74.4 0.77 104.8
TG 54:5 Sample 1 0.82 9.5 0.85 18.9
Sample 2 1.41 10.9 1.45 10.9
To further evaluate the dynamic range of the method, the linearity of quantification was tested for several species not present in fecal samples. DG 36:6, DG 38:0, TG 54:2, and TG 54:1 were spiked at six different concentrations (ESM Fig.
S4). All species revealed a good correlation of spiked and
detected concentrations. However, species response seems to depend on structural features, as described for cholesteryl es- ter [26], and should be studied in detail in further studies. A
linear range covering most of the tested samples was demon- strated up to 120 mg dw/mL and 90 mg dw/mL for DG and TG, respectively.
Moreover, dilution integrity was tested by quantification of gradually diluted stool samples (1.6 to 0.02 mg dw/mL). Low (DG 32:0, TG 48:0), medium (DG 34:2, TG 52:2), and high (DG 36:3, TG 54:4) abundant species showed a good corre- lation of expected and measured concentrations (ESM Fig.
Table 3 (continued)
Triacylglycerols Intra-day CV (%) Inter-day CV (%)
Sample Mean (n= 5) (nmol/mg dw) Mean (n= 5) (nmol/mg dw)
Sample 3 52.48 4.1 52.47 5.6
Sample 4 106.95 10.4 96.83 10.0
Sample 5 1.85 102.5 0.92 146.0
TG 54:4 Sample 1 1.83 11.6 1.89 15.3
Sample 2 0.93 11.0 0.96 11.6
Sample 3 37.41 4.1 37.39 5.7
Sample 4 175.39 10.5 146.61 26.1
Sample 5 0.65 28.9 0.66 147.5
TG 54:3 Sample 1 4.78 11.3 4.91 14.2
Sample 2 0.44 12.0 0.46 12.8
Sample 3 18.69 4.2 18.72 5.8
Sample 4 248.23 12.4 225.33 11.5
Sample 5 0.6 88.8 0.29 131.0
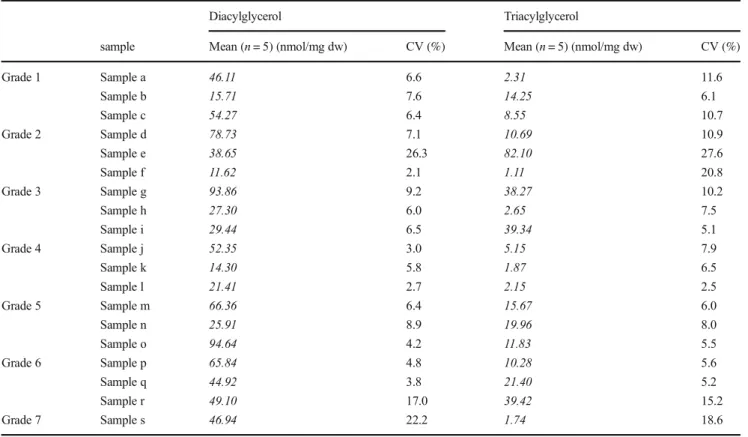
Table 4 DG and TG concentrations and their coefficient of variation (n= 5) related to stool grading
Diacylglycerol Triacylglycerol
sample Mean (n= 5) (nmol/mg dw) CV (%) Mean (n= 5) (nmol/mg dw) CV (%)
Grade 1 Sample a 46.11 6.6 2.31 11.6
Sample b 15.71 7.6 14.25 6.1
Sample c 54.27 6.4 8.55 10.7
Grade 2 Sample d 78.73 7.1 10.69 10.9
Sample e 38.65 26.3 82.10 27.6
Sample f 11.62 2.1 1.11 20.8
Grade 3 Sample g 93.86 9.2 38.27 10.2
Sample h 27.30 6.0 2.65 7.5
Sample i 29.44 6.5 39.34 5.1
Grade 4 Sample j 52.35 3.0 5.15 7.9
Sample k 14.30 5.8 1.87 6.5
Sample l 21.41 2.7 2.15 2.5
Grade 5 Sample m 66.36 6.4 15.67 6.0
Sample n 25.91 8.9 19.96 8.0
Sample o 94.64 4.2 11.83 5.5
Grade 6 Sample p 65.84 4.8 10.28 5.6
Sample q 44.92 3.8 21.40 5.2
Sample r 49.10 17.0 39.42 15.2
Grade 7 Sample s 46.94 22.2 1.74 18.6
S5). The assay was linear at low (DG 32:0 and TG 48:0) and
high concentrations (DG 36:3, TG 54:4) and matched the above described LoQ and LoD and linear range (up to 250 mg DG dw/mL and 150 mg TG dw/mL), respectively.
Evaluation of reproducibility issues
As described above, very high variations were observed for some samples (about 10% of tested fecal samples). Therefore, various experiments were performed to evaluate the origin of irreproducibility. Despite thorough mechanical homogeniza- tion, fecal samples are suspensions and a lack of homogeneity may cause variations. Therefore, we first tested whether cen- trifugation affects DG and TG concentrations. Five samples showing high variations were analyzed without centrifugation as well as after centrifugation (ESM Table
S2). While DGspecies were detected in both pellet and supernatant, TG spe- cies were found in three of the samples enriched in the pellet.
However, the DG/TG species profiles of supernatant and pel- let closely resembled each other (ESM Table
S3), suggestingthat centrifugation does not separate a specific pool of these lipid classes.
In order to improve the homogeneity, we tested addition of detergent (0.1%, 0.5%, and 1.0% SDS), an additional homog- enization step using the Precellys
®homogenizer (data not shown) as well as sonication up to 3 h (ESM Table
S4). Allof these additional treatments did not result in a decrease of variation. In contrast, the application of higher sample vol- umes (2 mg instead of 200
μg dw) for lipid extraction showedsome decrease of CV, especially for TG species and samples with a high fraction of TG in the pellet. Considering that variation is mainly due to sample inhomogeneity, drawing a higher sample volume could explain lower variations.
In a next step, we asked whether these inhomogeneity is- sues could be related to the consistency of the fecal material.
Therefore, we selected, if available, three samples for each
DG
TG
a
b
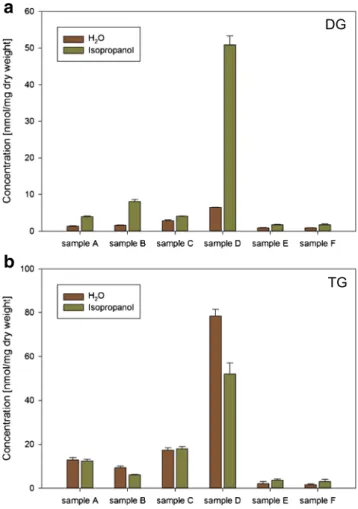
Fig. 2 Effect of isopropanol addition on DG (a) and TG (b) quantification. Displayed are six individual samples homogenized in water and supplemented with the same volume of either H2O (brown) or isopropanol (green) (70% related to volume)
Fig. 3 Comparison of human fecal sample D diluted either in water (a) or in isopropanol (b) at a dry weight of 2 mg dw/mL using phase-contrast microscopy with × 10 magnification
stool grade (according to Bristol Stool Chart [34]; with grade 1 representing hard and grade 7 watery consistency) from a study on fiber and polyunsaturated fatty acid interventions [22]. The samples were measured in five replicates (Table
4). Samples with grades 3 to 5 showed CVs≤10%.
However, in samples with lower grades (1 to 2), we could not see a clear trend for higher CVs, which may have been expected for more solid consistency.
Finally, we checked whether the solvent used for sample preparation may affect DG/TG concentrations. In several stud- ies, homogenization of fecal material was performed not only in water [35] or aqueous buffer [36,
37], but also in diluted organicsolvents [38,
39]. In our laboratory, diluted isopropanol wasused to stabilize fecal concentrations of short chain fatty acids [40]; thus, the effect of isopropanol was investigated for DG/
TG concentrations. Therefore, fecal raw material was homoge- nized in water and subsequently diluted at ratios of 3 to 7 (by volume) with either water or isopropanol (Fig.
2) and immedi-ately stored at
−80 °C. Unexpectedly, addition of isopropanol tremendously increased DG concentrations in almost all sam- ples. Moreover, in two of the six samples, we observed a drop of TG concentrations. However, the increase of DG could not be explained by TG degradation in these samples because the increase of DG exceeded the decreased amount of TG.
Comparison of spectra of samples stabilized in water or isopropanol showed clear differences in all DG species profiles and in the TG profiles of three of the six samples (ESM Table
S5). We could not observe additional species uponisopropanol addition and no common pattern in the increased DG species for the individual samples.
To get more insight, we examined both aqueous and isopropanol-containing sample homogenates by light micros- copy (Fig.
3). Clearly, aqueous samples seem to be more ho-mogeneous compared with isopropanol-containing samples.
However, in aqueous samples, a massive presence of bacteria could be observed. To inhibit metabolic activity and to reduce health risks, fecal samples are frequently treated with alcohols.
Currently, we cannot explain the aggregation induced by ad- dition of isopropanol. The increase of DG upon isopropanol addition seems to be related to both disruption of bacteria resulting in improved extractability of DG and lipolysis of TG. The latter seems to be triggered in some samples by addition of isopropanol and matches lipolytic activities ob- served in organic solvents [31,
32]. These data clearly dem-onstrate that further studies are warranted to evaluate optimal pre-analytic conditions for fecal samples as well as the origin of these differences.
Conclusion
Here we report, to our knowledge, the first method for the identification and quantification of DG and TG in human fecal
material using FIA coupled to a high-resolution FTMS instru- ment. Up to now, only a few studies on the fecal lipidome exist which is most likely related to the difficulties faced with this sample material [2,
16]. The proposed method has a short runtime of 4 min per sample, including MS2 measurements, fa- cilitating a high sample throughput necessary for clinical stud- ies. Validation of the novel method demonstrated its suitability for large-scale studies despite the higher variations observed for some samples. These variations are related to inhomoge- neity of samples and lipolytic activity that requires further investigations considering pre-analytical issues as an essential part of lipidomic workflows and their standardization [29,
30, 41]. Therefore, we recommend performing measurements intriplicate, when high accuracy is needed. In this regard, sam- pling is very important since metabolites are distributed highly heterogeneous in feces and homogenization of larger quanti- ties is recommended [42].
In summary, the presented method provides a valuable tool to quantify DG and TG species, the major lipid classes in human fecal samples. These data could be a first step to un- ravel the fecal lipidome and get more insight into its role for health and disease.
Acknowledgments Open Access funding provided by Projekt DEAL.
We thank Christa Büchler and Christer Ejsing for their helpful comments and suggestions regarding this work. We also thank Simone Düchtel, Doreen Müller, and Sebastian Roth for expert technical assistance.
Funding information This work was funded by the European Union’s FP7 program MyNewGut (grant agreement number 613979) and the Deutsche Forschungsgemeinschaft (DFG) grant DFG priority program
“SPP 1656- Intestinal microbiota (LI 923/4-1) and DFG—project number 209933838—Collaborative Research Center SFB1052 “Obesity Mechanisms”(SFB-1052/B07 to R.B.).
Compliance with ethical standards
Voluntaries gave consent to use their samples anonymized as described.
Samples received within MyNewGut project Clinical Trial (NCT02215343) were conducted according to the guidelines laid down in the Declaration of Helsinki and were carried out in accordance with the ethical standards of the responsible regional committee on human exper- imentation in Denmark, registered as H-4-2014-052, and the Danish Data Protection Agency (2013-54-0522).
Conflict of interest The authors declare that they have no conflict of interest.
Open Access This article is licensed under a Creative Commons Attribution 4.0 International License, which permits use, sharing, adaptation, distribution and reproduction in any medium or format, as long as you give appropriate credit to the original author(s) and the source, provide a link to the Creative Commons licence, and indicate if changes were made. The images or other third party material in this article are included in the article's Creative Commons licence, unless indicated otherwise in a credit line to the material. If material is not included in the article's Creative Commons licence and your intended use is not permitted by statutory regulation or exceeds the permitted use, you will
need to obtain permission directly from the copyright holder. To view a copy of this licence, visithttp://creativecommons.org/licenses/by/4.0/.
References
1. Flint HJ, Scott KP, Louis P, Duncan SH. The role of the gut micro- biota in nutrition and health. Nat Rev Gastroenterol Hepatol.
2012;9(10):577–89.https://doi.org/10.1038/nrgastro.2012.156.
2. Matysik S, Le Roy CI, Liebisch G, Claus SP. Metabolomics of fecal samples: a practical consideration. Trends Food Sci Technol.
2016;57:244–55.https://doi.org/10.1016/j.tifs.2016.05.011.
3. Calloway DH, Kretsch MJ. Protein and energy utilization in men given a rural Guatemalan diet and egg formulas with and without added oat bran. Am J Clin Nutr. 1978;31(7):1118–26.https://doi.
org/10.1093/ajcn/31.7.1118.
4. Tarpila S, Miettinen TA, Metsaranta L. Effects of bran on serum cholesterol, faecal mass, fat, bile acids and neutral sterols, and bil- iary lipids in patients with diverticular disease of the colon. Gut.
1978;19(2):137–45.https://doi.org/10.1136/gut.19.2.137.
5. Stephen AM, Wiggins HS, Englyst HN, Cole TJ, Wayman BJ, Cummings JH. The effect of age, sex and level of intake of dietary fibre from wheat on large-bowel function in thirty healthy subjects.
Br J Nutr. 1986;56(2):349–61. https://doi.org/10.1079/
bjn19860116.
6. Canfield J, Goldner B, Lutwack R (1963) Research on applied bioelectrochemistry First quarterly progress report, 14 Mar.-30 Jun. 1963.
7. Kien CL, Cordano A, Cook DA, Young VR. Fecal characteristics in healthy young adults consuming defined liquid diets or a free- choice diet. Am J Clin Nutr. 1981;34(3):357–61.https://doi.org/
10.1093/ajcn/34.3.357.
8. Rivero-Marcotegui A, Olivera-Olmedo JE, Valverde-Visus FS, Palacios-Sarrasqueta M, Grijalba-Uche A, Garcia-Merlo S. Water, fat, nitrogen, and sugar content in feces: reference intervals in chil- dren. Clin Chem. 1998;44(7):1540–4.
9. Guyton A, Hall J. Textbook of medical physiology. 11th ed.
Amsterdam: Elsevier Inc.; 2006.
10. Wierdsma NJ, Peters JH, Weijs PJ, Keur MB, Girbes AR, van Bodegraven AA, et al. Malabsorption and nutritional balance in the ICU: fecal weight as a biomarker: a prospective observational pilot study. Crit Care. 2011;15(6):R264.
11. Snyder W, Cook M, Tipton I, Nasset E, Karhausen L, Howells G.
Reference man: anatomical, physiological and metabolic character- istics, ser. In: Report of Task Group on Reference Man-International Commission on Radiological Protection. New York: Pergamon Press Ltd; 1975.
12. Büttner H. Moderne Fettbestimmung im Stuhl. Dtsche Med Wochenschr. 1966;91(32):1418–9.
13. Bo-Linn GW, Fordtran JS. Fecal fat concentration in patients with steatorrhea. Gastroenterology. 1984;87(2):319–22.
14. Friedman E, Isaksson P, Rafter J, Marian B, Winawer S, Newmark H. Fecal diglycerides as selective endogenous mitogens for prema- lignant and malignant human colonic epithelial cells. Cancer Res.
1989;49(3):544–8.
15. Holcapek M, Liebisch G, Ekroos K. Lipidomic analysis. Anal Chem. 2018;90(7):4249–57.https://doi.org/10.1021/acs.analchem.
7b05395.
16. Gregory KE, Bird SS, Gross VS, Marur VR, Lazarev AV, Walker WA, et al. Method development for fecal lipidomics profiling. Anal Chem. 2013;85(2):1114–23.https://doi.org/10.1021/ac303011k.
17. Van Meulebroek L, De Paepe E, Vercruysse V, Pomian B, Bos S, Lapauw B, et al. Holistic lipidomics of the human gut phenotype using validated ultra-high-performance liquid chromatography coupled to hybrid Orbitrap mass spectrometry. Anal Chem.
2017;89(22):12502–10. https://doi.org/10.1021/acs.analchem.
7b03606.
18. Birk JJ, Dippold M, Wiesenberg GL, Glaser B. Combined quanti- fication of faecal sterols, stanols, stanones and bile acids in soils and terrestrial sediments by gas chromatography-mass spectrometry. J Chromatogr A. 2012;1242:1–10.https://doi.org/10.1016/j.chroma.
2012.04.027.
19. Sannolo N, Vajro P, Caporale C, Acampora A, Malorni A.
Extraction of fecal lipids and identification of hydroxystearic acid by gas chromatography-mass spectrometry (GC/MS). Boll Soc Ital Biol Sper. 1981;57(1):118–24.
20. Perwaiz S, Mignault D, Tuchweber B, Yousef IM. Rapid and im- proved method for the determination of bile acids in human feces using MS. Lipids. 2002;37(11):1093–100.
21. Schott HF, Krautbauer S, Horing M, Liebisch G, Matysik S. A validated, fast method for quantification of sterols and gut microbiome derived 5alpha/beta-stanols in human feces by isotope dilution LC-high-resolution MS. Anal Chem. 2018;90(14):8487– 94.https://doi.org/10.1021/acs.analchem.8b01278.
22. Kjolbaek L, Benitez-Paez A, Gomez Del Pulgar EM, Brahe LK, Liebisch G, Matysik S, et al. Arabinoxylan oligosaccharides and polyunsaturated fatty acid effects on gut microbiota and metabolic markers in overweight individuals with signs of metabolic syn- drome: a randomized cross-over trial. Clin Nutr. 2019.https://doi.
org/10.1016/j.clnu.2019.01.012.
23. Bligh EG, Dyer WJ. A rapid method of total lipid extraction and purification. Can J Biochem Physiol. 1959;37(8):911–7.https://doi.
org/10.1139/o59-099.
24. Husen P, Tarasov K, Katafiasz M, Sokol E, Vogt J, Baumgart J, et al. Analysis of lipid experiments (ALEX): a software framework for analysis of high-resolution shotgun lipidomics data. PLoS One.
2013;8(11):e79736.https://doi.org/10.1371/journal.pone.0079736.
25. Han X, Gross RW. Quantitative analysis and molecular species fingerprinting of triacylglyceride molecular species directly from lipid extracts of biological samples by electrospray ionization tan- dem mass spectrometry. Anal Biochem. 2001;295(1):88–100.
https://doi.org/10.1006/abio.2001.5178.
26. Horing M, Ejsing CS, Hermansson M, Liebisch G. Quantification of cholesterol and cholesteryl ester by direct flow injection high resolution FTMS utilizing species-specific response factors. Anal Chem. 2019.https://doi.org/10.1021/acs.analchem.8b05013.
27. Liebisch G, Vizcaino JA, Kofeler H, Trotzmuller M, Griffiths WJ, Schmitz G, et al. Shorthand notation for lipid structures derived from mass spectrometry. J Lipid Res. 2013;54(6):1523–30.
https://doi.org/10.1194/jlr.M033506.
28. Pauling JK, Hermansson M, Hartler J, Christiansen K, Gallego SF, Peng B, et al. Proposal for a common nomenclature for fragment ions in mass spectra of lipids. PLoS One. 2017;12(11):e0188394.
https://doi.org/10.1371/journal.pone.0188394.
29. Liebisch G, Ahrends R, Arita M, Arita M, Bowden JA, Ejsing CS, et al. Lipidomics needs more standardization. Nat Metab.
2019;1(8):745–7.
30. Liebisch G, Ekroos K, Hermansson M, Ejsing CS. Reporting of lipidomics data should be standardized. Biochim Biophys Acta Mol Cell Biol Lipids. 2017;1862(8):747–51.https://doi.org/10.
1016/j.bbalip.2017.02.013.
31. Kumar A, Dhar K, Kanwar SS, Arora PK. Lipase catalysis in or- ganic solvents: advantages and applications. Biol Proced Online.
2016;18:2.https://doi.org/10.1186/s12575-016-0033-2.
32. Klibanov AM. Improving enzymes by using them in organic sol- vents. Nature. 2001;409(6817):241–6.https://doi.org/10.1038/
35051719.
33. Liebisch G, Matysik S. Accurate and reliable quantification of 25- hydroxy-vitamin D species by liquid chromatography high- resolution tandem mass spectrometry. J Lipid Res. 2015;56(6):
1234–9.https://doi.org/10.1194/jlr.D058511.
34. Lewis SJ, Heaton KW. Stool form scale as a useful guide to intes- tinal transit time. Scand J Gastroenterol. 1997;32(9):920–4.https://
doi.org/10.3109/00365529709011203.
35. Hendrikx JJ, Rosing H, Schinkel AH, Schellens JH, Beijnen JH.
Combined quantification of paclitaxel, docetaxel and ritonavir in human feces and urine using LC-MS/MS. Biomed Chromatogr BMC. 2014;28(2):302–10.https://doi.org/10.1002/bmc.3021.
36. De Palma G, Nadal I, Collado MC, Sanz Y. Effects of a gluten-free diet on gut microbiota and immune function in healthy adult human subjects. Br J Nutr. 2009;102(8):1154–60.https://doi.org/10.1017/
s0007114509371767.
37. Jimenez-Giron A, Ibanez C, Cifuentes A, Simo C, Munoz- Gonzalez I, Martin-Alvarez PJ, et al. Faecal metabolomic finger- print after moderate consumption of red wine by healthy subjects. J Proteome Res. 2015;14(2):897–905.https://doi.org/10.1021/
pr500960g.
38. Cao H, Huang H, Xu W, Chen D, Yu J, Li J, et al. Fecal metabolome profiling of liver cirrhosis and hepatocellular carcinoma patients by ultra performance liquid chromatography-mass spectrometry. Anal Chim Acta. 2011;691(1–2):68–75.https://doi.org/10.1016/j.aca.
2011.02.038.
39. Zhao YY, Cheng XL, Wei F, Bai X, Lin RC. Application of faecal metabonomics on an experimental model of tubulointerstitial
fibrosis by ultra performance liquid chromatography/high- sensitivity mass spectrometry with MS(E) data collection tech- nique. Biomarkers. 2012;17(8):721–9.https://doi.org/10.3109/
1354750X.2012.724450.
40. Liebisch G, Ecker J, Roth S, Schweizer S, Ottl V, Schott HF, et al.
Quantification of fecal short chain fatty acids by liquid chromatog- raphy tandem mass spectrometry-investigation of pre-analytic sta- bility. Biomolecules. 2019;9(4). https://doi.org/10.3390/
biom9040121.
41. Burla B, Arita M, Arita M, Bendt AK, Cazenave-Gassiot A, Dennis EA, et al. MS-based lipidomics of human blood plasma: a community-initiated position paper to develop accepted guidelines.
J Lipid Res. 2018;59(10):2001–17.https://doi.org/10.1194/jlr.
S087163.
42. Gratton J, Phetcharaburanin J, Mullish BH, Williams HR, Thursz M, Nicholson JK, et al. Optimized sample handling strategy for metabolic profiling of human feces. Anal Chem. 2016;88(9):
4661–8.https://doi.org/10.1021/acs.analchem.5b04159.
Publisher’s note Springer Nature remains neutral with regard to jurisdic- tional claims in published maps and institutional affiliations.