D
EVELOPMENT ANDA
PPLICATIONOF A
H
IGH-R
ESOLUTIONF
LOWI
NJECTIONA
NALYSISF
OURIERT
RANSFORMM
ASSS
PECTROMETRY(FIA-FTMS) M
ETHOD TOI
DENTIFY ANDQ
UANTIFYL
IPIDS INH
UMANF
ECALS
AMPLESDissertation
zur Erlangung des Doktorgrades der Biomedizinischen Wissenschaften
(Dr. rer. physiol.)
der
Fakultät für Medizin der Universität Regensburg
vorgelegt von Verena Ertl
aus Mallersdorf
im Jahr 2020
Dekan: Prof. Dr. Dr. Torsten E. Reichert
Betreuer: PD Dr. Gerhard Liebisch
Tag der mündlichen Prüfung: 19.03.2021
ITABLE OF CONTENT
I Table of Content
I TABLE OF CONTENT ... I II LIST OF ABBREVIATIONS ... III III ZUSAMMENFASSUNG ... VI IV ABSTRACT ... VIII
1. INTRODUCTION ... 1
1.1 LIPID CATEGORIES ... 2
1.1.1FATTY ACYLS ... 3
1.1.2GLYCEROLIPIDS ... 4
1.1.3GLYCEROPHOSPHOLIPIDS ... 7
1.1.4SPHINGOLIPIDS... 9
1.1.5STEROL LIPIDS ... 10
1.1.6NOMENCLATURE ... 12
1.2 PRINCIPLES OF MASS SPECTROMETRY ... 13
1.2.1ELECTROSPRAY IONIZATION ... 13
1.2.2QUADRUPOLE MASS ANALYZER ... 14
1.2.3ORBITRAP MASS ANALYZER ... 15
1.2.4TANDEM MASS SPECTROMETRY ... 16
1.2.5QEXACTIVE HYBRID ORBITRAP MASS SPECTROMETER ... 17
1.2.6DIRECT INFUSION MASS SPECTROMETRY ... 18
1.3 MASS SPECTROMETRIC LIPID ANALYSIS ... 20
1.3.1EXTRACTION OF LIPIDS ... 20
1.3.2MASS SPECTROMETRIC ANALYSIS OF LIPIDS ... 21
1.4 LIPID ANALYSIS OF FECES... 23
1.4.1MICROBIOTA AND FECES ... 23
1.4.2LIPID ANALYSIS OF FECAL SAMPLES ... 24
1.5 OBJECTIVE OF THIS WORK ... 26
2. MATERIALS AND METHODS ... 27
2.1CHEMICALS ... 27
2.2STOCK SOLUTIONS ... 27
2.3 LABORATORY EQUIPMENT ... 29
2.4 SAMPLES ... 30
2.5 SAMPLE PREPARATION ... 30
2.5.1FECES HOMOGENIZATION ... 30
2.5.2LIPID EXTRACTION... 31
ITABLE OF CONTENT
2.6 FLOW INJECTION FOURIER TRANSFORM MASS SPECTROMETRY ... 32
2.7 MICROSCOPY ... 33
2.8 LIPID IDENTIFICATION AND DATA PROCESSING ... 33
2.9 METHOD VALIDATION ... 35
3. RESULTS AND DISCUSSION ... 36
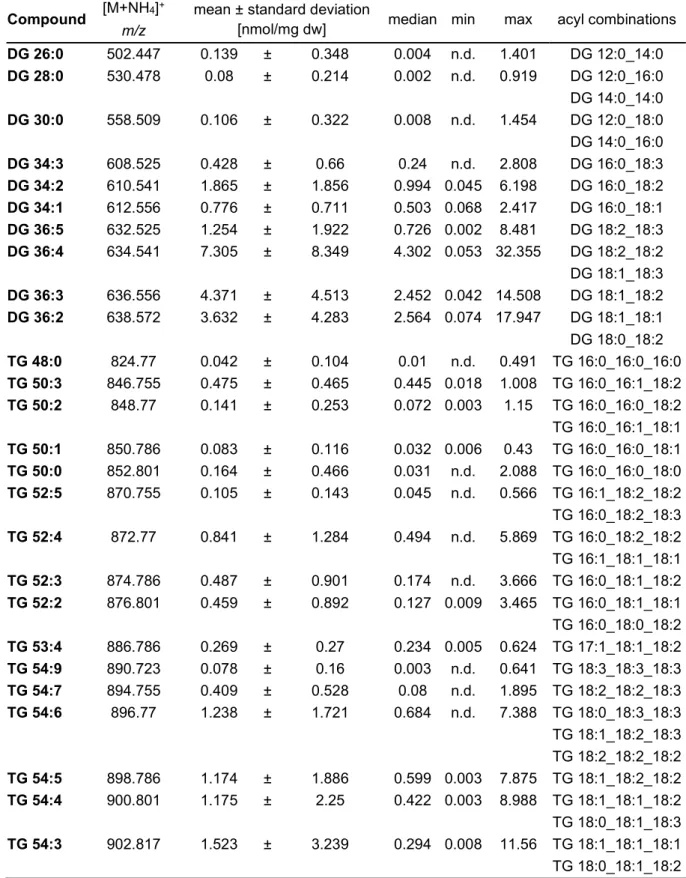
3.1 LIPID SPECIES PROFILE OF HUMAN FECAL SAMPLES IN POSITIVE ION MODE ... 36
3.1.1REPRODUCIBILITY ... 45
3.1.2LIMIT OF QUANTIFICATION ... 49
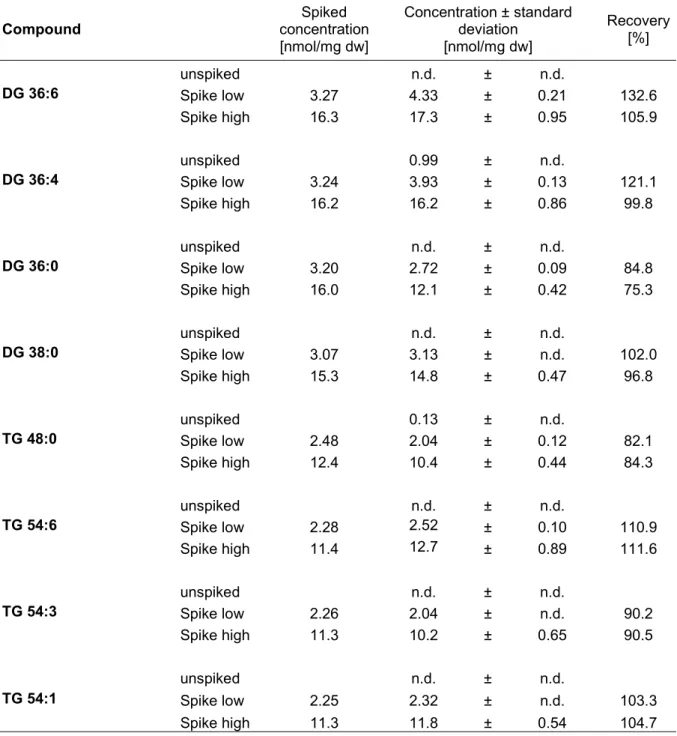
3.1.3RECOVERY,LINEARITY AND DILUTION INTEGRITY ... 52
3.1.4EVALUATION OF REPRODUCIBILITY ISSUES ... 56
3.1.4.1EFFECT OF CENTRIFUGATION ... 56
3.1.4.2EFFECT OF BEAD BEATING ... 60
3.1.4.3EFFECT OF SAMPLE CONCENTRATION AND VOLUME ... 62
3.1.4.4EFFECT OF LIPID EXTRACTION ... 67
3.1.4.5EFFECT OF STOOL GRADE ... 72
3.1.4.6STABILITY OF SAMPLE EXTRACTS ... 73
3.1.4.7SUMMARY –HOMOGENIZATION AND EXTRACTION ... 74
3.1.5PRE-ANALYTICS ... 75
3.1.5.1EFFECT OF SOLVENTS ... 75
3.1.5.2EFFECT OF STORAGE TEMPERATURE ... 81
3.1.5.3EFFECT OF FREEZE/THAW CYCLE ... 93
3.1.5.4EFFECT OF SAMPLE PREPARATION ... 95
3.1.5.5EFFECT OF INTRA-INDIVIDUAL VARIANCE ... 96
3.1.5.6EVALUATION OF BACKGROUND ... 98
3.1.5.7SUMMARY –PRE-ANALYTICS ... 98
3.2. LIPID SPECIES PROFILE OF HUMAN FECAL SAMPLES IN NEGATIVE ION MODE ... 99
3.2.1EVALUATION OF LIPID SPECIES IN PLASMA ... 101
3.2.2EVALUATION OF LIPID SPECIES IN FECES ... 104
3.2.3SUMMARY ... 109
4. CONCLUSION ... 110
5. REFERENCES ... 112 V LIST OF FIGURES ... IX VI LIST OF TABLES ... XI VII ACKNOWLEDGEMENT ... XIV VIII SELBSTSTÄNDIGKEITSERKLÄRUNG ... XV
IILIST OF ABBREVIATIONS
II List of Abbreviations
3PLE Three-Phase Extraction
5-HETE 5-Hydroxyeicosatetraenoic Acid
ALA n-3-α-Linoleic Acid
AGC Automated Gain Control
B&D Bligh and Dyer
BUME Butanol/Methanol Extraction
CE Cholesteryl Ester
Cer Ceramide
CID Collision Induced Dissociation
CL Cardiolipin
CV Coefficient of Variation
DB Double Bond
DC Direct Current
DG Diacylglycerol
DIMS Direct Infusion Mass Spectrometry
DMAPP Dimethylallyl Pyrophosphate
dw Dry Weight
EECs Enteroendocrine Cells
ESI Electro-Spray-Ionization
FA Fatty Acyl
FAME Fatty Acid Methyl Ester
FC Free Cholesterol
FIA Flow-Injection Analysis
FTMS Fourier Transform Mass Spectrometry
FWHM Full Width at Half Maximum
GABA γ-Aminobutyric Acid
GC-MS Gas Chromatography Mass Spectrometry
GI Gastrointestinal
GL Glycerolipids
GluCer Glucosylceramide
GP Glycerophospholipids
HDC Higher-Energy Collisional Dissociation
HexCer Hexosylceramide
IILIST OF ABBREVIATIONS
HILIC Hydrophilic Interaction Liquid Chromatography
HR High Resolution
ICR Ion Cyclotron Resonance
IS Internal Standard
IT Injection Time
IPP Isopentenyl Diphosphate
K2CO3 Potassium Carbonate
LA n-6 Linoleic Acid
LCF Lipid Class Selective Fragment
LCFA Long-Chain Fatty Acids
LC-MS Liquid Chromatography
LIT Linear Quadrupole Ion Trap
LLE Liquid-Liquid Extraction
LOD Limit of Detection
LOQ Limit of Quantification
LPA Lysophosphatidic Acid
LPC Lysophosphatidylcholine
LPE Lysophosphatidylethanolamine
LPI Lysophosphatidylinositol
MA Methylamine
MALDI Matrix-Assisted Laser Desorption
MCFA Medium-Chain Fatty Acid
MG Monoacylglycerol
MLF Molecular Lipid Species Specific Fragment
MRM Multiple Reaction Monitoring
MS Mass Spectrometry
MTBE Methyl-Tert-Butyl Ether
MUFA Monounsaturated Fatty Acid
MW Molecular Weight
m/z Mass-to-Charge Ratio
NEFA Non-Esterified Fatty Acyl
NL Neutral Loss
NMR Nuclear Magnetic Resonance
PA Phosphatidic Acid
IILIST OF ABBREVIATIONS
PBS Phosphate Buffer Saline
PC Phosphatidylcholine
PE Phosphatidylethanolamine
PG Phosphatidylglycerol
PI Phosphatidylinositol
PK Polyketides
PR Prenol Lipids
PS Phosphatidylserine
PRM Parallel Reaction Monitoring
PUFA Polyunsaturated Fatty Acid
QqQ Triple Quadrupole Mass Analyzer
RF Radio Frequency
RT Room Temperature
S1P Sphingosine-1-Phosphate
SCFA Short-Chain Fatty Acid
SD Standard Deviation
SDS Sodium Dodecyl Sulfate
SL Saccharolipids
SM Sphingomyelin
sn Stereospecific Numbering
SP Sphingolipids
SPE Solid-Phase Extraction
SRM Selected Reaction Monitoring
ST Sterol Lipids
TG Triacylglycerol
TMA Trimethylamine
TOF Time-of-Flight
IIIZUSAMMENFASSUNG
III Zusammenfassung
Für die menschliche Gesundheit sowie auch für Krankheiten spielt das Darmmikrobiom eine wichtige Rolle. Fäkalien spiegeln dabei die mikrobielle Aktivität wider. Die Analyse der fäkalen Metaboliten liefert daher Einblicke in die metabolischen Wechselwirkungen zwischen Darmmikrobiota und Wirtsorganismus.
In dieser Arbeit wird die Entwicklung einer Fließ-Injektion-Analyse beschrieben, welche mit einer Fourier-Transform-Massenspektrometrie-Messung (FIA-FTMS) gekoppelt ist, um Lipidspezies in menschlichen Fäkalien mit einem hohen Probendurchsatz zu identifizieren und quantifizieren. Fäkale Homogenate wurden gemäß dem Protokoll von Bligh und Dyer einer Lipidextraktion unterzogen und mittels FIA-FTMS analysiert.
Die Methode wurde an einer Q Exactive hybrid Orbitrap mit einer maximalen Auflösung von 140,000 bei m/z 200 entwickelt. Kurze Messzeiten von weniger als vier Minuten und eine automatisierte Datenauswertung unter Verwendung der ALEX-Software und selbstprogrammierter Makros in Microsoft Excel ermöglichten einen hohen Probendurchsatz.
Die Analyse von Fäkalien verschiedener Probanden ergab eine große Heterogenität der Lipidkonzentrationen. In der Mehrzahl der Proben wurden Triacylglycerin- (TG) und Diacylglycerin-Spezies (DG) detektiert, welche durch MS2-Spektren verifiziert werden konnten. Daher konzentrierte sich die Quantifizierung hauptsächlich auf diese beiden Lipidklassen. Die Methodenvalidierung umfasste Experimente zur Nachweisgrenze, Linearität, Bewertung von Matrixeffekten, Wiederfindung und Reproduzierbarkeit. Die durchgeführten Validierungsexperimente zeigten eine gute Reproduzierbarkeit, mit Ausnahme von etwa 10% der Proben, bei welchen ein CV von mehr als 15% beobachtet wurde. Die beeinträchtigte Reproduzierbarkeit war auf die Probeninhomogenität zurückzuführen und konnte auch durch zusätzliche Probenvorbereitungsschritte nicht verbessert werden. Zudem zeigten diese Experimente höhere Mengen an DG-Spezies, wenn die Proben in 2-Propanol statt in wässriger Lösung homogenisiert wurden, was sich vermutlich auf die Lyse von Bakterien und eine erhöhte TG-Lipolyse zurückführen lässt. Diese Effekte waren probenspezifisch und untermauerten die hohe Heterogenität der fäkalen Materialien sowie die Notwendigkeit einer weiteren Evaluierung der präanalytischen Bedingungen.
IIIZUSAMMENFASSUNG
Eine Messung im negativen Ionenmodus durch Zugabe von Methylamin ergab nur sehr niedrige Signale für Lyso-Phospholipide und Glycerophospholipide, welche nicht verifiziert werden konnten. Hieraus lässt sich schließen, dass für die Analyse dieser Lipidklassen empfindlichere Methoden wie z.B. LC-MS benötigt werden.
Zusammenfassend konnte gezeigt werden, dass FIA-FTMS ein schnelles und genaues Verfahren zur Quantifizierung von DG- und TG-Spezies darstellt, welches geeignet ist, einen Einblick in das fäkale Lipidom zu geben und dessen Rolle in Gesundheit und Krankheit zu entschlüsseln.
IVABSTRACT
IV Abstract
The intestinal microbiome plays an important role in human health and disease and fecal materials reflect the microbial activity. Thus, analysis of fecal metabolites provides insight into metabolic interactions between gut microbiota and host organism.
In this work, we applied flow injection analysis coupled to Fourier transform mass spectrometry (FIA-FTMS) to identify and quantify lipid species in human fecal samples in high throughput. Fecal homogenates were subjected to lipid extraction according to the protocol by Bligh and Dyer, and analyzed by FIA-FTMS. The method was developed using a Q Exactive hybrid Orbitrap with a maximum resolution of 140,000 at m/z 200, a short analysis time of less than four minutes and an automated data evaluation using the ALEX software and self-programmed macros in Microsoft Excel.
The analysis of different subjects revealed a vast heterogeneity of lipid species abundance. The majority of samples displayed prominent signals of triacylglycerol (TG) and diacylglycerol (DG) species that could be verified by MS2 spectra. Therefore, we focused on the quantification of TG and DG. Method validation included limit of quantification, linearity, evaluation of matrix effects, recovery, and reproducibility. The validation experiments demonstrated the suitability of the method, with exception of approximately 10% of samples in which we observed CVs higher than 15%. Impaired reproducibility was related to sample inhomogeneity and could not be improved by additional sample preparation steps. Additionally, these experiments demonstrated that, compared to aqueous specimens, samples containing isopropanol showed higher amounts of DG, presumably due to lysis of bacteria and increased TG lipolysis. These effects were sample-specific and substantiate the high heterogeneity of fecal materials as well as the need for further evaluation of pre-analytic conditions.
Despite optimization of ionisation by addition of methylamine FIA-FTMS of fecal lipid extracts in negative ion mode revealed low signals for lyso-phospholipids and glycerophospholipids that could not be verified. This suggests that analysis of these lipid classes requires more sensitive methods like LC-MS.
In summary, FIA-FTMS offers a fast and accurate tool to quantify DG and TG species and is suitable to provide insight into the fecal lipidome and its role in health and disease.
1.INTRODUCTION
1. Introduction
Lipids are an important class of biomolecules in living organisms. Due to their hydrophobic nature, lipids provide the ability to separate living entities from their natural surroundings. They originate entirely or in part from carbocation-based condensations of isoprene units and/or from carbanion-based condensations of thioesters (1). The lipid species possess different aliphatic chains and various polar head groups which are differentially connected to the head groups. The aliphatic chains of lipids vary in the number of carbon atoms, degree of unsaturation, location of double bonds, and potential branches (2). Besides the important function of energy storage, lipids serve as building blocks in cellular and subcellular membranes, and as signaling molecules (3). Cellular lipids are very dynamic and highly complex. At the level of attomole to nanomole of lipids per mg of protein tens to hundreds of thousand possible molecular lipid species could be present in the cellular lipidome (4). Therefore, the reliable and accurate quantification of lipid species is important (5). Since lipids play a crucial role in many biological processes, any imbalance in sensing and signaling pathways can cause cardiovascular disease, neurodegenerative diseases, and type 2 diabetes mellitus by promoting atherosclerosis and chronic inflammation (6, 7). Additionally, lipids are involved in basic processes essential for tumor development, for example, cell growth, proliferation, differentiation, and motility (8).
Lipids play a role in the last step of the “omic” cascade in which metabolome is gradually developed from genome via transcriptome and proteome (9). Lipidomics, a subgroup of metabolomics, is a relatively new disciplinary research field due to the inherent chemical complexity of the lipidome and the consequent challenges associated with analysing it (10). Within the last decade, the number of publications has increased rapidly, by a factor of 7.7 according to Web of Science, which makes it one of the fastest growing research fields (10). Lipidomics has recently emerged because of rapid advances in developing new mass spectrometric protocols and techniques due to its sensitivity and specificity (11). Therefore, dynamic changes of lipids during physiological or pathological processes can be determined by analyzing lipid structures, mass levels, cell functions, and interactions in a spatial and temporal fashion (2). Over the last decades, several mass spectrometric lipidomic methods with clinical and scientific application have been adapted (12-14).
1.1LIPID CATEGORIES
1.1 Lipid Categories
Lipids, a heterogeneous pool of compounds, contain either fatty acyl/alkyl, sphingosine, or isoprene moieties as their hydrophobic building block. Lipid Maps consortium has classified lipids into eight categories in 2005. Based on the publication of Fahy et al. (1), lipid species are divided into following categories: fatty acyls (FA), glycerolipids (GL), glycerophospholipids (GP), sphingolipids (SP), sterol lipids (ST), prenol lipids (PR), saccharolipids (SL), and polyketides (PK). Sterol and prenol lipids are derived from the condensation of isoprene subunits, whereas other lipid classes are synthesized from ketoacyl subunits (15). Each of the eight lipid categories comprises further lipid classes and subclasses.
Figure 1.1: Examples of the eight lipid categories according to the International Lipids Classification and Nomenclature Committee. Reprinted with permission from Springer Nature and Creative Common Attribution 4.0 International License (http://creativecommons.org/licenses/by/4.0/). Copyright Züllig, T.; Trötzmüller, M.;
Köfeler, H.; 2020 (16).
This chapter will briefly introduce the mammalian lipid categories FA, GL, GP, SP, and ST (Figure 1.1).
1.1LIPID CATEGORIES
1.1.1 Fatty Acyls
Fatty acyls (FA) are carboxylic acids, which consist of a hydrocarbon chain and a terminal carboxyl group (17). They are synthesized by chain elongation of acetyl-CoA with a malonyl-CoA or methylmalonyl-CoA group (1), which imparts a hydrophobic character to the overall structure. Whereas most saturated and monounsaturated fatty acyls can be synthesized by human themselves, most polyunsaturated fatty acyls need to be obtained through diet, e.g. n-6 linoleic acid (LA) and n-3 α-linoleic acid (ALA) (18). Fatty acyls serve both as energy storage and building blocks for complex lipids, e.g. as components of glycerophospholipids. Their biological activities influence a range of processes and functions in living organisms, cell and tissue metabolism, and responsiveness to hormonal signals. Additionally, as components of glycerophospholipids fatty acyls regulate membrane structure and as oxidized products they control intracellular signaling pathways and gene expression (19).
Through these effects, they form a key category of metabolites and influence all aspects in health and disease (19, 20). Depending on their chemical structure, fatty acyls can be divided into different subclasses, for example fatty alcohols or fatty esters.
Fatty acids, which include saturated and unsaturated species, represent one of the most common subclasses of fatty acyls. Furthermore, they can be classified according to their number of carbon atoms and number, position, and stereochemistry of the double bonds. In principle, FAs are classified according to their number of carbon atoms and double bonds. Short-chain fatty acids (SCFA) contain less than 6 carbons, medium-chain fatty acids (MCFA) possess between 6 and 12 carbons, and long-chain fatty acids (LCFA) consist of more than 12 carbon atoms. The degree of unsaturation depends on the number of double bonds. FA species are described as being unsaturated when they have no double bond, whereas monounsaturated FAs contain one double bond, and polyunsaturated FAs have multiple double bonds. In mammals most common fatty acids are even numbered and saturated or monounsaturated fatty acids with chain lengths of 16, 18, and 20 carbon atoms (21). However, species with 2 to 36 carbon atoms, including odd-numbered species, can also be found in nature (22).
Two examples are shown in Figure 1.2.
1.1LIPID CATEGORIES
Figure 1.2: Structures of FA 18:2 and 5-HETE from LIPID MAPS®.
Catabolism of FA by β-oxidation converts long-chain fatty acids into two-carbon acetate which is introduced into the citric acid cycle as acetyl-coenzyme A (acetyl-CoA) for energy production (23). Fatty acid metabolism plays an important part in meeting the energy demands of the heart, for example in promoting cardiac pathologies or protecting the heart from cardiovascular disease (24). Besides that, dysregulation of the fatty acid homeostasis can lead to atherosclerosis and various types of cancer.
This is often related to an uncontrolled endogenous palmitic acid biosynthesis (25).
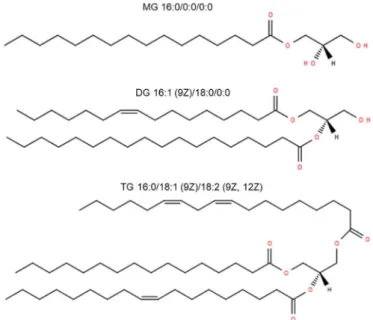
1.1.2 Glycerolipids
Glycerolipids (GL) are a structurally heterogeneous group of lipids that can be categorized into different classes depending on the esterification of fatty acyls with glycerol. In each of these classes, several subclasses exist due to the differences in their ether or acyl linkage, thus leading to a very high number of molecules. All species have at least one hydrophobic chain which is linked to a glycerol backbone in an ether or ester linkage (26). Depending on the esterification of one, two or three fatty acyls with glycerol, the lipid classes are referred to monoacylglycerol (MG), diacylglycerol (DG), and triacylglycerol (TG), respectively (20). The structures of these lipid classes are shown in Figure 1.3.
1.1LIPID CATEGORIES
Figure 1.3: Structures of mammalian glycerolipid species MG 16:0, DG 34:1 and TG 52:3 from LIPID MAPS®.
Glycerolipids play prominent roles in physiology and human disease; they are associated with fat storage, metabolic disorders, and cancer survival (27). Whereas there is only little information available on the function of MG, DG is a neutral lipid involved in the synaptic vesicle cycle (28) and in the formation of membranes (29).
Additionally, post prandial hyperlipidemia, a risk marker for cardiovascular disease, is known to be improved by DG species (30).
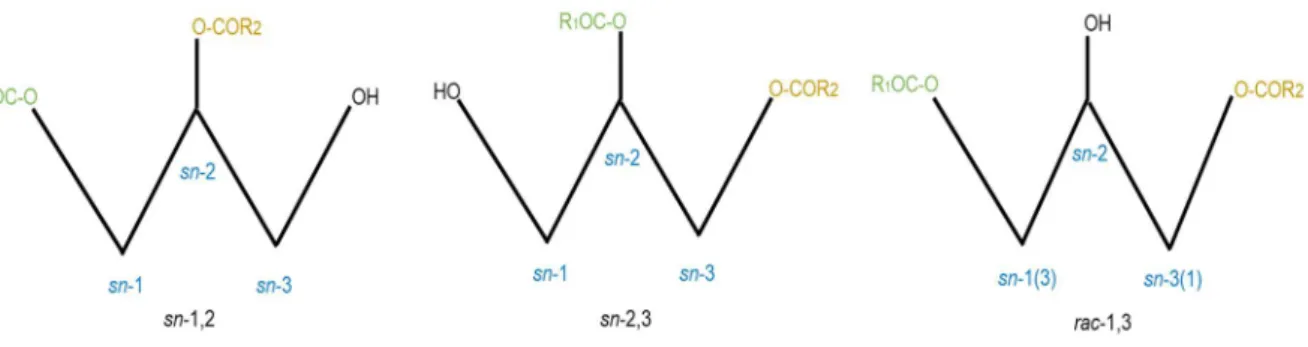
The chemical structure of DGs is versatile. Two (different) fatty acids are esterified to the glycerol backbone and can occur as three different stereo- or regioisomers, either at sn-1/2, sn-2/3 or rac-1/3 position, respectively (31). A schematic depiction of the different regioisomers is shown in Figure 1.4. Depending on the fatty acid species esterified to sn-1 or sn-3, DGs can be achiral or chiral. They are termed as achiral when two identical fatty esters are bound to these positions. If two different fatty acids are attached to the glycerol backbone, DG is chiral (31). Due to the stereochemical nature of DG isomers, the species have different metabolic and nutritional characteristics (32). Several studies demonstrated the physiological and anti-obesity effects, in particular of 1,3 DG (33, 34). As such, DG has shown to reduce both body weight and visceral fat mass (35). Due to the ability of these lipid species to suppress both obesity and post prandial hyperlipidemia, DGs have been increasingly incorporated into food products (36, 37).
1.1LIPID CATEGORIES
Figure 1.4: Schematic depiction of the different forms of regioisomers of diacylglycerol.
Reprinted with permission from Creative Common Attribution 4.0 International License (http://creativecommons.org/licenses/by/4.0/). Copyright Eichmann, T.; Lass, A.; 2015 (31). Illustration has been modified.
In adipose tissue of higher eukaryotes TGs serve as the major energy storage molecule (38), since they provide much more energy during oxidation than carbohydrates or proteins (39). In addition to storing energy, the synthesis of TGs protects the cell from the potentially toxic effects of excess FA. However, excessive accumulation of TGs is associated with human diseases, such as diabetes mellitus, obesity, and hepatic steatosis. Triglycerides mainly exist as triacylglycerol species in nature, however, there is also a small amount of ether-linked triglyceride species (40), which do not only differ in chain length and degree of saturation but also in chemical and physical properties (41). As already mentioned for the DG species, there are also different stereo- or regioisomers of TG. This species contain a chiral center and, therefore, optical activity, when two primary hydroxyl groups are esterified with different fatty acids (42). However, analysis of TG composition is very challenging due to the tremendous amount of individual species caused by the number of possible FA combinations on the glycerol backbone. The knowledge of the TG structure, especially the fatty acids linked with the glycerol backbone, is of great importance for understanding the lipid metabolism and e.g. the production of food products (43).
Additionally, specific effects on health are obtained, which can be assessed by a deeper insight into the individual TG types. Most remarkably, there is an association between saturated TGs with short carbon chains and insulin resistance (44).
Regarding TGs, many studies mainly deal with fats and oils originating from plants or animals. Composition and structure of TG species determine the functionality of these fats and oils as food ingredients and their physiological effects as part of the human diet (43). Vegetable oils provide 25% of the food calories in industrialized countries (45). Humans consume approximately 90-120 grams of fat per day. More than 95%
1.1LIPID CATEGORIES
are absorbed (46). However, TG species cannot be absorbed directly by the gastrointestinal (GI) tract. Digestion of TG begins in the stomach. Approximately 15%
of the fatty acids from TGs are released by preduodenal lipases, gastric lipase or lingual lipase (47). The absorption of dietary fats mainly takes place in the small intestine. Therefore, the fatty acids at position 1 and 3 of the glycerol backbone must be removed by pancreatic lipase. The resulting FAs and MGs can then be absorbed via active transport and/or diffusion processes by small intestinal enterocytes. After absorption FAs and MGs are then used to synthesize TGs within the enterocytes.
Synthesized TGs are combined with cholesterol, cholesterol esters and apolipoprotein B48 to form chylomicrons (48, 49). Diabetes mellitus, obesity and excessive alcohol consumption can lead to an increase of TGs in the human blood, which is called hypertriglyceridemia. In rare cases hypertriglyceridemia can cause life-threating acute pancreatitis (50).
1.1.3 Glycerophospholipids
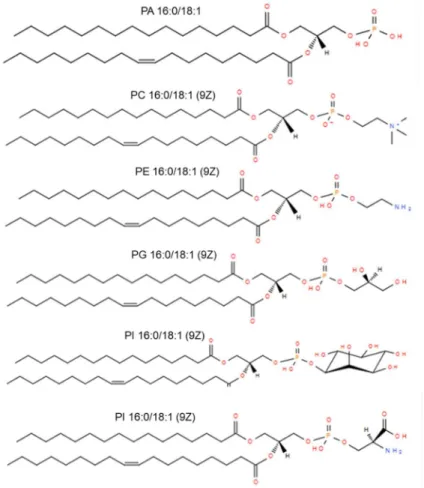
Glycerophospholipids (GPL) are amphiphilic molecules and consist of a hydrophilic head group. This head group is connected by a phosphate ester at one of the terminal positions of the glycerol backbone and one or two hydrophobic fatty acids are ether- or esterified at the remaining hydroxyl positions (51). In all living organisms, GPLs play a key role in cellular membrane and have important functional and structural properties, e.g. as cellular messengers or enzyme activators (42). Due to their different polar head groups, GPLs can be divided into different classes. The main subclasses are phosphatidic acid (PA), phosphatidylcholine (PC), phosphatidylethanolamine (PE), phosphatidylglycerol (PG), phosphatidylinositol (PI), and phosphatidylserine (PS), which are shown in Figure 1.5.
1.1LIPID CATEGORIES
Figure 1.5: Structures of different glycerophospholipid species from LIPID MAPS®.
Glycerophospholipids are also defined by a stereospecific numbering (sn) convention, which indicates the relative positions of head group and acyl chain attachment. The modification of glycerol leads to chirality around the central carbon (52) as it is described for glycerolipids. In eukaryotic cells, the fatty acyl chains are typically attached at the sn-1 and sn-2 positions, whereas the head group is esterified at the sn-3 position of the glycerol backbone. In GPLs, two different fatty acyl chains allow two regioisomers with alternating substitutions at the sn-1 and sn-2 positions. Various studies showed that unsaturated fatty acyl chains were preferably esterified at the sn-2 position (53). However, there is increasing evidence that both sn-positional isomers are frequently present. Different biophysical and chemical properties of regioisomers were observed. Therefore, the research suggests that these isomers have different functions in nature (54). GPLs make up most of the lipids of cell membranes, consisting of a multiplicity of individual protein and lipid species. Usually, these membranes are composed of two layers of lipid molecules and therefore play an important role in determining the physicochemical properties. The GPL composition can be very different for diverse cell types, organelles, and inner or outer membrane leaflets,
1.1LIPID CATEGORIES
respectively (55). The inner side of the outer membrane mainly contains PE, PG, and the respective monoacyl-glycerophospholipids lyso-PE and lyso-PG (56). The introduction of polyunsaturated fatty acids into the glycerophospholipids of the membrane is promoted by the deacylation-reacylation cycle. This process is also known as Lands-Cycle and includes the following enzymes: phospholipase A2, acyl- CoA lysophospholipid acyltransferase, acyl-CoA synthetase, and acyl-CoA hydrolase (57).
1.1.4 Sphingolipids
The lipid class of sphingolipids (SP) is defined by a long chain sphingoid base which may be linked to a fatty acid at C2 position via an amide bond. Sphingoid base d18:1 is the most common of these backbones in mammalian cells. It varies in chain length, degree of saturation (58, 59) and number of hydroxyl groups (60), e.g. sphinganine ((2S,3R)-2-aminooctadecane-1,3-diol, which is fully saturated, and phytosphingosine ((2S,3S,4R)-2-aminooctadecane-1,3,4-triol), which is also fully saturated and has a third hydroxy group (58, 59).
The simplest class of SP are ceramides (Cer) which are formed by adding an acyl chain to the amino group of the sphingoid base. Sphingolipids can also be distinguished by the type of head group that replaces the hydroxyl group of the carbon in the 1-position (61). Phosphosphingolipids, for example, contain a phosphodiester bond at the head group and glycosphingolipids a β-glycosidically bonded sugar, whereas sphingomyelin (SM) is generated by the addition of a phosphocholine head group (62). Thus, sphingomyelins (SM), ceramides (Cer), and hexosylceramides (HexCer) differ by their head groups but frequently contain a dihydroxy C18 sphingosine base (62) (Figure 1.6).
C16-, C18-, and C24-ceramides are most commonly found in mammals. They provide a variety of unique properties (61, 63, 64), e.g. they serve as precursors to form either phosphor- or glycosphingolipids by adding diverse head groups. Ceramides are hydrophobic lipids which increase the molecular order of phospholipid-containing membranes (65) although they are only minor components within these membranes (66). In the Golgi apparatus ceramides can be converted into SM or glucosylceramide (GlcCer) (61). Sphingolipids play an important role in cell signaling and plasma membrane structure. They comprise a broad spectrum of complex lipids and represent one of the most important lipid classes in eukaryotic cells (67).
1.1LIPID CATEGORIES
Whereas sphingosine-1-phosphate (S1P), for example, plays a crucial role in cell survival, cell migration or inflammation (68), Cers mediate many cellular stress response including the regulation of apoptosis (69) and cell senescence (70). Various biological processes are regulated by sphingolipids, including growth, invasion, migration, proliferation and/or metastasis. In the latter case, signaling function can be controlled within the cancer cell signal transduction network (71, 72). Ceramide and sphingosine formation can be induced by chemotherapy, radiation and/or oxidative stress (73). Irregular intracellular apoptotic signal transduction can cause changes in the levels of individual sphingolipids and thus it can trigger such disease states (74).
Figure 1.6: Examples of mammalian sphingolipids from LIPID MAPS®.
1.1.5 Sterol Lipids
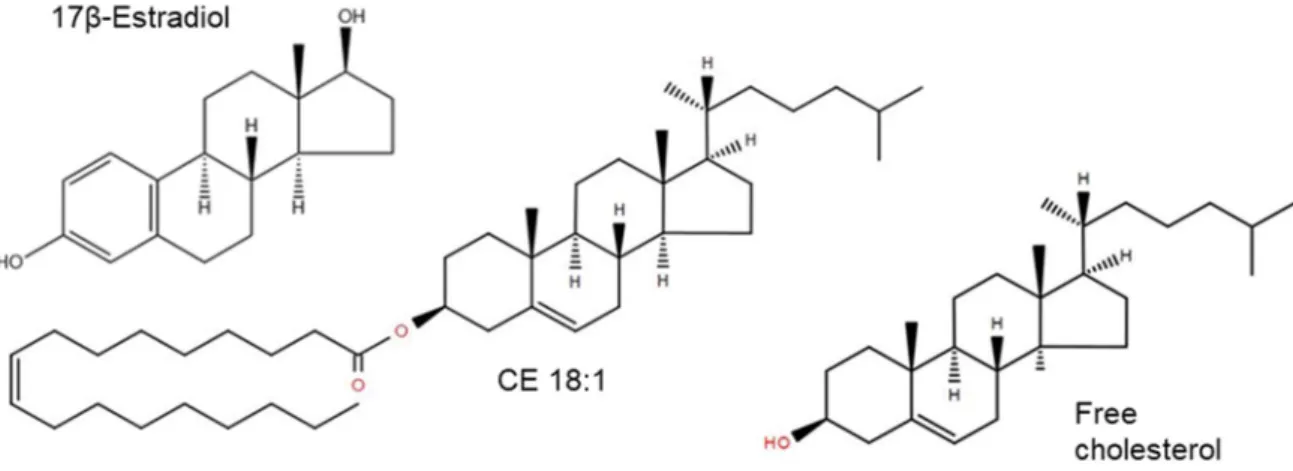
Sterols (ST) are isoprenoid-derived amphipathic biomolecules which play important physical and structural roles in eukaryotic cells (75) and thus provide valuable insights into the evolution of life (76). All sterols have a common structure which consists of a tetracyclic cyclopenta(a)phenanthrene nucleus. Furthermore, some sterols are connected to carbon 17 via a side chain (76). Sterol synthesis involves the polymerization of the precursors isopentenyl diphosphate (IPP) and dimethylallyl pyrophosphate (DMAPP) (75).These lipids can be categorized in sterols, steroids, steroid conjugates, secosteroids and bile acids. The most common sterols in plants are phytosterols, e.g. campesterol, stigmasterol or sitosterol. In animals and yeast cholesterol and ergosterol are predominant (77) (Figure 1.7), respectively. With few exceptions (78, 79), sterols are found exclusively in eukaryotes. They are involved in various cell functions, e.g. in membrane fluidity and structure, developmental regulations or as precursors of hormone and signal molecules.
1.1LIPID CATEGORIES
Figure 1.7: Exemplary species of sterol lipid species from LIPID MAPS®.
Cholesterol, which is especially important in mammalian cells, consists of 27 carbon atoms. Modification of the side chain or the nucleus allow a variety of different structures (76). Cholesterol occurs mainly as cholesteryl esters (CE) which are stored in lipid droplets or transported in lipoprotein particles, and as non-esterified free cholesterol (FC) in membranes (80). Cholesterol is primarily synthesized from acetyl- CoA by sequential enzymatic reactions in tissues, especially the liver, adrenal gland, brain, ovary, and testis (81). Hydrogenation of sterols leads to the formation of stanols, usually by microbes either in animal gastrointestinal tract or in the environment (82, 83). Due to their low water solubility and their ability to bind to organic material, 5β-stanols are particularly useful as direct biomarkers for animal feces (84). The so- called stanol fingerprint, i.e. its distribution in the fecal material, identifies a certain mammalian species on the basis of various processes, including the basis of their diet (primary sterol intake), the ability to biosynthesize endogenous sterols (secondary sterol intake) and the way how they biohydrogenate sterols and convert them into stanols with the help of bacteria of the digestive tract (85). Furthermore, a distribution of microbial cholesterol-to-coprostanol conversion in human populations is bimodal, with a minority of low metabolizers and many high metabolizers, i.e. almost complete cholesterol conversion. The efficiency of cholesterol conversion is mainly dependent on the abundance of cholesterol-lowering bacteria (86). In addition, a correlation between cholesterol-lowering activity in the human gut and the overall structure of fecal microbial community has been established (87).
1.1LIPID CATEGORIES
1.1.6 Nomenclature
In this work, lipid nomenclature is based on a comprehensive classification system for lipids presented by the Nomenclature Committee and International Lipid Classification in 2005 (1), which was updated in 2009 (88). Practical shorthand notation of lipid structures derived from mass spectrometry (MS) approaches have been developed in 2013, which enables correct and concise reporting of data and their deposition in several databases (89). The simplest way of describing the structure is to write the total number of carbons followed by the total number of double bonds. For example, DG 36:2 describes the lipid class (DG, diacylglycerol), whereas the total number of carbon atoms is 36 and the total number of double bonds is 2 in the acyl chains. This notation is used as a sum formula and gives no information about the exact composition of the fatty acyl chains. To further specify this, various acyl combinations are possible, for example DG 18:1_18:1 and DG 18:0_18:2 without specification of sn positions using “_” as previously proposed (89). If the sn positions of the fatty acyls are known, this would be expressed with the separator “/”, e.g. DG 0:0/18:0/18:2 or DG 0:0/18:2/18:0 (sn-1 / sn-2 / sn-3). By using high-resolution mass spectrometry, it is possible to obtain a separation between ester bonds and other bond types. An ether bond, for example, is indicated by an “O-” in front of the sum of C-atoms of fatty acyls/alkyls: DG O-36:2. The letter “P” is used for a proven O-alk-1-enyl-bond, i.e. an acid-sensitive ether bond in plasmalogens. More than one “non”-ester bond is indicated in front of the bond type as d for di, t for tri, e.g. DG dO-36:2. Positions are stated according to ∆-nomenclature in front of the functional groups. Double bond position is indicated by a number (geometry unknown) or by the number followed by the geometry (Z for cis, E for trans). There are also different abbreviations for functional groups: “Me-” for methyl branch, “O-” for keto group, and “OH-” for hydroxyl group (89).
1.2PRINCIPLES OF MASS SPECTROMETRY
1.2 Principles of Mass Spectrometry
Many analytical methods have been developed for accurate identification and quantification of lipid species. A common analytical technique is mass spectrometry (MS) which has been established in lipidomics in recent years.
Mass spectrometry is used to quantify known materials, to identify unknown compounds and to clarify the structure and chemical properties of various molecules.
The basic principle of mass spectrometry is to separate and measure ions by their specific mass-to-charge ratio (m/z). These ions are detected qualitatively and quantitatively by their respective m/z and abundance. The instrument consists of three major components: (I) an ion source which produces gaseous ions from the substance, (II) a mass analyzer resolving the ions into their characteristic mass components according to their m/z, and (III) a detector system which detects the ions and records the relative abundance of each species. The most commonly applied methodologies in lipidomics involve electrospray ionization (ESI) sources and triple quadrupole analyzers (90). There are also other types of mass analyzers, for example, magnetic (B) / electric (E) sector mass analyzer, linear quadrupole ion trap (LIT), time-of-flight mass analyzer (TOF), ion cyclotron resonance mass analyzer (ICR), and orbitrap. All these mass analyzers use dynamic or static magnetic or electric fields to separate ions, and operate according to two fundamental physical laws, e.g. Lorentz force law and Newton’s second law of motion (91-93). The analyzers differ by analysis speed, mass accuracy, mass range, mass resolution, and sensitivity.
Mass spectrometry allows to determine the elemental composition, molecular weight and, using MS2, position of branching and the type of substituents in the lipid structure.
Due to its high accuracy, sensitivity, specificity, and throughput, MS has become a preferred method for lipid analysis.
Regarding this thesis, lipid analysis was performed by flow injection Fourier transform mass spectrometry. A hybrid quadrupole Orbitrap mass spectrometer Q Exactive is coupled to a heated electrospray ionization source and a PAL autosampler. The following chapters will describe the applied technique in more detail.
1.2.1 Electrospray Ionization
In recent years, electrospray ionization (ESI) has emerged as an important “soft”
ionization technique which produces intact ions. This technique represents a sensitive, robust, and reliable method for the investigation of large, non-volatile, and thermally
1.2PRINCIPLES OF MASS SPECTROMETRY
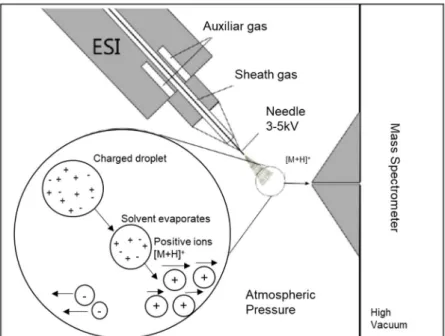
unstable molecules, such as those found in biological systems, e.g. in lipids, peptides, or proteins. The samples can be measured in femto-mol quantities in microliter sample volume. High voltage is applied to spray the sample solution into the gaseous phase by the ESI needle. This process comprises three steps: (I) atomization of a fine spray of charge droplets, (II) solvent evaporation, and (III) ejection of ions from the highly charged droplets (94) (Figure 1.8). The solvent slowly evaporates, often supported by a neutral carrier gas such as nitrogen which increases the surface charge density and reduces the droplet radius. These droplets are continuously dissolved by repulsion of similar charges (“Coulomb explosion”) into smaller droplets as they have reached the Rayleigh limit. Droplets are then electrically charged on the surface. Depending on charge polarity, this leads to the formation of positive or negative ions (95).
Figure 1.8: Schematic illustration of an ESI process. Reprinted with permission from Thermo Fisher Scientific. Copyright 2008 Thermo Fisher Scientific.
1.2.2 Quadrupole Mass Analyzer
One of the mass analyzers used for ESI is a quadrupole mass spectrometer which was invented by Wolfgang Paul in the early 1950s (96). The main principle of ion separation in MS is based on the movement of ions through a magnetic or electric field, whereby the movement is influenced by their m/z ratio. The quadrupole mass analyzer consists of four parallel hyperbolic/circular metal rods. Opposite rods are electrically connected.
A direct current (DC) voltage and a radio frequency (RF) of the same amplitude and
1.2PRINCIPLES OF MASS SPECTROMETRY
sign are applied to the diagonally arranged rods. The rod pairs, however, differ in their polarity. By means of an electric field, the ions are moved forward in the z-direction with an oscillating movement in the x-y-plane. The applied ratio of voltages can be used to control the oscillation amplitude to allow ions of a specific m/z ratio to finally reach the detector. Vibration amplitudes of unwanted ions can be large and unstable.
Hitting the metal rods these ions are neutralized and do not reach the detector, see Figure 1.9. Quadrupole mass analyzers are robust, economical, physically small and can be more easily connected to a variety of inlet systems such as the magnetic sector (94).
Figure 1.9: Schematic illustration of a quadrupol mass analyzer.
1.2.3 Orbitrap Mass Analyzer
The origins of the orbitrap analyzer trace back to the year 1923. Kingdon discovered the principle of orbital trapping by placing a charged wire on a closed cylindrical metal can (97). In the year 2000, Alexander Makarov published the concept of an orbital trapping device for the application in mass analysis. Unlike the previous attempts, the central electrode was not used as a thin wire but as a solid metal electrode (98). The orbitrap mass analyzer essentially consists of three electrodes: two cup-shaped outer electrodes face inwards and a spindle-shaped central electrode is aligned along the axis. The outer electrodes are electrically insulated by a hairline gap which in turn is secured by a dielectric ring. The central electrode holds the trap together and aligns it via the dielectric end-spacer. The applied electric field consists of a quadrupole field of the trap, e.g. a standard trap or a high field compact trap, and an additional logarithmic field of the cylindrical capacitor (99, 100). Applying voltage between the outer and central electrodes, stable ion trajectories induce a harmonic oscillation along the z- axis. The radial component of the field simultaneously pulls the ions towards the central
1.2PRINCIPLES OF MASS SPECTROMETRY
electrode. Ions with the same m/z ratio oscillate in-phase along the z-axis for thousands of oscillations (Figure 1.10).
Figure 1.10: Orbitrap mass analyzer showing a stable spiral trajectory of an ion between the central electrode and the split outer electrodes. Reprinted with permission from Thermo Fisher Scientific. Copyright 2008 Thermo Fisher Scientific.
An ion trap is mounted outside the analyzer to produce stable ions. Using the principle of “electrodynamic squeezing” (101) the ions are captured and enter the trapping field by a steady increase of the electric field strength. The outer electrodes remain at a fixed potential, whereas the potential at the central electrode is lowered. Once the ions enter the field through this potential gate, they cannot escape at the point of entry, as the trapping potential forms a potential barrier until they return to the gate. To ensure the widest possible range of trapped m/z, a rise-time of the field, typically 30 – 50 µs, is chosen (102).
To achieve high mass resolutions orbitrap instruments apply image current detection using Fourier transform Mass Spectrometry (FTMS), using two split halves of outer electrodes for detection and a differential amplifier for amplification. The application of FT determines the frequency of the harmonic oscillations and allows the calculation of the m/z ratios of the subjected ions (103).
1.2.4 Tandem Mass Spectrometry
One of the most used mass analyzers in lipidomics is the triple quadrupole mass analyzer (QqQ), which is commonly used in MS/MS. It consists of three quadrupoles connected in series (Q1 – Q3). The following arrangement is most frequently used: Q1 filters for a specific m/z ratio (precursor ion); Q2, a collision cell, is filled with an inert gas like argon or nitrogen; and Q3 analyses the fragment ions induced by collision with
1.2PRINCIPLES OF MASS SPECTROMETRY
the gas molecules, shown in Figure 1.11. Both Q1 and Q3 can be used either in SIM or scan mode.
Figure 1.11: Schematic illustration of a triple quadrupole mass spectrometer (104).
Modified with permission of Copyright Clearance Center’s Rightslink® service.
Copyright 2014 Elsevier Inc.
The following operation modes are commonly applied: Product ion scan, precursor ion scan, neutral loss scan, and selected reaction monitoring (SRM) or multiple reaction monitoring (MRM). In a product ion scan, a precursor ion is selected in Q1, followed by collision induced fragmentation, whereas Q3 scans for resulting fragment ions. This mode provides largely substance-specific structural information. In a precursor ion scan, the precursor masses are scanned in Q1, a fragment ion is selected in Q3.
Groups of substances with specific characteristic structures or fragmentation reactions can be identified. In a neutral loss mode, Q1 and Q3 are scanned with a fixed offset between both mass analyzers. It can be used to identify all precursor ions with a loss of a defined mass. In selected reaction monitoring, both mass analyzers are set to selected masses (105, 106).
1.2.5 Q Exactive Hybrid Orbitrap Mass Spectrometer
A Q Exactive Orbitrap mass spectrometer combines a high resolution Orbitrap mass analyzer and a high-performance quadrupole for precursor selection.
The Q Exactive hybrid quadrupole Orbitrap mass spectrometer mainly consists of an ion source, a stacked ring ion conductor (S-lens), a bend flatapole, a quadrupole mass filter, a curved linear trap filled with nitrogen (C-trap), a higher energy collisional dissociation (HCD) cell and an orbitrap mass analyzer (Figure 1.12).
The samples can be introduced into the ion source by various methods, while the injection flatapole transfers the ions from the source to the quadrupole. In the C-trap,
1.2PRINCIPLES OF MASS SPECTROMETRY
the kinetic energy of the injected ions dissipates by collision with the nitrogen molecules, bundles them on the trap axis and then injects them orthogonally to the z- axis of the orbitrap mass analyzer to obtain a mass spectrum. Furthermore, the ion bundles can be guided through the C-trap into the HCD cell and perform MS/MS experiments in combination with the quadrupole mass filter.
Figure 1.12: Schematic illustration of a Q Exactive Orbitrap mass spectrometer.
Reprinted with permission from Thermo Fisher Scientific. Copyright 2012 Thermo Fisher Scientific.
To investigate samples in high throughput, shotgun mass spectrometry of biological samples is routinely applied (107). A commonly used technique for all lipidomic approaches is a high-resolution FTMS instrument chip-based nano-ESI (108-111). In this thesis, a Q Exactive hybrid Orbitrap mass spectrometer was used for lipid analysis, using a conventional LC pumping system to infuse raw lipid extracts of feces.
1.2.6 Direct Infusion Mass Spectrometry
In direct infusion mass spectrometry (DIMS), the sample is pumped directly into the mass spectrometer without any prior separation. Therefore, the liquid sample is placed in a syringe. A syringe pump is used to ensure a regular flow of liquid. The injection of a liquid sample into a moving, non-segmented continuous carrier stream of a suitable liquid is called flow injection analysis (FIA) (112). FIA frequently uses an HPLC system that injects the analytes directly into the ionization source of the mass spectrometer
1.2PRINCIPLES OF MASS SPECTROMETRY
without prior chromatographic separation (FIA-MS) (113). Flow injection is coupled to an autosampler (114).
Direct infusion is best suited for pure samples or simple mixtures and should be free of contaminating factors that could otherwise interfere with the measurement, such as high contents of non-volatile salts or detergents. Direct infusion mass spectrometers are often equipped with electrospray ionization. In this process, intact molecular masses of analytes can be detected or fragmented. This facilitates the identification of the so-called “fingerprint” of chemicals and relies on the accurately determined masses on MS level or specific fragment ions in MS/MS spectra (115, 116).
In DIMS, which is also called “shotgun”, the lipid composition and concentration of analytes does not change over time, which simplifies the quantification of the species (6). Advantages of direct infusion are its simplicity, high reproducibility, and the constant electrospray conditions, e.g. matrix, solvent composition, and sample concentration, which could influence the ionization of the analytes without significantly affecting sensitivity, precision, and accuracy (117, 118). However, disadvantages of this technique are the ion suppression effect and the inability to distinguish many isobaric or isomeric species.
1.3MASS SPECTROMETRIC LIPID ANALYSIS
1.3 Mass Spectrometric Lipid Analysis
Analysis of lipids is either based on the separation of different lipid categories by chromatographic separation or on so-called shotgun-Lipidomics which essentially analyze all lipid classes without prior chromatographic separation (119). However, a more detailed elucidation of structural properties of lipids requires the use of MS/MS analysis. This chapter describes the extraction of lipids as well as the fragmentation behavior of DG and TG with respect to the acyl chain and head group elements.
1.3.1 Extraction of Lipids
In Lipidomics it is important to perform an extraction of lipid species to obtain an accurate profile of lipidomes in a sample of interest. Each extraction method serves two main purposes. On the one hand, the complexity of the sample is reduced by eliminating unwanted non-lipid compounds such proteins. A positive side effect is the reduction of impurities, this leads to a less contaminated mass spectrometer and thus to less instrument downtime due to cleaning and maintenance. On the other hand, the lipids of interest accumulate during extraction, which in turn leads to an improved signal-to-noise ratio (16). In principle, there are two different extraction possibilities:
liquid-liquid (LLE) or solid-phase (SPE) extraction. SPE is a very specific sample preparation technique and provides highly enriched samples with low contamination.
However, as the number of analyzed lipid classes increases, this extraction protocol becomes very complex and challenging. If many lipid classes need to be analyzed in high throughput SPE is unsuitable. It can certainly be a useful method if only a few samples with a very high coverage of the lipid species need to be analyzed (16). In contrast, liquid-liquid extraction is the most commonly used sample preparation technique in lipidomics. Organic solvents such as chloroform/methanol (CHCl3/MeOH) or methyl-tert-butyl ether (MTBE) are typically used for this purpose. Two of the most common treatments are based on the protocols by Folch (120) and Bligh and Dyer (121) and consist of a ternary mixture of chloroform, methanol, and water. Other common LLEs are MTBE extraction, single-phase extraction, butanol/methanol extraction (BUME) and 3-phase extraction. Those are listed in Table 1.1.
1.3MASS SPECTROMETRIC LIPID ANALYSIS
Table 1.1: Comparison of different LLEs regarding the extraction solvents used, the phase separation, the type of detectable lipids, and the advantages and disadvantages of the divers extraction methods (16).
Folch Bligh and
Dyer MTBE
Single- Phase
Extraction BUME 3-Phase Extraction
Extraction Solvents
CHCl3, MeOH, H2O
CHCl3, MeOH, H2O
Methyl-tert- butyl ether, MeOH, H2O
MeOH; EtOH;
2-Propanol;
Acetonitrile
BuOH/
MeOH, Hep/Ethyl
acetate, Acetic acid
Hexane, Methyl acetate, Acetonitrile,
H2O Bottom Phase organic organic aqueous
organic
aqueous aqueous
Middle Phase organic
(PC) Upper Phase aqueous aqueous organic organic organic
(TG) Detectable
Lipids saturated
fatty acids saturated fatty acids
GPL, Cer, saturated fatty
acids polar lipids like Folch neutral and polar lipids
Advantages high extraction efficiency
high extraction
efficiency
straightforward operation, MTBE less
harmful
fast and robust
high throughput
screening in 96-well plates
separate analysis runs, higher identification
rate
Disadvantages
harmful due to CHCl3
harmful due to CHCl3
higher instrument contamination
greater ion suppression
effect
1.3.2 Mass Spectrometric Analysis of Lipids
Over the last decades several mass spectrometric lipidomic methods with scientific and clinical application have been developed (12-14). A common way to reduce the complexity of lipid extracts for MS-based approaches is to use chromatographic separation, especially gas (GC) and liquid chromatography (LC) (122-124). Shotgun lipidomics, as described above, is a direct infusion-based approach without any separation prior mass spectrometric analysis. The development of high-resolution mass spectrometry led to an increasing interest in the application on MS level. The technical simplicity and rather short measurement times allow the detection of several lipid classes in a single analysis. Nowadays, shotgun MS analysis of biological samples is routinely used for high-throughput analysis of samples (107).
1.3MASS SPECTROMETRIC LIPID ANALYSIS
A detailed structural analysis of the lipid species requires MS/MS analysis using a tandem mass spectrometer. This is a very helpful and informative technique with respect to the acyl chain and head group elements for most lipid classes (125-127).
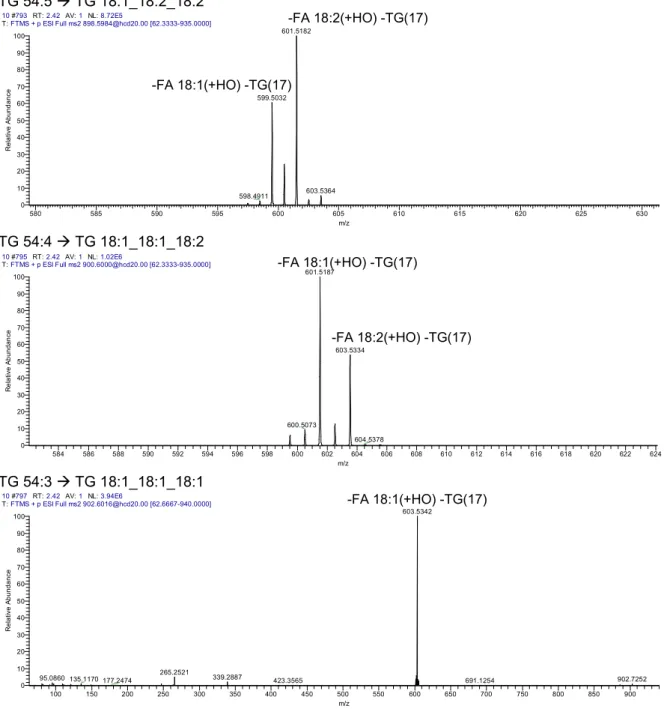
Collision Induced Dissociation (CID) of ammonium adducts [M+NH4]+ of diacylglycerol and triacylglycerol in positive ion mode results in fragment ions corresponding to the loss of 17,0266 Da (i.e. the loss of ammonia) combined with a charge-remote loss of FA moieties as fatty acids (RCOOH + NH3), e.g. FA 16:1 has a neutral loss (NL) of m/z 271, FA 18:1 a neutral loss of m/z 299 and FA 18:0 a NL of m/z 301. These ions provide information about the acyl composition of both lipid classes and therefore are denoted as molecular lipid fragments (MLF) (128). For DG species a NL of water together with ammonia from an [M+NH4]+ ion is typical and denoted “-DG(35)” as lipid class selective fragment (LCF) (129) (Figure 1.13).
Figure 1.13: Fragmentation of diacylglycerol (a) and triacylglycerol (b) regarding their acyl chain composition. The dotted lines indicate the most labile bonds from which fragmentation most frequently occurs.
Displayed are a) DG with two acyl chains and one OH group (here 1,3 DG) and b) TG comprising three acyl (FA1 to 3) chains.
1.4LIPID ANALYSIS OF FECES
1.4 Lipid Analysis of Feces
In recent years, the interest in intestinal microbiome as well as the analysis of lipids in feces has increased significantly. The intestinal microbiome actively influences host functions and therefore plays an important role in human health and disease.
Homogenization of fecal samples is of great importance for lipid analysis, as the sample material is very heterogeneous and thus more difficult to analyze. In this chapter, microbiome, feces, and homogenization are described in detail.
1.4.1 Microbiota and Feces
The human body, including the intestine, skin and other mucosal environments, is colonized by an enormous number of commensal, symbiotic and pathogenic microorganisms, collectively referred to as microbiomes, and is estimated to consist of 3 × 10¹³ eukaryotic cells and 3.9 × 10¹³ colonizing microorganisms (130). These microorganisms contain trillions of microbes with more than 700-1000 different species of bacteria in the intestine (131). It is estimated that 10 different phyla contribute to the functional role of the intestinal microbiome, with Firmicutes and Bacteroidetes being the most dominant phyla. The neutral pH and the weakly basic environment make the large intestine the most densely populated area of bacteria in the GI tract, with approximately 1012 bacteria/g. In the less acidic small intestine, on the other hand, only 103 bacteria/g can be found (132).
It is now generally accepted that the gastrointestinal system, in particular the intestinal microbiome, actively influences host functions including nutritional responses, immunity, medication, and metabolism, and thus plays an important role in human health and disease (133). Microbial activity is reflected in fecal materials that contain unabsorbed metabolites including lipid species. Consequently, analysis of fecal metabolites provides an estimate of metabolic interaction between gut microbiota and host (134). These microbe-host interactions are impaired by the intestinal microbial ecosystem resulting from changes in lifestyle during industrialization, including important shifts in dietary habits, improved hygiene, and access to medication (e.g.
antibiotics) (135). To identify subtle metabolic variations induced by dietary alterations and to characterize the metabolic impact of variations of the gut microbiota, metabolic profiling gained increasing interest over the last decade.
The intestinal microbiome can influence human behaviour through a bi-directional communication pathway between the GI tract and the central nervous system, namely
1.4LIPID ANALYSIS OF FECES
the intestinal-brain axis. This is achieved by a microbiome-mediated production of molecules, such as serotonin and γ-aminobutyric acid (GABA), which have neuroactive effects. Along the GI tract there are nutrient receptors and enteroendocrine cells (EECs) that interact with microbial metabolites. For mechanisms such as the regulation of appetite and insulin secretion, the interactions with EEC receptors are crucial (136).
Recent studies show that bacterial proteins act locally in the intestine with a short-term effect on saturation and thus influence the appetite-regulating pathways (137).
Feces are composed of water, proteins, bacterial biomass, fat, and indigestible food components, e.g. fibres. Fat contained in feces is a heterogeneous mixture of different lipids; it constitutes 8-16% of the dry weight of the feces (138-140) and 2-8% of the wet weight (141-145). Fat found within feces originates from bacteria as well as from the undigested remains of dietary lipids (146). Non-/esterified fatty acids represent approximately 60-70% of this fat, unsaponifiable material accounts for 20-30% (147).
1.4.2 Lipid Analysis of Fecal Samples
Human feces contain, depending on diet and metabolism, different amounts of triacylglycerol (TG) and diacylglycerol (DG). This has been frequently studied in the context of steatorrhoea (148)and colon cancer (149).
Homogenization is an important step in processing tissue samples, cells or feces.
Whereas homogenization is not a problem for bioliquids, it is currently still a challenge for solid sample material. Homogenization makes lipids from all parts of the sample material accessible to extraction solutions. Limited solvent accessibility of the samples can result in significantly distorted lipid profiles (16). The homogenization of feces is still difficult at this stage. An accepted protocol does not exist yet. Different working groups vortex the sample material in phosphate buffer saline (PBS) (150), whereas others homogenize for example with the help of bead beating (151). Homogenization is a prerequisite for optimal lipid extraction and is often performed manually (152).
Lipidomic methods nowadays offer a wide range of possibilities to analyze lipid species profiles of biological materials (153). However, only a few methods are available to study the lipidome of fecal material (134, 154, 155). Most of the described approaches focus on the identification and quantification of selected lipid classes like fatty acids (156, 157), bile acids (158), and sterols (124). In this thesis we evaluate and validate a method for identification and quantification of DG and TG species of human fecal