P olicy R eseaRch W oRking P aPeR 4584
Pitfalls of Participatory Programs:
Evidence from a Randomized Evaluation in Education in India
Abhijit V. Banerjee Rukmini Banerji
Esther Duflo Rachel Glennerster
Stuti Khemani
The World Bank
Development Research Group
Human Development and Public Services Team March 2008
i
mPacte
valuations
eRiesn
o. 21
WPS4584
Public Disclosure AuthorizedPublic Disclosure AuthorizedPublic Disclosure AuthorizedPublic Disclosure Authorized
Abstract
The Impact Evaluation Series has been established in recognition of the importance of impact evaluation studies for World Bank operations and for development in general. The series serves as a vehicle for the dissemination of findings of those studies. Papers in this series are part of the Bank’s Policy Research Working Paper Series. The papers carry the names of the authors and should be cited accordingly. The findings, interpretations, and conclusions expressed in this paper are entirely those of the authors. They do not necessarily represent the views of the International Bank for Reconstruction and Development/World Bank and its affiliated organizations, or those of the Executive Directors of the World Bank or the governments they represent.
Policy ReseaRch WoRking PaPeR 4584
Participation of beneficiaries in the monitoring of public services is increasingly seen as key to improving their efficiency. In India, the current government flagship program on universal primary education organizes community members, specifically locally elected leaders and parents of children enrolled in public schools, into committees and gives these powers over resource allocation, monitoring and management of school performance. However, in a baseline survey this paper finds that people were not aware of the existence of these committees and their potential for improving education.
The paper evaluates three different interventions to encourage beneficiaries’ participation: providing information, training community members in a new
This paper—a product of the Human Development and Public Services Team, Development Research Group—is part of a larger effort in the department to understand how to make services work better for the poor. Policy Research Working Papers are also posted on the Web at http://econ.worldbank.org. The author may be contacted at skhemani@worldbank.
org.
testing tool, and training and organizing volunteers to hold remedial reading camps for illiterate children. The authors find that these interventions had no impact on community involvement in public schools, and no impact on teacher effort or learning outcomes in those schools. However, the intervention that trained volunteers to teach children to read had large impact on activity outside public schools -- local youths volunteered to be trained, and children who attended these camps substantially improved their reading skills. These results suggest that citizens face substantial constraints in participating to improve the public education system, even when they care about education and are willing to do something to improve it.
Pitfalls of Participatory Programs:
Evidence from a randomized evaluation in education in India
Abhijit V. Banerjee (MIT) Rukmini Banerji (Pratham)
Esther Duflo (MIT) Rachel Glennerster (MIT) Stuti Khemani (The World Bank)
*This study was undertaken as a collaboration among Pratham Mumbai Education Initiative (Pratham), MIT Abdul Lateef Jameel Poverty Action Lab, and the World Bank, and thus involves the participation of many people from these institutions. We would especially like to thank Dan Keniston, Sanjib Kundu, and Mukesh Prajapati for implementation, and Marc Shotland for managing the project. We thank Dhruva Kothari and Jacqueline Merriam for excellent research assistance. We thank Amit Dar, Jishnu Das, Dipak Dasgupta, Shanta Devarajan, Venita Kaul, Reema Nayar, Priyanka Pandey, Lant Pritchett, Michelle Riboud, V. J. Ravishankar, Shekhar Shah, Venki Sundararaman, and Salman Zaidi of the World Bank for numerous discussions and comments on the project.
We thank the Trust Fund for Environmentally and Socially Sustainable Development (TFESSD) and the DIME initiative at the World Bank for the funding to undertake the surveys and analysis. The findings, interpretations, and conclusions expressed in this paper are entirely those of the authors, and do not necessarily represent the views of the World Bank, its Executive Directors, or the countries they represent.
1. Introduction
The deplorable state of publicly provided social services in many developing countries has attracted considerable attention in recent years, from academics and policy makers alike. The 2004 World Development Report “Making Services Work for Poor People" details the dismal quality of education and health services offered to the poor in developing
countries, and concludes that “social services fail the poor” (World Bank, 2004). Both sectors are plagued by high provider absenteeism, little on-the-job effort from those who do come to work, and overall poor performance. For example,
teachers in primary schools and medical staff at primary health centers in India have absence rates of 25 percent and 40 percent, respectively (Chaudhury et al., 2006). 1 In India’s public education system, these problems are manifest in the failure of the public schools to impart even the most elementary skills. A 2005 nationwide rural survey on educational attainment of 7-14 year olds found that, even though most children are enrolled in school, 35 percent of primary school age children could not read a simple paragraph, and 41 percent could not do simple subtraction, competencies that should, according to government guidelines, be achieved by grade 2 (Pratham, 2005).
Inadequate funding does not appear to be the only reason for the systems’ poor performance. In fact, in the case of education, rigorous, randomized evaluations have found little evidence that more resources on their own, with no changes to the way education is delivered, can improve test scores.2 In contrast, studies have found improvements in outcomes when modest incentives have been given to teachers (see e.g., Duflo, Hanna and Ryan, 2007, and Muralidharan and Sundararaman, 20073). However, these incentives were implemented by a non-governmental organization (NGO). When government bureaucrats have to implement them, the incentives were ineffectual. In Kenya, for example, head teachers were given grants to reward teachers who attend regularly. Even though the head teacher could use the money to get other things for the school if they did not use it to reward the teachers, they almost universally chose to give the money to the teachers, irrespective of whether the teacher had done anything to deserve it, with the result that the incentive had no impact (Kremer and Chen, 2002). In India a reform that was meant to link government nurses’ pay to their attendance was initially very effective, but failed to have any impact after the local bureaucracy started providing official excuses for most of the nurses’ absences (Banerjee, Duflo, and Glennerster, 2008).
The poor incentives of bureaucrats and public providers to deliver quality services contrasts with evidence of strong incentives of governments to deliver quantity, especially in education, by building schools and recruiting teachers (Glewwe and Kremer, 2006, Keefer and Khemani, 2004, and Banerjee and Somanathan, 2007). Keefer and Khemani (2005), building on a large political economy literature4, argue that this can be explained by political incentives of governments that are skewed toward the provision of private and verifiable benefits to some citizens, at the expense of quality improvements that are more diffuse and harder to verify. Providing (secure) jobs through teacher recruitment, or scholarships and other transfers, is more effective in winning elections than getting teachers to teach.
1 For health, Das and Hammer (2005) show that the average time spent by a public doctor to examine a patients is 2 minutes, and that the average visit does not include any physical exam. In education, Chaudhury, et al. (2006) find that half of the teachers present in school in India were not teaching at the time of the investigator’s visit.
2 For example, Glewwe, Kremer, and Moulin (2002) find no impact from textbooks, Glewwe, Kremer, Moulin and Zitzewitz (2004) find no impact from flip charts, and Banerjee, Kremer and Jacob, (2004) find no impact from additional teachers in India. For discussion and more references, see Glewwe and Kremer (2006).
3 See, on the other hand, Glewwe, Ilias, and Kremer (2003) for a cautionary tale on multitasking by teachers even when incentives are properly implemented.
4 See, e.g. Acemoglu and Robinson..(2001); Banerjee and Iyer (2005), Acemoglu and Robinson (2006); Rajan (2007); Hoff and Stiglitz (forthcoming).
Such political economy arguments suggest that government bureaucracies may be ill equipped to improve the quality of public services. This has led development practitioners to believe that the involvement of beneficiaries is essential to make services work for poor people. Development projects funded by international organizations are increasingly required to include “beneficiary participation” components, such as the constitution of users’ committees, parents-teachers associations, etc. or, where such institutions already exists, interventions aimed at mobilizing people to make them more effective. The World Bank’s World Development Report “Making Services work for Poor People”
describes a range of alternative institutional designs that enable beneficiaries to exercise better control over the quality of services that they are receiving (World Bank, 2004).
Despite this enthusiasm, and some encouraging experiments we describe below, whether any types of external interventions actually affect participation by beneficiaries, and whether this participation can in turn improve public services, remain largely open empirical questions. It is challenging to answer these questions definitively because there is no single leading candidate for what encourages beneficiary participation and/or makes it more effective. At a very minimum, there are at least two dimensions along which interventions designed to promote participation can (and do) vary. First, community members might either be able to intervene directly to improve service delivery (by contributing additional inputs, by punishing or rewarding the agents, etc.) or they may only be able to intervene indirectly (say by contributing to a fund that is administered by some bureaucrat or complaining to the agent or the agent’s supervisor).5 Second, community members might be able to exercise control (direct or otherwise) individually or as a part of a small group (for example they may ask to be paid for the work they did on the local road project), or it may require joint action by some larger group.6 Both the direct and indirect dimensions allow for continuous variation, creating a continuous plane of possible models of popular participation. The different models have their advantages and disadvantages: for example, direct control opens the door for capture of the entire process by a locally dominant group. This is what happened in the sugar cooperatives in Maharasthra, India (Banerjee et al., 2001). Indirect controls, such as complaint systems, have the advantage that it is possible to bypass the local elites, but at the cost of potential slippage (the complain may get lost or ignored). Small groups require less coordination to exercise control (and hence are less subject to
coordination failures), but large groups make sense when the good is not excludable, and complaints are less likely to be ignored when they come from
t
a large enough group.
This paper reports on a randomized experiment in the state of Uttar Pradesh (UP) in India that compared a number of alternative models within the same setting. Much of the experiment leverages the Indian federal government’s flagship current program on elementary education, the Sarva Shiksha Abhiyan (SSA). This program, under which the federal government will contribute 65 percent of the educational budget in UP in 2007-08 (22,374 million rupees or 559 million dollars), gives a prominent role to the Village Education Committees (VECs). The VEC is a body consisting of three parents, the head-teacher of the village school and the head of the village government, which is supposed to be the key intermediary between the village and the district educational authorities. The VEC is supposed to exercise both indirect control (by monitoring the performance of the schools, reporting problems to higher authorities, and requesting
additional resources), as well as some direct control (by deciding whether the contracts of the existing community-based
5 The World Development Report (2004) calls these respectively the “short route” and the “long route” to control.
6 There is actually a natural third dimension: there may be specific, pre-specified mechanisms for the exercise of control, or the precise mechanics may be left to the community to determine. This is potentially very important, but impinges less on the issues emphasized in
teachers should be renewed, recruiting new hires, and allocating the additional resources for improvement that the school receives under the SSA). However, while the VEC itself is a small group, we argue that the three parent members of the VEC could not have real control without the active backing of a large number of other parents. In this sense the VEC model in India is one of direct and indirect control exercised by a large group.
The opportunity to do these experiments arose because by 2005, more than four years after SSA was launched, it was clear that at least in the Jaunpur district of the state of UP, the VEC was not playing its assigned role. A survey of children, parents, and teachers in 280 villages in that district found that while most villages did have a VEC, very few parents knew of its existence, sometimes even when they were supposed to be members of it. VEC members were also unaware of even the most important responsibilities that they have been assigned under the SSA: hiring of additional teachers, allocation of school resources, and monitoring of performance. At the same time the state of education in these villages bordered on the disastrous: 15 percent of children age 7 to 14 could not recognize a letter; only 39 percent could read and understand a simple story (of grade 1 level); 38 percent could not recognize numbers. Yet parents, teachers, and VEC members were often unaware of the scale of the problem and tended to overestimate what children in the village really knew (Banerjee et al. 2006).
Given that the VECs were extant everywhere, but almost entirely non-functional, the study design did not introduce new institutions, but instead promoted greater information and mobilization around the existing ones, and measured whether that led to greater involvement and, ultimately, improved school functioning and learning outcomes.
The basic strategy adopted involved a set of three interventions designed and implemented by Pratham, India’s most prominent educational NGO, with the goal of mobilizing the VECs and the community more generally around a program of educational improvement. The interventions that Pratham implemented were designed after several months of piloting in the area. There was a conscious attempt to be sensitive to the specificities of the local environment (in particular the constraints and opportunities resulting from the existing policies of the state government), to follow the available best practice guidelines for community engagement (World Bank, 1996, 2001), and to streamline the design for replicability and external validity.
One presumption behind the program was that lack of relevant knowledge was a factor holding back participatory action. It was clear from the baseline survey that community members did not know what they were entitled to, what they were actually getting, and how they could put pressure on the providers—all of which are critical for participation to be effective (Jenkins and Goetz, 1999; Goetz and Jenkins, 2001; Paul, 1987). A second element in the Pratham’s program design was the need (if participation was to be a reality) to involve more people with the state of education in the village, particularly on learning outcomes, and to turn that interest into some form of coordinated action.
All three interventions shared a basic structure: Pratham activists spent several days in a village facilitating small group discussions in each of the village’s neighborhoods and inviting those neighborhood groups to a large village-wide meeting. These large village-wide meetings were the culmination of the whole process and were also attended by teachers and members of the village administration. In the simplest of the three interventions using this format, village
administrators shared information about the structure and organization of local service delivery, especially the role and activities of the VECs. The meetings were followed by the distribution of pamphlets that described the various roles sand responsibilities of VEC members and training of individual VEC members. The second treatment provided this
information and, in addition, trained community members to administer a simple reading test for children, and invited
them to create “report cards” on the status of enrollment and learning in their village. In each neighborhood, volunteers were trained to understand and administer a literacy test to children, record scores and enrollment status, and prepare a neighborhood report card using these data. The volunteers presented the various neighborhood report cards at the village- wide meeting, during which a village report card was generated and discussed.
The first two interventions were therefore aimed at strengthening the SSA model of community participation by a combination of informing village members and coordinating their collective action in large groups. The third intervention added a “direct-control small group” component. Specifically, in each village in this group, Pratham started by conducting the second treatment, and then recruited one or more volunteers per village, and gave them a week’s training in a
pedagogical technique developed and used by Pratham throughout India for teaching basic reading skills. Volunteers then held reading camps in the villages. The typical “reading course” lasted two to three months, with classes held every day outside of school. This intervention thus offered committed individuals the opportunity and the competence needed to directly improve learning among children.
The results from the evaluation show that none of the three intervention methods managed to effect large group indirect or direct control over public schools, in terms of participation by any of the players (the parents, the VEC, the teacher), nor did they improve school performance. This is not because the mobilization entirely failed: the meetings organized by Pratham were well attended (on average more than 100 people attended in a village of 360 households). Nor is it because villagers are unwilling to get involved or do not care about education, or because they are pessimistic about the possibility of improvement. This becomes evident when we look at the impact of the small group component of the third intervention, which was a clear success. It succeeded in mobilizing a large number of volunteers from the villages, who signed up for the Pratham training and then set up reading classes in their village: More than 400 reading camps were held across 55 villages. Almost 7,500 children enrolled (more than 130 children per village) suggesting that there were enough parents and children who were keen to improve their children’s education.
Finally, the results demonstrate that teaching these children how to read is not an impossibly difficult task. In contrast to the failure of the first two interventions, the reading camps had very large effects on learning: after a year, we see evidence of very substantial progress for the children who attended the camps. Our instrumental variables estimate suggest that the average child who could not read anything at baseline and who attended the camp was 60 percentage points more likely to decipher letters after a year than a comparable child in a control village. The average child who attended the camp and who could decipher letters, but not words, in the baseline was 26 percentage points more likely to be able to read and understand a story than a comparable child in the control villages. Combined with the natural progress of children over the course of a year, these results imply that, after a year, all the children who could not read at all and attended the camp were able to decipher letters, and 35 percent of the children who could read letters and attended a camp where able to read and understand a story.
The contrast between these two sets of results may lie in the fact that large group mechanisms make very different demands on the community than small group mechanisms. The fact that the interventions got so many people to
volunteer for read camps but almost entirely failed to influence involvement with the VECs, might then reflect the community’s expectations about the efficacy of the large group mechanisms—if you do not believe that these mechanisms work, there is no reason to invest in them. We go on to argue that thinking about the different models of participatory action can also help us understand the relation between these results and the (in some instances, much more encouraging) results from the other recent evaluations of participatory programs (Kremer and Vermeersch, 2002; Olken, 2005;
Banerjee and Duflo, 2006; Bjorkman-Svensson, 2006; and Duflo, Dupas, Kremer, 2007).
In the remaining sections of this paper we describe the institutional context of participatory action, emphasizing the nature of the SSA model (section 2); compare the interventions that are evaluated (section 3); and discuss the data and the empirical strategy (section 4). We present the results in section 5, and conclude with a section that links these results to the related literature and discusses what this evidence tells us about how and when community participation can be effective.
2. The Sarva Shiksha Abhiyan Model of Participatory Action in Education 2.1 Policy
The VECs constitute the primary channel of participatory action under the SSA, which is the primary initiative of the Indian central government toward achieving universal primary education in India. States in India differ in the design of VECs and the roles and responsibilities assigned to them. In UP, VECs consist of the elected head of the village
government, the head teacher of the local government school, and three parents of children enrolled in the village public schools. The parent members of the VECs are nominated by block-level public officials (the block is the first
administrative level above the village). VECs are responsible for monitoring performance of public schools by visiting the schools, scrutinizing records, meeting teachers, parents, and children, and devising solutions to address any problems encountered. They are entitled to claim specified public monies and powers for this purpose—such as public grants for school development, the power to mobilize community contributions toward school improvement, and the power to identify and hire community members if the school needs additional teachers7. These community teachers are called Shiksha Mitras: they are usually paid by the state government (in some cases, the community pays for them), but the community has the responsibility for overseeing them.
Even as it is ideally conceived, the VECs’ control over the school is primarily indirect. It can petition for resources that the school is entitled to ask for—for example for hiring a Shiksha Mitra—but whether the funds show up or not depends on how much pressure they can put on the bureaucracy at the district level. There is no official guarantee that any village is entitled to them. It can also complain about the teachers or the level of education in the schools, but, once again, the ultimate decision on whether anything will be done about it is not in their hands. Nevertheless the VEC can intervene directly in some areas: It can put direct pressure on the Shiksha Mitra to teach better and come to school more often, and it has the right not to rehire a Shiksha Mitra if his/her performance is deemed unsatisfactory. It gets a small amount of money each year (Rs. 7000, about $170) from the SSA to spend on school maintenance and ways to improve teaching in the school. It can also raise and spend resources from the village, but, given that almost all the resources in public schools have traditionally come from the government and the poverty of the average villager in this part of UP, this is probably a relatively limited option.
The VEC by itself is a relatively small group, and since it was nominated, rather than elected, it is likely that it would need the support of a larger group of parents to take any action. It is true that the village head (who is part of the VEC) might be able to exercise control on his own, but given the limited political salience of education, this is probably not a priority for him. In order to get him to act or to bypass him the parents in the VEC would need the mandate of a large
7 This description is taken from Uttar Pradesh state government published documents on SSA and VECs.
group of villagers. Indeed, if, for example, they were the only three parents who were complaining about the quality of the teaching, while the rest of the parents seemed content, it is not clear that any action against the teacher would even be warranted. In other words, it seems likely that the VEC can only be effective when it reflects the collective will of a large group of engaged parents.
2.2 Practice
In practice, although the VECs had been (statutorily) constituted in 2001 in every village, well before our study began, there is no evidence of parental involvement in the running of the public schools, either through the VEC or through other community or village mechanisms, based on a pre-intervention survey we conducted in 280 villages.
The survey included an interview of 1,029 VEC members (their names and addresses were provided by each school’s headmaster). The salient results from this survey are presented in table 1 (column 1). A striking fact is that only 38 percent of the VEC members interviewed mention the VEC spontaneously when asked the names of organizations they belong to, and 25 percent still say they are not members after being asked specifically if they are a member of the VEC.
Only 26 percent of them have heard of the SSA, the government program from which the VEC derives its powers. Only 21 percent know that their committee is entitled to receive resources from the SSA (panel A). Most startlingly, only 3.6 percent mention the ability to request government funds to hire a Shiksha Mitra (an additional para-teacher) when the school is over-crowded as one of the VEC’s prerogatives (and responsibilities) (Panel D). Yet, this is probably the most important power they have, since this gives them not only an extra teacher, but an extra teacher they directly control (at least on paper).
Given the ignorance of the VEC members, themselves, it is not surprising that parents know even less about the VEC and its responsibilities. Column 1 in table 2 reports some summary statistics from parents’ responses to this survey.
For example, household respondents were asked whether there was any committee in the village that dealt with issues relating to education. A startling 92 percent responded that they did not know of any such committee. Only 3 percent could name actual members of the VEC.8 It is worth noting that ignorance and lack of participation in the institutions of local governance, is not just a problem for education. Only 14.2 percent of respondents report that a household member ever attended a Gram Sabha, village meetings that were institutionalized as part of a country-wide decentralization initiative in 1993. However, as panel C of table 2 shows, for the households that do participate in local governance, education seems to be a low priority. Of those who have attended any Gram Sabha, only 3.3 percent mention education when asked about which issues were covered in the last meeting. More generally, when parents were asked what they consider the most pressing issues in the village, education ranks fifth on the list of village problems, with just 13.1 percent of respondents mentioning it at all.
The baseline survey also found evidence that community members—parents, head teachers, and village leaders—
do not know how bad things are in the village as far as education is concerned. The actual learning levels of all children between the ages of 7 and 14 from over 8,000 randomly selected households across our study villages were measured using tools developed by Pratham to rapidly assess whether a child can read, write, and do simple arithmetic. The results
8 Moreover, the proportion of people without any knowledge of VECs remains as high even when we look only at parents whose children are enrolled in government schools (Banerjee et. al. 2006, Figure 9).
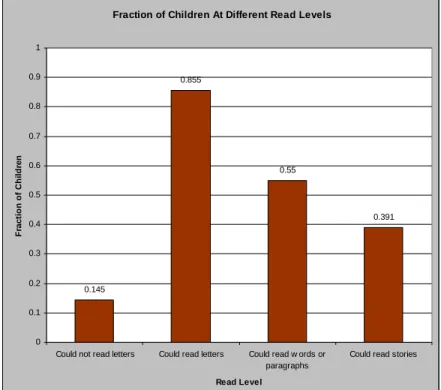
are presented in figure 1 (see also panel A of table 6), and shows how low the learning levels were. 15 percent of children age 7 to 14 could not recognize letter; Only 39 percent could read and understand a simple story (of grade 1 level); 38 percent could not recognize numbers.
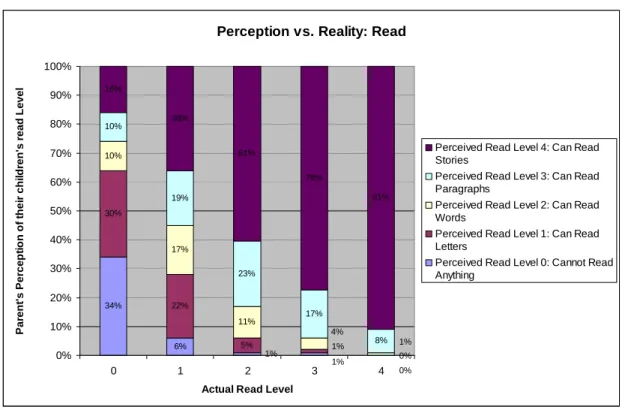
The survey asked parents what they knew about learning levels of children in the village, as well as their own children. Twenty percent and 21 percent of parents, when asked, said that they had no idea of the village children’s ability to read a paragraph or write a sentence, respectively. The average parent overestimated by 12 percent the proportion of children in the village who could read a paragraph (table 2, panel B, column 1). Furthermore, 42 percent of parents were too optimistic about their own children’s ability to read, and 25 percent overestimated their ability to write. For example, 66 percent of the parents of the children who could read nothing thought they could at least read letters, and 36 percent of the parents of the children who could barely decipher letters thought their children could read and understand a story (see figure 2). The picture is even more distorted in math, where a full 82 percent of the parents of the children who could only recognize numbers, but could neither subtract or divide, believed that their kids could subtract (see figure 3).
3. The Interventions
The fact that there were large gaps in what the average villager knows about the state of education in his village or what he can do to about it, suggested the possibility of getting them more involved by sharing this information with them.
Moreover the palpable lack of any urgency associated with the problems in education suggested that motivating the villagers and helping them coordinate on doing something about education might also make the VEC more effective. To achieve this, Pratham, a very large non governmental organization long involved in trying to improve the quality of education in India, developed and experimented with three different methods of mobilizing the communities and sharing information with them.
3.1 Intervention description
All three interventions adopted the same basic structure to share information on education and on the resources available to villagers to improve the quality of education. The intervention started with small-group discussions carried out in each hamlet over at least two days. In all these meetings, Pratham staff members acted as facilitators, encouraging discussion by raising questions, rather than providing facts: Do you know about the status of education in your village? Do you think children are learning? What aspects of education concern you the most? The intervention culminated in a general village meeting, typically attended by the Pradhan (village head) and the school headmaster. The intervention teams tried to facilitate the discussion in this meeting so that local key actors of the village (the school teachers or Gram Pradhans) provided both general information about the provisions and resources available at village level, as well as village-specific information on the existence of VECs, its membership, what resources it receives, and the different roles it can play.
However, Pratham facilitators were provided a fact sheet covering information about the public education system and VECs, and checked whether all these facts were shared at the village meeting. If something was missing, they would raise it themselves. In the following weeks, facilitators visited each VEC member and gave him or her a written pamphlet on the roles and responsibilities of the VEC, which they also discussed with the VEC member.
This formed the basic structure of all three interventions. The first intervention stopped at this point. The key additional element in the second intervention was that villagers also generated their own information about children’s learning outcomes. As already mentioned, it was clear from the baseline survey that a large fraction of children currently
enrolled in school were unable to read a simple text or do basic arithmetic, but many parents overestimated their children’s learning levels. In addition, during the piloting the field staff noted that even when people talked about
education, it was rarely about learning—if anything got them excited it was the state government’s scholarship program, or the new school-meals program. The second intervention aimed at sharing information about the status of learning in the villages with parents, teachers, village leaders, and VEC members, to help parents focus on the issue of learning in their discussions about education. To this end, the Pratham staff taught interested villagers how to evaluate a child using the simple testing instrument used by Pratham everywhere (including for our own data collection), which we describe in more details below. In each neighborhood, a number of citizens tested all the children, and in just a few days the villagers generated their own “reading report card,” which was then discussed a the village meeting. Villagers who had participated in creating the report card for their locality were encouraged to speak out at the village meetings and present their findings and experiences. This had the impact of generating the necessary information, actively engaging the community, and shifting the conversation in the general meeting toward learning issues. In addition, this intervention also transferred to the community a specific monitoring tool, which could make it easier for villagers to monitor progress.
The third intervention supplemented interventions 1 and 2 by providing a way for a motivated citizen to directly act to improve education levels. Pratham introduced the villagers to a simple technique for teaching children how to read used in its own flagship “Read India” program. It invited local volunteers to get trained in the technique and start reading classes to be held after school. The training lasted for four days. Volunteers were then supported by periodic visits from Pratham staffers, who checked that the classes were held and provided some in-service training. Each village in treatment 3 received about 7 visits from staffers. The third intervention therefore offered the community a direct and individual way to improve learning levels. Such direct interventions by the village community is specifically mentioned in the UP state government pamphlet on VECs as one of the things that a community member can and should do to improve education in their village. However, it is worth emphasizing one key difference between this piece of the third intervention and
everything else that was implemented in this experiment. This was the one thing that sections of the community could do without engaging at all with the school system or even the majority of the village.
Each of these interventions was implemented in 65 villages, randomly selected out of the 280 villages in the baseline between September and December 2005. A fourth group of 85 villages formed the control group. Monitoring data suggests that the interventions were well implemented: All treated villages had at least one meeting, and some had more than one. A total of 215 village-levels meetings were held in the 195 villages. The meetings were well attended (the general meeting had on average 108 participants, 95 percent of whom were present during the entire meeting), with good
representation from different hamlets and castes of the village (37 percent of the meeting attendees were women). In terms of who spoke, 72 percent of the meetings had participation from a wide range of groups and castes, and in 55 percent of the meetings, men and women were equally likely to be talking (in 84 percent of the remaining meetings, males did most of the talking). In 55 of the 65 treatment 3 villages (i.e., 84 percent of the total), there were volunteers who started reading classes. On average, there were 7.4 reading camps per treatment 3 village, each led by a different volunteer—but with the considerable variation of between 0 and 16 groups per village—and 7,453 children attended camps. Therefore, in each of the 55 villages with reading camps, about 135 children were enrolled in these camps.
3.2 Comparison with best practice—why these interventions?
While these interventions were based on Pratham’s extensive knowledge of the situation on the ground, and on extensive piloting of ways to conduct effective meetings, it is reasonable to ask whether the interventions were actually designed to work well. There is of course no conclusive way to answer this question—there is always the possibility that something else would have worked better in any particular context. On the other hand, the intervention needed to be simple enough to be replicable and the lessons to be generalizable. Recognizing this, the community of practitioners has developed a set of “best practices” for external interventions aimed at inducing greater popular participation in the monitoring and improvement of public services. The fact that the interventions followed these guidelines should go a long way toward assuring that what we evaluate in this paper corresponded ex-ante to what policymakers would consider to be an effective participation intervention. Thus, in this section we summarize the best practice guidelines available from the World Bank’s Participation Sourcebook (and other notes on best practice from this same source)9 and argue that the intervention that Pratham designed and implemented met most of these criteria. Moreover, we will suggest that Pratham was a natural candidate for being the implementing organization. In this sense, the intervention we study should provide us a “best case” scenario for the effectiveness of these kinds of interventions, at least in a context similar to UP.
The first guideline is that the intervention should be inclusive: there needs to be an attempt to include all sections of the village and make them feel that they are a part of the intervention. Specifically, it is not enough to have one big meeting where the outsiders come and deliver their message and leave. The Pratham volunteers were in the field at least for two days (for four days in the cases of interventions two and three). Facilitating teams went from hamlet to hamlet within a village, making sure to cover “low-caste” hamlets, carrying out conversations about education in small and large groups (which enabled women to participate, for example), and inviting local people to take the lead.
Second, the mobilization should not create unrealistic expectations. Here, the objective was to raise the learning levels of the children, in particular with respect to reading. Pratham’s experience shows that it is indeed possible for a child to considerably improve his or her reading level in a few months, provided that some targeted attention is paid to the child (Banerjee et al., 2006). The tools transferred to the community through the mobilization efforts were appropriate for the direct and indirect controls available to the village community to improve education. They could use these tools for indirect action—such as monitoring children’s learning, complaining about poor performance to higher authorities, and demanding additional resources or training for their teachers. They could use the tools for direct action—for example, giving greater incentives to Shiksha Mitras by threatening to withhold contract renewal unless performance improves, or allocating the resources they receive under SSA or through other village discretionary budget to improve school
conditions. In intervention 3, they could use the teaching tool directly to hold classes to teach children.
Third, the intervention should not bypass or undermine existing institutions. Interventions 1, and 2, which build on the role of VECs in facilitating change, clearly satisfy this criterion. Intervention 3 was the only one where an
alternative to the existing institutions was proposed, though as a complement to the system, rather than a substitute.
9 The Sourcebook can be found at the following web site, with links to other notes on designated best practice:
http://www.worldbank.org/wbi/sourcebook/sbhome.htm
Fourth, practitioners emphasize the value of community-owned “score-cards” in mobilizing communities to take action. In interventions 2 and 3 the community created its own report card by testing children in math and reading. Both the results and the tools were transferred to community members.
Pratham is the largest educational NGO in India. It has demonstrated success in several randomized evaluations of its programs and reaches millions of children throughout India. Pratham designed and runs the the Annual State of Education Report (ASER), which tests children in all of India’s nearly 600 districts every year, and is extremely prominent in the discourse on education in India. The organization takes community participation in education very seriously (it is the backbone of its flagship “Read India” program) and devotes considerable resources to make sure that the program is implemented as well as possible. Pratham’s motivation and expertise thus made it an obvious candidate for implementing these interventions.
Taken together this suggests that we can be reasonably sure that what we are evaluating were well-designed and effectively implemented programs. It is also clear that they reached their intermediate goals: encouraging participation, holding meetings focused on education, and generating discussion, interest, and willingness on the part of at least some people to act (as evidenced by the fact that Pratham was effective at recruiting volunteers for the reading camps).
3.3 Why might we have expected these interventions to work?
These interventions involved a combination of more information (about learning levels and levers for change such as the VEC) and more coordination on doing something about education. The predicted impact of more coordination seems unambiguous: More action and better results is what we would have expected.
Giving people more information, on the other hand, need not always promote greater collective action. For
example, if the only people who were acting initially were those who believed that the returns to collective action were very large, information that gave everyone a more realistic sense of the effectiveness of collective action might very well reduce the total effort put in. However, in our particular context this effect seems unlikely because for most people the effect of the information should have been to make them, ceteris paribus, more willing to act: First because they were being told that they had more powers than they had previously imagined, and second because they discovered that the problem was more serious than most of them had known and therefore there was a greater need to act.
However, this presumes that they registered the information that they were being given.10 If they were sufficiently pessimistic about being able to use these powers to start with—possibly based on their previous experience with trying to put pressure on the education system—it would not be surprising if they did not pay very much attention when the powers were being detailed. In particular, the decision to pay attention probably only pays off if others are also paying attention, so it is easy to see that there may be a coordination failure at this preliminary stage. In that case we would see no change in their willingness to participate and no change in outcomes.
10 At least in the case of information about learning levels, treatment 2 was designed to help ensure community members understood the information by including them in its generation.
4. Evaluation: Data Collection, Baseline Results, and Empirical Approach 4.1 Data collection
The evaluation took place in 280 villages in Jaunpur district in the state of Uttar Pradesh (UP), India. The state of UP is the most populous state in India with a larger population than Mexico (166 million inhabitants according to the 2001 census). It is also among the five worst performing states in terms of basic literacy. Jaunpur district was chosen in part because it is close to the state average in terms of literacy, and in part because it was one of the districts where Pratham was not already working. Districts in India are divided into administrative blocks. Four of these blocks were randomly selected to participate in the study, and the study villages were then randomly selected within each block. The survey and the study are thus representative of Jaunpur district (and its 3.9 million population) as a whole.
In both treatment and comparison villages, a baseline survey was conducted in March and April 2005, and the endline survey took place in March and April 2006. The evaluation instruments included a detailed data set on 10 randomly selected households per village; a dataset on reading and math outcomes for all children aged 7 to 14 (at the time of the baseline) in 30 randomly selected households in the villages; a dataset of headmasters of government primary schools and all VEC members; data on school infrastructure and functioning; and an average of 6.7 observations for each school on teacher presence, obtained during random, unannounced visits during school hours. Every survey was
conducted at least twice; hence, each dataset has a panel structure. The data on learning outcomes were collected using a simple tool developed by Pratham, and used in the ASER survey. For reading, children were presented with a simple paragraph and asked to read it. If they could not read it the tester quickly switched to a panel with a few single words on it, and if they could read it, the tester moved up to a longer and more complex story. If the child struggled to read the words on the panel, the tester showed a panel with several letters and asked the child to identify them. A similar approach is used for math—with the levels in the math case ranging from easy to hard in addition, subtraction, multiplication, and
division.11
The final sample for the baseline survey consists of 2,800 households, 316 schools, 17,533 children (ages 7-14) tested in reading and math, and 1,029 VEC member interviews from the 280 villages. In the endline 17,419 children were tested. There was very little attrition from the baseline survey: The endline sample includes all but 716 of the children in the baseline (the attrition is evenly spread across the various treatment and control groups). An additional group of 2,131 newly-turned seven-year-olds were added to the sample at endline (although these are not included in most of the analysis that follows since we have no baseline for them).
4.2 Baseline results
Baseline data broken down by treatment group are available from the authors. They confirm that there are no systematic differences between treatment and comparison groups or between the different treatment groups: the
11The survey instruments and data collection are all available on the J-PAL web site (www.povertyactionlab.org).
allocation to groups was indeed random.12 The baseline data for the combined sample is presented in column 1 of each regression table. Several of the results from the baseline survey have already been discussed above: We saw that the VEC was not active (table 1), that villagers knew very little about the local structures for impacting school policy (table 2), that the learning results were dismal (figure 1), and that the community’s perceptions about learning did not match the unfortunate reality (table 2).
The baseline survey provides some additional relevant data on the situation in the schools. From the school surveys (table 3) we found nearly all the schools had at least some textbooks, covered classrooms, a water source, and material, such as maps on the wall. As public schools they had all received some money from the government but only ten percent had received money from the panchayat. About half the schools had toilets, and less than a third had a separate toilet for girls. Sixty-nine percent provided midday meals (a legal requirement). Only 2 percent had electricity.
Involvement of parents in school is limited—with only about four fifths of schools even holding a parents’ meetings. Very few parents make donations—although about a third of schools have had some parental volunteer input.
Table 4 presents data on teaching resources, and teaching and children absence. On average, schools in the baseline had 3.2 teachers, of which 0.62 were Siksha Mitras. Headmasters and teachers were absent roughly a quarter of the time and in only 44 percent of the cases was a teacher actually teaching at the time of an unannounced visit to the school by the enumerators (these results are virtually identical to the nationwide results reported in Chaudhury et al., 200613). Children are absent a lot as well: only 53 percent of the boys and 50 percent of the girls enrolled were present at the time of the unannounced visit (Table 5, panel B). This is confirmed by parents: in the last 14 days, parents report that their children were in schools only 7.3 days (out of 12 school days). Panel A in Table 5 shows that most children are enrolled in school: only 7 percent of children aged 7 to 14 were not in school at the baseline. Given the poverty in the village, it is striking that a large minority of children (37 percent) are enrolled in private or NGO schools (mainly private schools).
There was thus considerable margin for improvement: more resources could have been provided (including Shiksha Mitras), and teachers and students could have attended more.
4.3 Empirical strategy
• Intermediate outcomes
Given the randomization, the basic empirical strategy is fairly straightforward. We first group each outcome into
“families” of related variables (each family corresponds to a panel in our regression tables). We then regress the endline
12 Of 88 characteristics we scrutinized, only 3 were found to have statistically significant differences at the 5 percent level between the groups—i.e. somewhat less than would be predicted by chance. The three were the number of seats in the classroom (where treatment 1 and 3 had slightly more than control), the number of parents who saw education as a problem (where families in treatment villages were slightly less likely to say that education was a problem), and the distance between parents beliefs about what their child could do and reality. As a family, school facilities were not better in treatment than control.
13Unfortunately, at the baseline, the random check did not collect data on regular teachers and Shiksha Mitras separately. However, this data was collected at the endline, and, in the comparison group, Shiksha Mitras were both more likely to be present and more likely
measure of each outcome in that family on an indicator for each treatment group (the control group is the omitted category) and baseline measures for each of the outcomes in the family, i.e.14
(1)
where i indexes the households, j indexes the village, k indexes the outcome, and X are the baseline values for all the outcomes in the family. The standard errors are clustered at the village level (using White standard errors) to reflect the fact that the treatments were implemented at that level. We also run a specification where we pool all the treatments together.
The only empirical difficulty is that there are a large number of outcomes that could have been affected by the interventions. This embarrassment of richness means that there is a danger of “cherry picking”: We could choose to emphasize the results that show large effects. To solve this problem, we present results on all the outcomes on which we collected data, and, for each family of outcomes, we follow Katz, Kling, and Liebman (2007), and calculate the average standardized effect over the family of outcomes. For a family with K different outcomes, each indexed by k, the average effect of treatment 1, , is for example calculated as:
where is the standard error of the coefficient . The other average effects are calculated in a similar way.
The families of intermediate outcomes we consider are: what VEC members know about their role (Table 1, panel A); VEC activism (Table 1, panels B and D); what VEC members know about the education situation in the village (Table 1, panel C); parental involvement with the school (Table 2, panel A; Table 3, panel B); parental knowledge about the
education situation in the village (Table 2, panel B); the priority given to education in village discussions (Table 2, panel C); school resources (Table 3, panel A); teacher and student presence in school (Table 4, panel A; Table 5, panels A, B, and C).
• Learning
Learning is obviously the main outcome of interest. Pratham classifies reading level in 5 groups: cannot read at all, can read letters, can read word, can read a short paragraph, and can read (and understand) a story. Reading letters is a simple decoding exercise. Reading story requires some understanding of the story and some fluency. Reading word or paragraph is in between (ability to combine letters, but no understanding). We therefore group paragraphs and words into a single category. Since the intervention was designed to bring children from a level of reading to a superior level, we then
14 In the appendix, we also present simple differences, without any control variables.
look at how the interventions affect the proportion of children who, having started at a given level, end up reading at least at a given level. For example, we restrict the sample to children who could not read anything at baseline, and look at the effect of each intervention on the proportion of these children who could read at least letters, at least words or paragraph, or could read a story by the endline. Thus a child who can read a story at the endline gets a 1 for the “letter,” “word or paragraph” and “story” levels. We then estimate equation (1) in for the three outcomes, for all the subsamples.
5 Intervention Results
5.1 Knowledge of the participatory institutions
Reassuringly, the intervention did affect what VEC members know. Panel A in Table 1 shows the impact of the program on what the VEC members know (for example, about the state of education in the village). Looking at the average effect of treatments 1 through 3 (in column 6), the average impact on VEC knowledge is large: 2.2 standard deviations. The effect of the treatment is positive on all the variables in this family. It is significant for their knowledge of the SSA (there is an increase of 7.5 percentage points in the fraction who have heard about the SSA, and 7.8 percentage point in the number of VEC members who know they can access funds through the SSA), and the probability that they have been trained (13 percentage points). However, these improvements are counterbalanced by a worsening of what VEC members know in the control villages, so that the level of knowledge of the VEC members did not actually increase in the treatment villages between the baseline and the endline surveys.
Panel C of Table 1 shows that VEC members also know more about the village’s state of education in the intervention villages: their knowledge of what children know has improved on average by 1.4 standard deviations
(significant at 10 percent level) on average across all three treatments (column 6). Curiously, they seem to have learnt less in intervention 2 than in intervention 3.
We also find a significant difference in parents’ knowledge of the VEC between treatment and control villages (Table 2, panel A): They are 2.6 percentage points more likely to know there is a VEC (compared to only 4 percent in the control at endline). These effects are however strikingly small. The proportion of people who know about the VEC even after the interventions remains very small, barely 7 percent. The 360 or so households in an average village sent 108 adults to the meeting. Even under the extreme assumption that 2 adults came from every household that was represented, this means that 1 in 6 households were at the meeting. If everyone who was at the meeting registered the fact that there was a VEC in the village, we would have expected the fraction of those who knew about the VEC by the endline to be at least 15 percent (and plausibly much more since 62 percent of the participants were male, and therefore probably represented different families). It seems that either many of the participants in the meetings did not register the information about the VEC or they promptly forgot (the fact that the share of parents who know about the VEC went down from above 8 percent to 4 percent in the comparison villages, suggests that people do forget).
Parents are also more aware of the village’s status of education in villages that came under treatment three, which is the treatment where this information was generated and discussed, and reading camps were held (Table 2, panel B). The average effect on the knowledge of education status in the village is 1.3 standard deviation in treatment 3 villages, and 0.8 standard deviations across all three treatments on average (column 6). These are large and significant effects. All the
treatment effects on the variable in this family are positive for these two groups of villages although different variables are individually significant in the two cases.
5.2 Engagement
Despite the real, if modest, difference in awareness, we see very little difference between the VEC’s performance in treatment and control villages. They are no more likely to report that they have complained to anybody, or tried to raise resources in any of the treatment groups (Table 1 panel B). Panel D in the same table shows that they neither showed more awareness of the VEC’s responsibilities for hiring Shiksha Mitras nor were they planning to do anything more about hiring Shiksha Mitras.
The intervention also did nothing to increase the level of engagement of parents with the schools. The intervention was unsuccessful in raising the place of education in parents’ priorities (Table 2, panel C). Parents are no more likely to have visited the school or to have volunteered time and/or money in the treatment villages than in the control villages—
and this holds for each of the three treatments (Table 2, panel A). The parents’ reports are confirmed by the head teachers (Table 3, panel B), who do not report any more visits from parents, or having received any more inputs of time or money from parents, or having exercised any more effort to involve parents in the school. This is not because parents have opted for exit rather than voice. Table 5 shows the fraction of children enrolled in public and private school. Children are just as likely to be in school, they are no more likely to be in a private school, and they are no more likely to be tutored. This is confirmed in Table 5, panel B, which shows no change in the enrollment in public schools.
The important exception to this is intervention 3, which provided a readily available outside option (the read class organized by a volunteer). We see that parents did take advantage of it. Eight percent of the children in intervention 3 villages have attended a read class (Table 6). Thirteen percent of the children who could not read anything or could read only letters in the baseline attended the class, while 7.4 percent of the children who could read words or a short paragraph at baseline attended the class., Also, 3 percent of the children who could read a story at baseline attended the class. While it is not nearly the case that all the children attended, this still represents 135 children per village on average in the 55 villages that held the camps. Interestingly, in intervention 3 we also see that the fraction of children out of school actually increase by a 1.3 percentage point (significant at the 5 percent level), a 16 percent increase over the comparison group figure. This is a fairly large effect. However, it turns out that it is entirely due to children dropping out of private or NGO school (results omitted to save space). It may be that parents consider the reading classes to be a satisfying alternative to a private school
5.3 School resources, teachers, and students
With headmasters doing no more to mobilize parents, and neither parents nor VEC members complaining more about school resources, it is not surprising that there is no evidence that any of the treatments generated additional resources for the schools (Table 3, panel A). The effect on that family of outcomes is actually negative (and even significantly so, when we consider the whole family of outcomes and the average effect of all three treatments).
However, the most expensive and important resource in a school is the teaching staff. Results on teaching resources are displayed in Table 4, panel A. Thanks to funds available under the SSA, the community has the right to a new, local teacher to relieve the burden on the teaching staff. The VEC can play a role in getting approval for the position, and in the choice of whom to hire. This possibility was discussed during all the interventions. The number of Siksha Mitra increased between the baseline and the endlines (it almost doubled in the control villages), and it did increase somewhat faster in all treatment villages (though the effect is significant only in treatment 2 villages).15 However, there was no impact on the teacher presence (not even Siksha Mitra) 16 so that the average effect on the family of outcome indicating
“teaching resources” available to the school is insignificant.
Panel B in Table 4 suggests that the interventions did not affect child effort either (other than through their participation in the reading camps). As we saw previously, they are no more likely to be enrolled in government school.
They are also no more likely to be present, according to random checks (panel B) or parental reports (panel C). On both indicators they appear to be in school about half the time.
5.4 Learning: mobilization and information
Given that none of the players changed their behavior, we probably should not expect interventions 1 and 2 to have an impact on learning levels. And indeed, as Tables 6 shows, neither intervention has an effect on either reading levels or math levels. Both reading and math levels increased as much in the comparison group (presumably because the children became older) as in either Treatment 1 or Treatment 2. None of the treatment effects estimated for various reading levels and subgroups is significant at the 5 percent level or better.
5.5 Learning: Impact of the “teaching” intervention
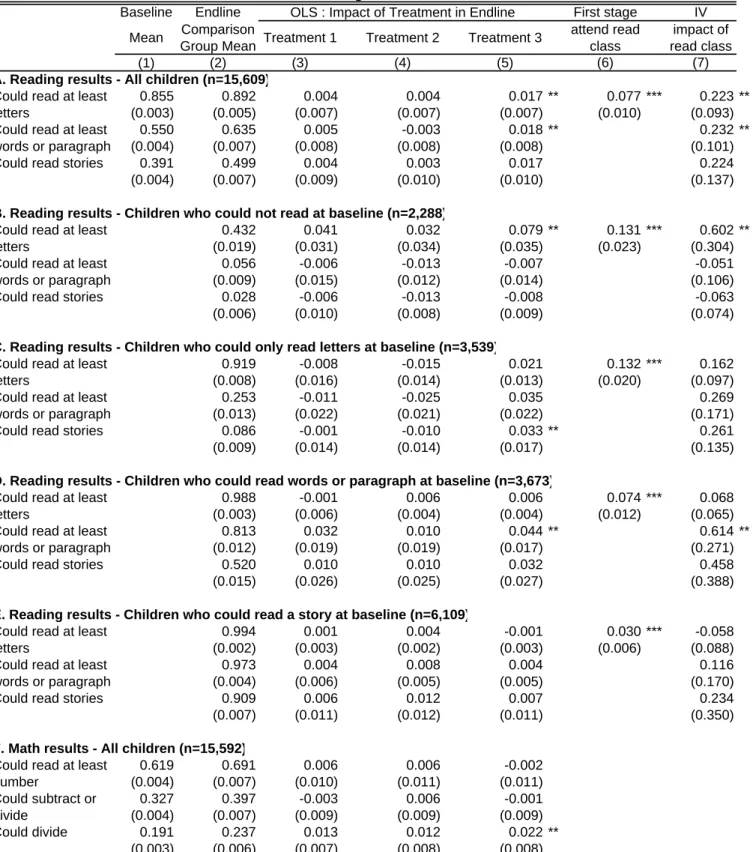
In contrast, the third intervention (which had the reading camps) worked. Column 5 in panel A of Table 6 displays the learning results of intervention 3. Overall, children in the villages that received intervention 3 are 1.7 percent more likely to read at least letters (significant at the 5 percent level). They are 1.8 percent more likely to read words or paragraphs (significant at the 5 percent level), and 1.7 percent more likely to read stories (significant at the 10 percent level).
This average masks considerable heterogeneity, however: when we run the same regression separately for children at different reading levels, the result reveal a clear pattern. Children who could not read anything at the baseline are 7.9 percent more likely to be able to read at least letters at the endline in intervention 3 villages. But their improvement stops at the letter recognition stage: they are no more likely to be able to read paragraphs or stories (Table 6, panel B). Those who could read only letters at baseline are 3.5 percent more likely to read at least paragraphs or words, and 3.3 percent more likely to read stories if they were in intervention 3 villages. Those who could read either at the word or paragraph
15Note that this contrasts with the report of the VEC that they had not done anything about Shiksha Mitras. The Shiksha Mitra may have been hired by the Pradhan without informing the rest of the committee.
16Given that the number of Shiksha Mitras went up (though mostly not by enough to have a significant effect) this measure of
attendance does not separate between changes in the attendance of Shiksha Mitras who were already working and the effect of adding a new generation of Shiksha Mitras (who may be different from the previous generation).
level are 4 percent more likely to still read at last paragraphs or words (note that 19 percent of the children who started at that level have regressed in the comparison group).
These increases may not seem that large at first, but we have to remember only a small fraction of the village’s children attended the classes: on average, only 8 percent of children (including 13 percent of those who could not recognize letters) in our sample attended the reading class in intervention 3 villages. Since none of the interventions (including intervention 3) seems to have affected any other dimension of the child’s learning experience, it is reasonable to assume that the effect of intervention 3 on reading outcomes came entirely from attending the classes. In this case, being in an intervention 3 village is a valid instrument for attending the read class. We thus run an instrumental variables regression, where the variable “attended a reading class” is instrumented using “intervention 3”, i.e. we run
(2)
where R is a dummy for whether the child attended the reading program, and T3 is the instrument for R (other variables instrument for themselves). X is a set of child-specific controls including age, gender, school status at baseline, and reading level at baseline.
The results are presented in column 7 in Table 6. Provided the exclusion restriction is valid (i.e. ,that the effect of intervention 3 is entirely channeled through attendance to the reading classes), this instrumental variable estimate tells us the effect of attending a read class on the ability to read at various levels, for the sample of kids who chose to attend. On average the results in panel A suggests that attending a read class makes these children 22 percent more likely to be able to read at least letters, 23 percent more likely to read at least a word or paragraph, and 22 percent more likely to read a story (though this last effect is not significant). We should not forget, however, that this is a test of the impact of the read class on those who participated, and it is possible that if the program had been successful at enrolling more children the extra children would not have benefited as much—for example if they were somewhat less motivated than those who did enroll.
Again, to understand the impact of the program, it is important to disaggregate by initial learning level. A child who could not read at all is 60 percentage points more likely to read letters after attending the reading class. A child who could read only letters at baseline and who attended the camp is 26 percent more likely to read stories. Thus, the effect on those who could already read letters is mainly to allow many of them to directly switch to the story level. Children who were able to read at the word or paragraph level are 61 percent percent more likely to still read at the word or paragraph level, and 46 percent more likely to read at the story level (though this last effect is not significant). These are very large effects. In fact, they had not much scope to be larger. Adding the endline reading level in the comparison group (column 2) to the point estimate of the treatment effects (column 7) implies that every child who could not read anything at baseline but attended a read class could read letters at the endline, and almost every child (98 percent) who could read at the word or paragraph level can now read at the story level. Almost 35 percent of those who could read letters at baseline and who attended the read class are able to read at the story level.
In summary, the reading program, which offered the villagers an alternative form of participatory action where a single individual could directly affect learning outcomes, did lead to dramatic increase in reading ability for those who attended. These results confirm Pratham’s intuition that, combined with the traditional school system, a two to three