Research Collection
Journal Article
Simulation and experiments on the feasibility of using gamma tomography for void fraction measurements in nuclear fuel bundle mock-ups
Author(s):
Adams, Robert; Diaz, Julio; Petrov, Victor; Manera, Annalisa Publication Date:
2021-05
Permanent Link:
https://doi.org/10.3929/ethz-b-000462350
Originally published in:
Annals of Nuclear Energy 154, http://doi.org/10.1016/j.anucene.2020.108073
Rights / License:
Creative Commons Attribution 4.0 International
This page was generated automatically upon download from the ETH Zurich Research Collection. For more information please consult the Terms of use.
ETH Library
Simulation and experiments on the feasibility of using gamma tomography for void fraction measurements in nuclear fuel bundle mock-ups
Robert Adams
a,b,⇑, Julio Diaz
a, Victor Petrov
a, Annalisa Manera
aaDepartment of Nuclear Engineering and Radiological Sciences, University of Michigan-Ann Arbor, 2355 Bonisteel Blvd., Ann Arbor, MI 48109, USA
bSwiss Federal Institute of Technology, Department of Mechanical and Process Engineering, Sonneggstrasse 3, 8092 Zürich, Switzerland
a r t i c l e i n f o
Article history:
Received 10 June 2020
Received in revised form 1 November 2020 Accepted 5 December 2020
Keywords:
Gamma tomography Void fraction measurement Two-phase flow
Rod bundle experiments
a b s t r a c t
The High-Resolution Gamma Tomography System (HRGTS) facility is under development at the University of Michigan. This system is planned generally for application to two-phase flow loops repre- senting nuclear fuel bundles. These measurements should provide insight into fluid dynamics phenom- ena and high resolution data for validation of computational fluid dynamics (CFD) codes. The HRGTS is planned to be deployed in the Michigan Advanced Rod Bundle fLow Experiment (MARBLE). an adiabatic test loop consisting of an 8x8 square lattice arrangement. Simulations modeling MARBLE were performed to study how the counting statistics of the imaging process propagate into void fraction uncertainty. The simulation results showed that an accuracy of around 1% is expected with imaging times of 1 min.
Computed tomography measurements were performed on partial mockups of the bundle geometry, which confirmed that the technique can be used to obtain accurate subchannel void fraction data in com- plicated and challenging measurement scenarios.
Ó2020 The Authors. Published by Elsevier Ltd. This is an open access article under the CC BY license (http://
creativecommons.org/licenses/by/4.0/).
1. Introduction
In recent years, significant research effort has been dedicated to the development of advanced two-phase models implemented in computational fluid dynamics (CFD) and subchannel codes, partic- ularly for applications in nuclear reactor systems. Particular inter- est has been focused on reactor assembly geometries pertaining to pressurized water reactors (PWR) and boiling water reactors (BWR). Studies for example inLiu et al. (2017), Venkateswararao et al. (1982); and Paranjape et al. (2011)have focused on charac- terizing two-phase flow regimes inside reactor assemblies. Never- theless, the advancement of these models has been hindered by the lack of high-resolution experimental data in complex geometries, such as nuclear fuel bundles with spacer grids (Bestion et al., 2014). Experimental two-phase instrumentation such as wire- mesh sensors (Prasser et al., 1998) and needle probes (Kataoka et al., 1994; Kataoka et al., 1984) are intrusive techniques which have limited applicability in complex geometries and where high temperature or corrosion are problematic (Bertola, 2003). Optical
techniques such as X-ray transmission imaging has difficulty achieving good contrast in water or steam when it is shielded by the dense, high-Z metal of typical pressurized container, due to the latter being far more attenuating than the former. Even when using relatively high energy X-rays, the polychromatic nature of X-ray tubes result in significant beam hardening artifacts in the resulting images, which hinders production of highly accurate quantitative tomographic data in high pressure scenarios. These and other fundamental issues relevant to computed tomography (CT) in general are discussed in detail inKak et al. (1988) and Carmignato et al. (2018).
Interrogation of test sections can be done using a gamma source, which can avoid beam hardening as emission energies are discrete. Gamma sources also allow relatively convenient access to higher energies compared to standard medical X-ray tubes. This can be employed in a computed tomography arrange- ment in order to get localized information, although it is more commonly applied in a densitometry-style setup where informa- tion is obtained in specific regions or along specific lines (Wang, 2015). Such information can be useful but having a higher degree of spatial detail about a two-phase flow, such as a 2D distribution of time-averaged void fraction which CT can provide, allows a higher-fidelity validation of computational codes. Very few gamma CT systems have been published in literature and they are
https://doi.org/10.1016/j.anucene.2020.108073
0306-4549/Ó2020 The Authors. Published by Elsevier Ltd.
This is an open access article under the CC BY license (http://creativecommons.org/licenses/by/4.0/).
⇑Corresponding author at: Department of Nuclear Engineering and Radiological Sciences, University of Michigan-Ann Arbor, 2355 Bonisteel Blvd., Ann Arbor, MI 48109, USA.
E-mail address:robky@umich.edu(R. Adams).
Contents lists available atScienceDirect
Annals of Nuclear Energy
j o u r n a l h o m e p a g e : w w w . e l s e v i e r . c o m / l o c a t e / a n u c e n e
generally coarsely resolving and based on several bulky commer- cial gamma spectrometers. One notable exception is described in Bieberle et al. (2011) where a high resolution (2 mm) imaging setup was applied to a fuel bundle mock-up. However, there are not flexible, modular, high-resolution systems currently available commercially.
To address this gap in two-phase flow instrumentation, the High-Resolution Gamma Tomography System (HRGTS) has been developed at the University of Michigan (UM) for use in adiabatic and high-pressure two-phase flow experimental facilities as described in detail in Adams et al. (2019). The HRGTS achieved about 1 mm spatial resolution and demonstrated the ability to col- lect suitable tomographic data in about a minute using a nominally 15 Ci Ir-192 source and a rotary stage to move the source and detec- tor around a fixed two-phase flow setup. The system is comprised of 30 modules, each consisting of 8 detectors and capable of being controlled and recording data via Wi-Fi, for a total of 240 individual gamma detectors. The source-detector distance is 800 mm. Each detector consists of a LYSO crystal read out by two silicon photo- multipliers operating in parallel, with two individually software- controllable thresholds per detector. The detector pitch for the pro- totype system was 2.5 mm (with 6 mm height), although the mod- ular approach is flexible and could be adapted to other geometries, detector array sizes, etc. The source and detector array are mounted on a rotary table with a large hole to accommodate tall objects to be imaged, and moves vertically on a gantry to allow layer-by-layer scanning to combine 2D images into 3D images.
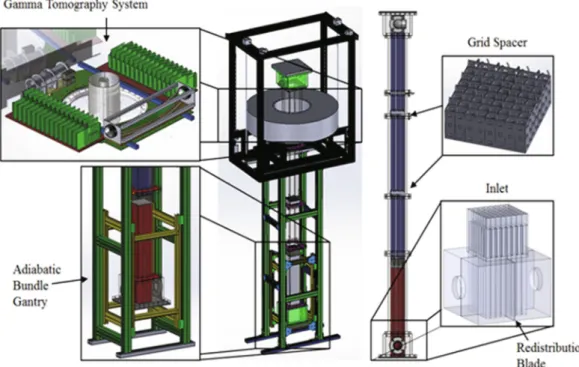
This system is planned to be deployed to perform measure- ments of the Michigan Advanced Rod Bundle fLow Experiments (MARBLE) facility, which is currently being constructed. This facil- ity was initially presented in Diaz et al. (2018), along with pre- liminary results which were built upon in the preparation of the present work. Specifically, among other things, the simula- tions and image reconstruction were improved to reduce artifacts, and the error analysis and discussion were improved and expanded upon. Images giving an overview of this facility can be seen in Fig. 1, and photos of the facility under construction
can be seen inFig. 2. The facility consists of a two-phase flow sec- tion representing an 8x8 nuclear fuel rod bundle. The section to be measured consists of thin-walled stainless steel tubes with a pitch of 21.1 mm, representing fuel pins, each with an outer diameter of 16.0 mm and a wall thickness of 0.6 mm. The facility is 3.6 m in height and is to be operated with air and water in adi- abatic conditions. The air flow is injected at the surface of the rods (same diameter of 16.0 mm) via spargers at a height of 1.0 m, and the spargers can have their flow rates individually adjusted. This allows both symmetric and asymmetric initial void fraction distributions, to investigate effects such as void drift. Grid spacers with mixing vanes have been installed at heights of 1.7 m and 2.6 m to study their influence on the flow. Separate gantry systems individually control the vertical positioning of the MAR- BLE facility and the HRGTS. The facility is expected to achieve maximum gas superficial velocity of 10 m/s and liquid superficial velocity of 1 m/s. This should allow two-phase flow from the bub- bly flow regime up to the initial stages of annular flow. The mod- ular geometry will also allow BWR-like geometries which include part-length rods. The square interior of the test section is defined by an acrylic housing which is 168.3168.3 mm2, resulting in a flow area of 283.2 cm2.
In addition to high-resolution images, one main result of inter- est when applying the HRGTS to the MARBLE facility is the accu- rate and quantitative assessment of the subchannel-averaged void fraction. The potential for achieving such a result was investi- gated by means of numerical simulations of the imaging process for the actual MARBLE geometry. This investigation was done in order to estimate the subchannel void fraction uncertainty as it depends on the measuring time for a given source strength. The numerical simulations were then validated by performing tomo- graphic measurements of a short-length mock-up representing a part of the MARBLE facility. Lastly, tests were made assuming thicker-walled fuel pins in the mock-up, which represent experi- mental arrangements typical of high-pressure systems, to illus- trate the system potential in future applications beyond the MARBLE facility.
Fig. 1.Overview of the MARBLE facility, adapted fromDiaz et al. (2018).
R. Adams, J. Diaz, V. Petrov et al. Annals of Nuclear Energy 154 (2021) 108073
2
2. Theory
The purpose of this section is to give an overview of the tomo- graphic reconstruction process. More in-depth explanations can be found in references indicated in the introduction. Transmission computed tomography is performed by first measuring the atten- uation through an object along many different source-detector lines. A simplified overview of this process is described here in order to establish some parameters used in the simulation. An overview image is given in Fig. 3 for a parallel beam source- detector arrangement, with a 1D measurement intended to pro- duce a 2D tomogram (i.e., 2D macroscopic attenuation map of the object through one slice). For a given projection angle, H, at each detector position a line integral of the object attenuation,
l
ðx;yÞ, along the source-detector path is measured, wherexand ycorrespond to the object coordinates.The so-called projection data,p Rð ;HÞ, represents the collection of these line integrals for each combination of detector position,R, and projection angle, H. The line integral along each source- detector path is calculated using the Beer–Lambert law as shown in Eq. (1), which is described for example in Kak et al. (1988), where Idet is the measured intensity (i.e. gamma counts at the
detector) and Io is the unattenuated intensity (assumed to be constant over the entire detector length, but in a real-world measurement can be a function also ofRandH).
pðH;RÞ ¼ lnIdetðR;HÞ
Io ð1Þ
The 2D collection of all projection data, i.e. the projection data as a function of projection angle and detector position, is known as a sinogram. In addition to a parallel arrangement, the source- detector lines can be in a fan-beam arrangement when the source and detectors are close enough to the object that the angle of the incoming beam is significantly non-parallel. In this case, the detec- tors can be arranged in an arc rather than in a line. Calculation of the tomogram (object attenuation map) from the sinogram can be done in either case using reconstruction techniques such as a fil- tered back projection (FBP) (Kak et al., 1988). An illustration of the fan-beam arrangement of the HRGTS as it is positioned to per- form measurements at the MARBLE facility can be seen inFig. 4. The distances from source to object center (Rso, 400 mm), object center Fig. 2.Overview of the MARBLE facility under construction, top section (left) and lower basement section (right), adapted fromDiaz et al. (2018).
Fig. 3. Overview of computed tomography measurement basics, adapted fromDiaz et al. (2018).
Fig. 4.Schematic of the fan-beam imaging arrangement planned for the MARBLE facility, adapted fromDiaz et al. (2018). The gray square around the flow region is not to scale and in reality is acrylic with a thickness of 24 mm.
to detector (RoD, 400 mm), and source to detector (RsD, 800 mm) are indicated, along with the previously described bundle interior dimensions.
In order to get void fraction data,
a
ðx;yÞ, for a two-phase flow, not only a tomogram of the flow is needed but also two calibration reference images, one in which the system is full of liquid and another in which it is fully voided (air for adiabatic cases, vapor for pressurized cases). The calculation of the void fraction from those three images is given in Eq.(2), wherelindicates liquid (full channel),v
indicates fully void (empty), and 2/ indicates two- phase flow.a
ðx;yÞ ¼l
lðx;yÞl
2/ðx;yÞl
lðx;yÞl
vðx;yÞ ð2Þ By considering the error of the void taken as an average value over a single source-detector path (or ‘‘chord”), indicated asa
ch, the voidfraction can be expressed as the measured intensity (I, detector counts for a given measuring timetat count rate_I) along that chord for the void (
v
), liquid (l), and two-phase (2/) cases as in Eq.(3).a
ch¼ln Ið Þ l ln I2/ln Ið Þ l ln Ið Þv ð3Þ
From one set of flow conditions to the next,I2/ can change (and similarly
l
2/), but the corresponding empty and full channel values do not, so it is assumed that the latter two can be mea- sured for a longer period of time in order to have a negligible contribution to the overall uncertainty. For example, if a flow condition measurement was performed for one minute and it was desired to measure one hundred of such cases, the full and empty measurements might be measured for one hundred minutes each, in which case the overall error for each of the lat- ter would be an order of magnitude lower than the former according to the two-phase case chordal uncertainty analysis which is described later in this section. That scenario would be a third of the total measuring time devoted to each of the full and empty conditions, and the remaining third divided among all varied flow measurement conditions. The choice of measure- ment times for the three categories in a real scenario would depend on time constraints and the number of different flow con- ditions to be measured, among other things, and therefore would be determined on a case by case basis. For the purposes of this work, however, it is assumed that sufficient time is available to measure the full and empty channel conditions long enough for their uncertainty to be negligible compared to a related flow measurement. Using this assumption, the variance of the void fraction along a chord is then given by Eq. (4) according to typical error propagation.r
2ach¼ @a
ch@I2/
2
r
2I2/ ð4ÞUsing Eq.(4), the partial derivative given in Eq.(5), and the variance ofI2/(i.e.,
r
I2/¼ ffiffiffiffiffiffiI2/
p ), the standard deviation of the void fraction along a chord can be expressed by Eq.(6). The relative standard deviation is given in Eq.(7), withI2/separated into its measuring time and count rate.
@
a
ch@I2/ ¼ 1 I2/
1
ln Ið Þ v ln Ið Þl ð5Þ
r
ach¼ 1 ffiffiffiffiffiffi I2/p 1
ln Ið Þ v ln Ið Þl ð6Þ
r
acha
ch ¼ 1ffiffiffiffiffiffiffiffitI_2/q 1
ln I2/ ln Ið Þl ð7Þ
The case of error along a single chord is not precisely analogous to the more complex propagation of error in the case of determining void fraction using tomography. However, the general tendency of which variables influence error, and how, is similar because a tomo- gram is ultimately based upon a combination of chordal measure- ments. First, as ln I2/ ln Ið Þl approaches zero, i.e. when
a
approaches zero, the relative standard deviation approaches infin- ity. Second, a larger difference betweenIlandI2/improves the rel- ative standard deviation of
a
. Third, the relative standard deviation is inversely proportional to ffiffipt
. In a given flow condition and source-detector setup, all values in Eq.(7)are fixed except the mea- suring time. This meanst must be selected carefully in order to achieve a desired relative standard deviation of the void fraction.
In the case of tomography (whether simulated or experimen- tal), the void fraction uncertainty in a given pixel or a given sub- channel is not as straightforward because the value comes from data combined from all projection angles and detector positions, as they are handled simultaneously in the reconstruction process in order to estimate void fraction. However, by repeating a simula- tion with the same parameters (or repeating an experiment with the same conditions) multiple times, the standard deviation can be empirically determined. This determination of void fraction uncertainty can be performed on a subchannel basis (as opposed to, for example, on a pixel-by-pixel basis) as given in Eq.(8), where
r
a;sc is the standard deviation of the subchannel averaged void fraction,iindicates a given repetition of a simulated or measured flow condition, andnis the number of repetitions.r
a;sc¼ffiffiffiffiffiffiffiffiffiffiffiffiffiffiffiffiffiffiffiffiffiffiffiffiffiffiffiffiffiffiffiffiffiffiffiffiffi 1
n Xn
i¼1
a
sc;ia
sc2
vu
ut ð8Þ
Two types of scattering interactions have the potential to influence image quality. One is from gamma photons which are emitted by the source and scatter somewhere in the room besides the object (e.g., nearby equipment, floor, walls, etc.) and then subsequently interact with a detector. This term is assumed to be essentially unchanging between full, empty, and two-phase conditions of the facility. It therefore represents a constant term which cancels out when calculating void fraction. The second type of scatter to be con- sidered is when a photon interacts with an object being imaged (the contents of the flow channel in this case) and subsequently reaches a detector and is counted. In some imaging setups, particularly with a parallel beam arrangement where the object is close to the detec- tors, this can be a significant unwanted effect. With a fan beam, however, the increased object to detector distance means that the detector covers a relatively small solid angle fraction of the range of directions that object-scattered photons can travel after interact- ing with the object. For example if a detector with a face of 2.56 mm2is at a distance off 200 mm, the solid angle fraction covered by the detector is 3 106. In reality there are many detectors and some forward bias of the scattering, but this fraction would still be relatively small. A further point which reduces the influence of both types of scattering is that the detectors are operated in an event counting mode with an energy threshold. After scattering, a gamma photon will lose some energy and then becomes less likely to be registered by a detector even if it interacts in the scintillator volume. Considering all of these points, scattered flux was not con- sidered further in this work. In case scattered flux were an issue, it could also be reduced with by collimation on the source and/or detector sides of the object.
3. Imaging simulations
Simulations of the imaging process were made as described in the computational steps explained in this section. The overall goal
R. Adams, J. Diaz, V. Petrov et al. Annals of Nuclear Energy 154 (2021) 108073
4
was estimating the subchannel void fraction standard deviation as described in Eq.(8)for different measuring times, based at first on the MARBLE test section and associated imaging system previously described. The simulations were implemented in custom MATLAB (MATLAB, 2019) scripts which were used for the basic data pro- cessing along with the ASTRA Toolbox (van Aarle et al., 2016) for forward and back projection steps. Default toolbox settings were used unless otherwise noted, including the Ram-Lak filter in the case of the filtered back projection. This simulation process started with generating ideal attenuation maps for the three cases empty, full, and two-phase. For the two-phase case, subchannels were defined using pin-centered subchannels because it was more con- venient to practically implement in the code. This is slightly differ- ent to the experimental data processing which was performed with subchannel centering (i.e., defined according the center of the sub- channel itself) although the geometry is periodic so this does not fundamentally change the result and the two are essentially inter- changeable. For the full and empty case, the fluid content does not change from one subchannel to the next so the location of the sub- channel centering (and respective subchannel boundaries) does not influence the result. The void fraction was defined from 1.5%
to 96% in steps of 1.5% across the 64 subchannels. The attenuation maps are shown inFig. 5. Within a given subchannel, the void frac- tion was homogeneously defined. Using these attenuation maps, ideal (noise-free) forward projection data was calculated for a given source-detector geometry and number of projections.
A parameterInpswas used as a basis to add noise to the images.
This parameter can be considered as the number of counts a given detector would receive at a given projection measurement if there were no object present, which is a linear combination of several parameters. ThisInpsvalue contributes to the effective noise for a given measurement setup, and is based on source strength (Isource), source yield per decay (
c
), detector efficiency (det),detector area (A), total measuring time for all projections combined (t), and source to detector distance (RSD). The combination of these parameters defineInpsas given in Eq.(9). This parameter was used in the simulations instead of, for example, measuring time, because the sameInpscan be obtained for different measuring times if other parameters are changed to compensate the change in measuring time. For example, if the source strength is doubled and the measuring time is halved, the effectiveInps is the same, and the noise in the image does not change.
Inps¼Isource
c
detAt4
p
R2SDð9Þ
Random noise was added individually to each detector in the for- ward projection data based on position and projection angle, assuming a Poisson distribution, for a given value ofInps. Specifi- cally, the forward projection data provides a set of expected values of counts at each detector assuming no noise is present. The noise was applied using the MATLAB function ‘‘poissrnd” which generates a set of random values according to the expected values. That noise is essentially added to the sinogram representing the measurement, IdetðR;HÞ, described in Eq.(1). This was done only for the two-phase case, because as previously described it was assumed the empty and full channel reference images could be measured for a longer period of time in order to reduce their associated uncertainties such that their contribution to the overall uncertainty becomes negligi- ble. In all cases 1080 projection angles were used. After noise was applied, filtered back projection was used to produce a recon- structed tomogram. From this tomogram, for a given repetition (i), void fraction was calculated (averaged over each subchannel) as described in Eq.(2). From many repetitions of this entire simu- lated imaging process, the subchannel void fraction, standard
Fig. 5.Images of phantoms used for simulation, where grayscale values are normalized for each image.
deviation, and relative standard deviation are then calculated as previously described in Eq.(8)for several values ofInps.
The results of these simulations from an implementation of 500 repetitions of each two-phase case, for different Inps values, are
shown inFigs. 6 and 7. This quantity of repetitions was chosen arbitrarily as a balance between keeping computational time mod- erate and generating statistically meaningful results which, from looking at the resulting figures, clearly show the trends that are not significantly disturbed by noise. The presented results are obtained using the previously described MARBLE facility dimensions and material properties for a gamma energy of 475 keV (corresponding to one of the main Ir-192 emission lines).
As expected the error increases asymptotically towards a void frac- tion of zero, and reduces with increasingInps. The results show an acceptable relative standard deviation of the void fraction of up to a couple percent over most of the void fraction range, even with modest values ofInpsof 1000 or 2000. This can be used as a basis for approximating an overall measuring time for the case of the HRGTS. The typical detector count rate is on the order of 104s1, so for 1080 projections this would mean forInps values of 1000 an overall measuring time of about 108 s. This means that the HRGTS is expected to achieve sub-channel void fraction measure- ments of the MARBLE facility with satisfactory accuracy with a measuring time on the order of 1-2 min.
4. Imaging experiments
Physical small scale mock-ups of the MARBLE facility were used to validate the capability of the HRGTS to measure the void fraction on a subchannel basis. The test setup consisted of a 4x4 array of a short length of the thin-walled stainless tubes with the same geometry (pitch and tube dimensions) as that of the MARBLE setup. These short tube sections are held in place by a 3D printed holder piece. Inserts could be placed individually in each subchan- nel in order to simulate some liquid flow within each subchannel.
These inserts were held in place hanging from a 3D printed piece mounted above the lower piece which holds the tubes. In this way, the inserts do not touch the tubes and do not cause any issue with image alignment from one measurement to the next. Short lengths of plastic rods, rather than a more complicated shape, were used as inserts so that the dimensions and therefore the theoretical or expected void fraction within the subchannel could be well defined. Three measurements were performed, one with no inserts present (representing an empty system), one where all subchan- nels contained the largest diameter of plastic (representing a full of liquid system), and another where the insert diameter varied from one sub-channel to the next. Photos of the setup can be seen inFig. 8. The expected void fraction within a given subchannel was equal to the difference in area between the ‘‘varied” insert rod and the ‘‘full” insert rod, divided by the area of the ‘‘full” insert rod.
The resulting tomographic reconstructions for each of the three cases, along with differential images, can be seen in Fig. 6.Absolute standard deviation of void fraction for different Inps values
(indicated in legend) over the range of defined void fraction values.
Fig. 7.Relative standard deviation of void fraction for different Inps values (indicated in legend) over the range of defined void fraction values.
Fig. 8.Photos of adiabatic loop mockup showing the stainless steel tube sections only (left), the varied diameter inserts (middle), and the two combined (right).
R. Adams, J. Diaz, V. Petrov et al. Annals of Nuclear Energy 154 (2021) 108073
6
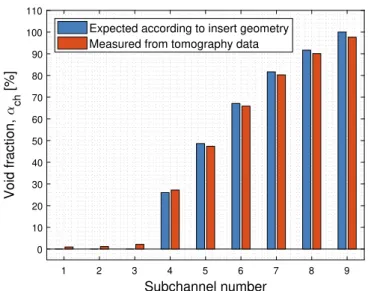
Fig. 9. The tubes and inserts are well resolved. The void fraction calculated on a subchannel basis along with the expected values according to the insert diameters can be seen in Fig. 10. Good agreement was found between the expected values and those measured using tomography, with the absolute error in void frac- tion percent of less than 2% in all cases. Some of this error is due to uncertainties of the exact dimensions of the inserts themselves (i.e., mechanical tolerances) rather than the void fraction mea- surement technique itself.
In order to test a more demanding case representing a pressur- ized flow loop design, a second set of measurements was performed with thick-walled Incoloy tubes instead of the thin-walled stainless
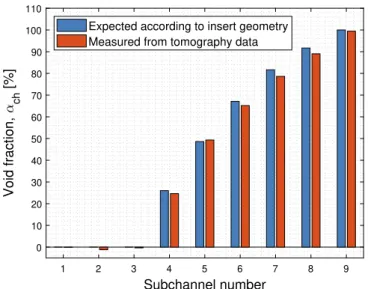
ones. The Incoloy tubes had an outer diameter of 9.6 mm, a wall thickness of 1.1 mm, and the same pitch as the previous case. They were held in place by a piece of wood, but the inserts and general measurement approach was otherwise the same. A photo of the setup can be seen inFig. 11. The tomographic images of the bundle interior can be seen inFig. 12. Compared to the images with thin- walled tubes, the tubes appear brighter and with higher contrast relative to the plastic inserts due to them being thicker and more strongly attenuating. Still, the inserts are well-resolved despite this added challenge in contrast. The differential images are of a similar quality. The subchannel void fraction results can be seen inFig. 13.
The error in all cases was less than 3%.
Fig. 9. Experimental tomographic reconstruction of the abiabatic bundle mockup interior for the three cases, along with two difference images and a map of the defined subchannel positions.
Fig. 10.Expected and measured subchannel void fraction for the adiabatic bundle mockup.
Fig. 11.Photo of pressurized loop mockup showing inserts along with incoloy tube sections.
5. Conclusions and outlook
This work described simulations and experiments related to the use of gamma tomography for quantitative void fraction measure- ments in nuclear fuel bundle mock-ups. The simulations focused on MARBLE, an 8x8 subchannel adiabatic test loop currently being prepared. The simulation results estimate a good void fraction accuracy on the order of 1% for measurements of the MARBLE facil- ity using the existing HRGTS setup, for measuring times on the order of 1 min. A test phantom representing a quarter of this MAR- BLE facility was used for experimental validation of the system.
These measurements showed good agreement with the expected void fraction within the mockups. A second set of measurements was performed with thicker-walled Incoloy tubes rather than the thin-walled stainless tubes of the MARBLE facility in order to see
how measurement of this more demanding case, representative of high-pressure flow loop systems, would perform. Good quanti- tative void fraction measurements were again achieved. These efforts show overall that gamma tomography is a reliable tool for obtaining subchannel void fraction information in flow loops, which is of particular value in cases where other measurement techniques cannot be applied. This includes complex flow channel geometries and those with high pressure and temperature. It is planned to apply this technique to measure the spatial void frac- tion distribution within the MARBLE facility and other demanding cases in order to gain high quality data relevant to fluid dynamics studies and computational code validation.
Declaration of Competing Interest
The authors declare that they have no known competing finan- cial interests or personal relationships that could have appeared to influence the work reported in this paper.
Acknowledgments
The authors are grateful for funding provided by the U.S.
Nuclear Regulatory Commission through grant NRC-HQ-13-C-04- 0022.
References
Liu, H., Hibiki, T., 2017. Flow regime transition criteria for upward two-phase flow in vertical rod bundles. Int. J. Heat Mass Transf. 108, 423–433.
Venkateswararao, P., Semiat, R., Dukler, A.E., 1982. Flow pattern transition for gas- liquid flow in a vertical rod bundle. Int. J. Multiph. Flow 8, 509–524.
Paranjape, S., Chen, S., Hibiki, T., Ishii, M., 2011. Flow regime identification under adiabatic upward two-phase flow in a vertical rod bundle geometry. J. Fluids Eng. 133.
Bestion, D., Anglart, H., Mahaffy, J., Lucas, S.C., Scheuerer, D.M., Zigh, G., Andreani, M., Kasahara, F., Heitsch, M., Komen, E., Moretti, F., Morii, T., Muehlbauer, P., Smith, B., Watanabe, T., 2014. Extension of CFD Codes Application to Two-Phase Flow Safety Problems – Phase 3 (NEA-CSNI-R-2014-13). Nuclear Energy Agency of the OECD (NEA).
Fig. 12. Experimental tomographic reconstruction of the pressurized bundle mockup interior for the three cases, along with two difference images and a map of the defined subchannel positions.
Fig. 13. Expected and measured subchannel void fraction for the pressurized bundle mockup.
R. Adams, J. Diaz, V. Petrov et al. Annals of Nuclear Energy 154 (2021) 108073
8
Prasser, H.M., Böttger, A., Zschau, J., 1998. A new electrode-mesh tomograph for gas- liquid flows. Flow Meas. Instrum. 9, 111–119.
Kataoka, I., Ishii, M., Serizawa, A., 1994. Sensitivity analysis of bubble size and probe geometry on the measurements of interfacial area concentration in gas-liquid two-phase flow. Nucl. Eng. Des. 146, 53–70.
Kataoka, I., Ishii, M., Serizawa, A., 1984. Local formulation of interfacial area concentration and its measurements in two-phase flow. Argonne National Lab.
Bertola, V. (Ed.), 2003. Modelling and Experimentation in Two-Phase Flow.
Springer-Verlag Wien.https://doi.org/10.1007/978-3-7091-2538-0.
Kak, A.C., Slaney, M., 1988. Principles of computerized tomographic imaging.
Engineering 33, 327.https://doi.org/10.1118/1.1455742.
Carmignato, S., Dewulf, W., Leach, R. (Eds.), 2018. Industrial X-ray computed tomography, vol. 33. Springer International Publishing.
Wang, M. (Ed.), 2015. Industrial Tomography. Woodhead Publishing.https://doi.
org/10.1016/B978-1-78242-118-4.12001-5.
Bieberle, A., Hoppe, D., Schleicher, E., Hampel, U., 2011. Void measurement using high-resolution gamma-ray computed tomography. Nucl. Eng. Des. 241, 2086–
2092.https://doi.org/10.1016/j.nucengdes.2011.03.028.
Adams, R., Diaz, J., Petrov, V., Manera, A., 2019. Development and testing of a high resolution fan-beam gamma tomography system with a modular detector array. Nucl. Instrum. Methods Phys. Res., Sect. A 942,.https://doi.org/10.1016/j.
nima.2019.162346162346.
Diaz, J., Adams, R., Petrov, V., Manera, A., 2018. Detailed measurements of void- fraction distribution in an adiabatic fuel bundle performed with high resolution gamma-ray tomography imaging. In: 18th International Topical Meeting on Nuclear Reactor Thermal Hydraulics – NURETH..
MATLAB, 2019. version R2019a, The MathWorks Inc., Natick, Massachusetts..
van Aarle, W., Palenstijn, W., Cant, J., Janssens, E., Bleichrodt, F., Dabravolski, A., De Beenhouwer, J., Batenburg, K., Sijbers, J., 2016. Fast and Flexible X-ray Tomography Using the ASTRA Toolbox. Opt. Express.