Waste Incineration
Operating Experience with Plants with High Steam Parameters
Michael Mück
1. Thermodynamic background ...242
1.1. Theoretical influence of high steam parameter ...244
1.2. Full cost evaluation ...245
2. Corrosion mechanism and influence parameter ...247
2.1. Mechanism and parameter ...247
2.2. Monitoring ...255
2.3. Plant feedback ...256
3. Current status /design parameter of plants ...258
3.1. Overview of plants in Germany ...258
3.2. Experience of plants with high steam parameters from literature ...260
3.3. Steam parameters of delivered plants ...271
4. Feedback according to challenges and developments of plants with different parameters and boiler concepts ...274
4.1. Plants with live steam temperature below 400 °C ...275
4.2. Plants with steam temperature of 400 °C live ...275
4.3. Plants with live steam temperature between 400 °C and 450 °C ...275
4.3.1. Horizontal boiler type ...275
4.3.2. Vertical boiler type ...276
4.4. Plants with parameter above 450 °C ...276
4.4.1. Horizontal boiler type ...276
4.4.2. Vertical boiler type ...276
4.5. Plant with reheating of steam ...276
4.6. Plant with external super-heater ...277
5. Evaluation of heat surface life time and maintenance costs ...277
6. Conclusion ...283
7. Literature ...285
Waste Incineration
Waste to energy plants had a clear defined task: The safe disposal of waste. Energy was a by-product and in the 60s and 70s the energy was dissipated in the atmosphere [17].
After the first waste incineration plants were built with moderate life steam parameter, the energy business asked for higher efficiency and changed the view from burning waste to energy production. Requirements from the legislative authority like R1-factor did their part. But not only this item was a driver. Requirements from existing power stations where the waste fired boiler is just a supplier of steam, high benefit for electrical output or the pre-sorting of waste are drivers for high steam parameters.
In the meantime, a lot of articles where published to describe:
• benefit and impact of high steam parameter,
• experience with high steam parameter plants,
• corrosion mechanism,
• realised modifications and material tests on plants, and
• benefit of retrofit measures.
This technical paper has the objective to summarize the different influences why high parameters are chosen for some plants. The technical consequences for realising the boiler concept and what are the challenges and feedback during operation.
An analysis of the feedback from different plants build by Steinmüller Babcock Envi- ronment according to life time of boiler parts, availability and maintenance costs may give an answer to the question, which parameter are promise the best results.
1. Thermodynamic background
Increasing of efficiency is on everyone lips like stated in several reports and presentations [2, 5, 6, 17, 20]. Main reason is the higher economic pressure like increase of energy and maintenance cost and lost money by outage.
Higher efficiency is influenced by:
• efficiency of the waste fired boiler including the flue gas system, and
• efficiency of the water steam cycle.
Like described in [2, 17, 23], the boiler efficiency can be influenced by:
• combustion air ratio and air preheating,
• good burn out quality,
• maximum use of heat out of the flue gas,
• reducing of losses,
• optimising of combustion control for a constant operation and
• optimising of start up and shut down processes.
On the other hand, the total efficiency of a plant is depending on:
Waste Incineration
• efficiency of the boiler,
• steam parameter,
• condensate parameter and cooling system,
• efficiency of the steam turbine,
• using of low pressure steam for combustion air preheating,condensate and feed water preheating, and
• possible use of multi stage steam super heating.
A possibility to visualise this matter is shown in the following diagram.
s kJ/(kg K) Temperature
T
0 K
3
K
1 2
4
improvement of live steam condition
multi-stage steam overheating
lowering the condensation pressure feedwater
preheating
Figure 1: Measures to increase plant efficiency
Source: Schu, R.; Leitner, R.: Mehrstufige Dampfüberhitzung-Effizienzsteigerung von EBS-, Biomasse- und Solarthermiekraft- werken. Berlin: Berliner Abfallwirtschafts- und Energiekonferenz, January 2008.
In Figure 1 you can find the following message: As greater the area inside the marking, as higher the energy output.
Some of the measures are influencing each other, for example the use of flue gas for condensate reheating and the use of low pressure steam for condensate preheating.
Increasing of efficiency is limited and this as well by risks according to the size of a plant, the availability and costs of material as well as the silent risks like corrosion and fouling. Higher efficiency has its costs as well as risks [17] and efficiency and economic benefits on the other hand.
Waste Incineration
1.1. Theoretical influence of high steam parameter
In several publications [5, 6] the design concepts of waste fired boilers are explained.
The conclusion is more or less, that the parameter 40 bar/400 °C builds an optimum regarding availability, outage time and maintenance costs and is the basis for further developments.
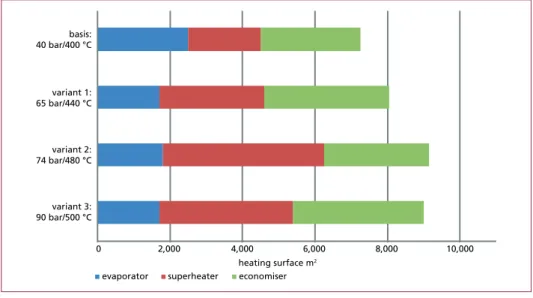
In [5] a variation of the steam parameter from 40 bar/400 °C to 65 bar/440 °C, 74 bar/480 °C and up to 90 bar/500 °C was evaluated.
For high parameter a design is shown with a super-heater placed in the second pass (radiation part). The conclusion of this comparison is shown in the following table:
Table 1: Comparison of different steam parameters according to steam flow, efficiency, heat surface, size and electrical output
Alternative Unit Basis
40 bar/
400 °C
1 65 bar/
440 °C
2 74 bar/
480 °C
3 90 bar/
500 °C
steam flow t/h 69.76 68.32 66.23 65.53
boiler efficiency % 82.00 82.00 82.00 82.00
heating surface total m² 7,347 8,053 9,119 8,985
deviation in the heating surface % - + 10 + 24 + 22
deviation in the boiler length % - + 2 + 5,2 + 2,6
turbine power MW 14.47 15.1 16,04 16.35
gross electrical efficiency % 23.00 24.00 25.50 25.90
Source: Dräger, R.; Seitz, A.; Gohlke, O.; Busch, M., Energieeffizienz und Kesselkonzepte. n: Thomé-Kozmiensky, K. J.; Beck- mann, M. (Eds.): Energie aus Abfall, Band 7. Neuruppin: TK Verlag Karl Thomé-Kozmiensky, 2010, pp. 235-256.
0 2,000 4,000 6,000 8,000 10,000
variant 3:
90 bar/500 °C variant 2:
74 bar/480 °C variant 1:
65 bar/440 °C basis:
40 bar/400 °C
heating surface m2 evaporator superheater economiser
Figure 2: Comparison of amount of heat surface (of different types) depending of the steam parameter
Source: Dräger, R.; Seitz, A.; Gohlke, O.; Busch, M., Energieeffizienz und Kesselkonzepte. In: Thomé-Kozmiensky, K. J.; Beck- mann, M. (Eds.): Energie aus Abfall, Band 7. Neuruppin: TK Verlag Karl Thomé-Kozmiensky, 2010, pp. 235-256.
Waste Incineration
The following results are pointed out:
• over proportional increase of super-heater surface with similar part load behaviour,
• more boiler house length necessary, and
• higher cost for maintenance of super-heater.
Especially the increase of electrical efficiency for the last step from 74 bar/480 °C to 90 bar/500 °C with 0,4 %-points is quite small related to the invest and maintenance costs [5].
As well [6] it is pointed out, that parameter of 500 °C live steam temperature are only reachable, when the flue gas temperature is above 650 °C to make sure, that the tem- perature difference for a basic fouled boiler is sufficient as well.
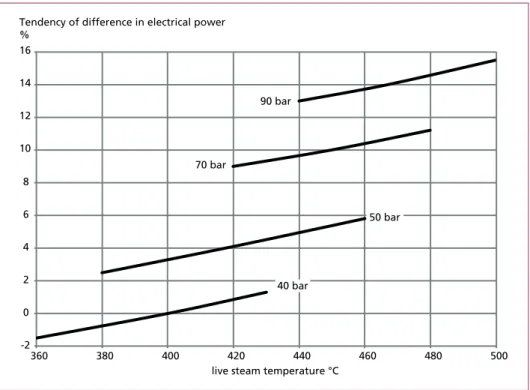
Steam temperature and pressure are mostly in relation to each other. Related to the standard parameter 400 °C/40 bar the tendency and influence of different combinations to the electrical power is shown in Figure 3.
-2 0 2 4 6 8 10 12 14 16
360 380 400 420 440 460 480 500
Tendency of difference in electrical power
%
live steam temperature °C 40 bar
50 bar 70 bar
90 bar
Figure 3: Tendency of difference in electrical power depending on the steam temperature and pressure
1.2. Full cost evaluation
All this publications are more or less based on theoretical considerations. Additional investigations [14] try to take into consideration:
• additional costs for Inconel,
• additional super-heater costs,
Waste Incineration
• exchange costs for super-heater,
• costs for super-heater replacement,
• costs of additional down time, and
• revenue assumptions.
This seems to be a more detailed way to evaluate the real benefit of different parameters as well the calculation is based on figures which can be different from plant to plant.
Table 2: Power output versus steam parameter (Case study)
Variant
Design parameter
Additional inconel
costs compared
to base variant 400/40
Additional super- heater cost
compared to base variant 400/40
Frequency of super-
heater exchange
Cost of su- perheater replace-
ment
Cost of additional down-time
Difference in power production
°C/bar mill EUR years mill EUR/
time
mill EUR/
time MW
1 400/40 - - 15 0.9 0.5 0
2 425/50 1.6 0.9 11 1.1 0.52 0.91
3 450/60 3.2 2.1 7 1.65 0.54 1.62
4 480/70 4.8 3.2 4 2.2 0.56 2.13
To get a realistic picture, it is important not only to see the benefit of power production.
On the other hand other factors need to be evaluated, like shown in the table above:
• annual operating hours and tonnage per line
• own consumption
• project period and real discount rate
• boiler efficiency
• turbine efficiency
• NPV factor
• power sale price
• power value EUR/year
• gate fee
• invest costs
• maintenance costs/Exchange rate
• length of downtime period.
This leads to the evaluation of the Net present value (NPV). This measure accounts the time value of money. It provides a method for evaluating and comparing capital projects or financial products with cash flows spread over time.
Waste Incineration Figure 4: Net present value as function of the design steam parameters (case study)
Related to the plant condition in the above mentioned project the result for the highest NPV is a realisation with steam parameter of 50 bar and 425 °C.
2. Corrosion mechanism and influence parameter 2.1. Mechanism and parameter
Corrosion mechanism is a wide and complicated issue, influenced by a large number of parameters and mechanism. Since the focus of waste to energy plants is not anymore only on burning waste, efficiency and availability are important issues, as well as outage time and maintenance costs.
In literature can be found a lot of theoretical and practical articles which give an over- view about these matters.
Corrosion attack from the flue gas side has the most important economic influence of all corrosion damages [20]. Related to a life time of a boiler pipe of ten years, corrosion rates of 0,025 mm/1,000 operating hours are moderate, but related to super-heater tubes, as well rates of 1 mm/1,000 h are given [20].
The nature of corrosion is characterised by three principle difficulties [20]:
• Just a local limited corrosion attack can lead to a break in the tube and can lead to damage and risk.
• It is not possible to monitor the complete heating surface during operation; as well covered areas cannot be reviewed.
400 °C / 40 bar 425 °C / 50 bar 450 °C / 60 bar 480 °C / 70 bar Tendency of NVP in 25 years of operation
Waste Incineration
• Parts of the heating surface are in the middle of a bundle and not reachable.
• Corrosion is influenced by thermal, chemical and mechanical reasons which are in interaction or can be in overlay. As well the reaction kinetic properties are from main importance. As a result, corrosion is a sum or potentiated effect of single influences. This leads to the fact, that corrosion effects cannot easily be generalised and transferred.
Details and explanations are explained in various presentations [1, 8, 12, 18, 19, 20, 21, 22, 24, 25, 26] about the mechanism and the effects. A curios matter is the behaviour of the corrosion rates during operating time, as shown in the following figure.
0 0.25 0.50 0.75 1.00 1.25 1.50
0 5,000 10,000 15,000 20,000 25,000 30,000
Corrosion rate mm / 1.000 h
Operating time h
Figure 5: Dynamic of corrosion at super-heater tubes (example from existing plant)
Source: Spiegel, W.; Herzog, T.; Magel, G.; Müller, W.; Schidl, W.; Albert, F. W.: Korrosion in Abfallverbrennungsanlagen.
Augsburg: Chemin GmbH.
This figure as a result of a waste to energy plant shows, that especially with clean pipes the corrosion dynamic is different than with a fouling layer. The mechanism inside the fouling and as well the influence to high temperature chlorine corrosion is very complex.
Other behaviours, where corrosion ratios are going up and down depending on waste quality are seen as well. This makes it very difficult to estimate a life time of the heating surface and corrosion risk.
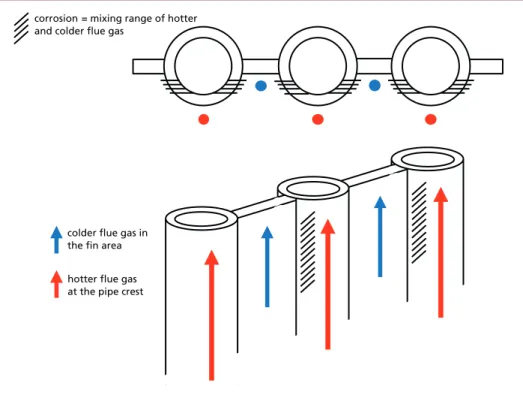
The corrosion of evaporator heating surfaces follows other mechanism. Different heat flows, temperatures and velocities in the area of the evaporator walls have an influence on the corrosion. The pipe edges are a preferred place where the mixture of different flue gas temperatures leads to precipitation of saturated salt loads. [20]
Waste Incineration
Figure 6: Mixture of cold and hot flue gas close to evaporator wall
Source: Spiegel, W.; Herzog, T.; Magel, G.; Müller, W.; Schidl, W.; Albert, F. W.: Korrosion in Abfallverbrennungsanlagen.
Augsburg: Chemin GmbH.
In general different corrosion mechanism and phenomena can be pointed out:
• high temperature chlorine corrosion,
• molten salt corrosion,
• corrosion by salt solution and dew point, and
• erosion corrosion.
The corrosion mechanism, as well the chemical, mechanical and thermal influence factors, are direct or indirect influenced by the fuel characteristic, the combustion and the temperature dissipation in the flue gas. This matter is quiet complex and shows that a single comparison of corrosion behaviour is not as simple as it seems.
The following figures show the influence of the flue gas temperature and the heating surface wall temperature related to the corrosion ratio.
The figures show the principal trend of corrosion ratio depending on wall and flue gas temperature.
In contrast to the convection heat surfaces, the radiation part can be characterised by different parts of boiler passes, split into corrosion zones.
corrosion = mixing range of hotter and colder flue gas
colder flue gas in the fin area
hotter flue gas at the pipe crest
Waste Incineration
Figure 7: Corrosion rate as function of flue gas temperature (measurement of existing plant with tube temperature of 430 °C)
Source: Waldmann, B.; Schrupp-Heidelberger, D.; Stöcker, B.; Haider, F.; Horn, S. R.; Maisch, S.; Warnecke, R.; Müller, V.:
Korrosionsmonitoring in Abfallverbrennungsanlagen. In: Thomé-Kozmiensky, K. J.; Beckmann, M. (Eds.): Energie aus Abfall, Band 6. Neuruppin: TK Verlag Karl Thomé-Kozmiensky, 2009, pp. 461-478.
0 1 2 3 4 5 6 7 8 9
550 600 650 700 750 800 850 900
Corrosion ratio mm/a
Flue gas gas temperature °C
200 300
400 500
600
0.0 0.5 1.0 1.5 2.0 2.5 3.0 3.5 4.0 4.5 5.0 5.5 6.0
300 400 500 600 700 800 900 1,000 1,100
Pipe wall temperature °C Corrosion
mm/a
Exhaust gas temperature °C
Figure 8: 3D-Model of corrosion diagram with lines of equal corrosion rates
Source: Waldmann, B.; Schrupp-Heidelberger, D.; Stöcker, B.; Haider, F.; Horn, S. R.; Maisch, S.; Warnecke, R.; Müller, V.:
Korrosionsmonitoring in Abfallverbrennungsanlagen. In: Thomé-Kozmiensky, K. J.; Beckmann, M. (Eds.): Energie aus Abfall, Band 6. Neuruppin: TK Verlag Karl Thomé-Kozmiensky, 2009, pp. 461-478.
Waste Incineration
The sketch above shows the three parts of the radiation heating surface with different characteristics. S1 with restricted heat transfer with respect residence time requirements, S2 with high temperatures and influences from velocity and fouling related to corrosion behaviour. S3 is important to cool down the flue gas and is also influenced by fouling in relation to corrosion aspects. Especially in the area where the flow direction changes and which is influenced by cleaning systems and their cycles, the corrosion dynamic will be different and can lead to high losses of wall thickness [20]. The chosen steam pressure and related to this the evaporator temperature can influence the corrosion ratio as well. Protection by Inconel reaches its limit in this case, like shown in a later evaluation.
Molten salt corrosion and high temperature chlorine corrosion are the main mecha- nism for super-heater surfaces. The chosen live steam temperature is the main driver and is characterised in the so called corrosion diagram which is described later. By separating the salts dissolved in the exhaust gas, by the significantly increased flow rates of the exhaust gas into the bundle and by the very large surface, contact heating surfaces can act as filters which fix part of the particle charge of the exhaust gas in the form of linings and create the basis for the corrosion attacks [20]. The content of the flue gas, temperature level of the flue gas and tube, the heat flux, as well as the material have the highest impact.
The increasing of corrosion load is also influenced by legal requirements and economical reasons. As answer different protection developments from ceramic material to Inconel layers were developed and tested with different success. In additional to refractory in the combustion chamber and lower part of the first pass, Inconel layer with Alloy 625 and 686 are used and approved for radiation pass as well as for super-heater bundles, but also reach their limit. Several other layer materials are available on the market.
Figure 9:
Zones of different corrosion risk
Source: Spiegel, W.; Herzog, T.; Magel, G.; Müller, W.; Schidl, W.; Albert, F. W.:
Korrosion in Abfallverbrennungsanlagen.
Augsburg: Chemin GmbH.
Waste Incineration
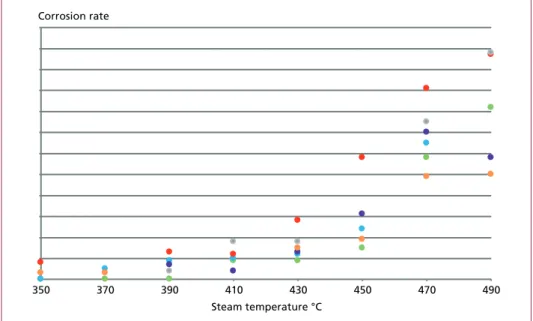
Further investigations come to the result, that the corrosion attack starts from a tube temperature of 380 °C related to the fuel quality of the tested plant (600 °C flue gas temperature) [21]. As well the comparison between 400 °C steam temperature and 450 °C steam temperature shows a significant increase of corrosion attack like shown in the following figure.
350 370 390 410 430 450 470 490
Corrosion rate
Steam temperature °C
Figure 10: Corrosion rate of different protection layers/pipe materials
Source: Spiegel, W.; Schneider, D.; Kaiser, M.; Molitor, D.; Brell, J.; Kuttner, T.: Korrosionsschutz und Werkstoffwahl in Ab- fallverbrennungsanlagen, Ersatzbrennstoff-Kraftwerken und Biomasseanlagen. In: Thomé-Kozmiensky, K. J.; Beckmann, M.
(Eds.): Energie aus Abfall, Band 12. Neuruppin: TK Verlag Karl Thomé-Kozmiensky, 2015, pp. 223-242.
The evaluation of the influence of different protecting materials comes to the result, that it is possible to reduce the corrosion rate [21].
By studying the different articles and experiences, it can be pointed out that the corrosion which leads to a damage is often just a small area caused by tup-shaped corrosion and is not related to the whole pipe or heating surface part (Figure 11) [24]. Unfortunately the boundary conditions are often outside the corrosion area of the corrosion diagram.
To paint a picture of the partly very individual corrosion processes, different systems to monitor and evaluate the mechanism are developed. An example is described in [24]
by a sonde which transfers the corrosion rate into a flow of electrons. By this measure- ment the influence of material, fuel, flue gas and steam temperature can be evaluated.
It is pointed out, that in a long term test the influence of different parameters and the corrosion behaviour can be evaluated and used as basis for further improvements.
But also with balancing the material the corrosion phenomena can not be answered.
So the Flingern’sche Corrosion Diagram was a good help for engineers to get a picture about the corrosion risk [1]. But like almost with simplified diagrams the risk is that
Waste Incineration
the interpretation gives place for misunderstanding. In [1] a context is been given between saturation concentration of various halogens, heat flux, surface temperature and flue gas temperature. As well the influence of velocity in the form of Äquikalore, the fouling influence to the surface temperature and the content of the flue gas is taken into account. Finally it is pointed out that also geometry and flue gas content has a major influence to heat flux and the corrosion as result.
0 1 2 3 4 5
0 5,000 10,000 15,000 20,000 25,000 30,000
Remaining wall thickness mm
Operating time h course with normal corrosion
pipe cracks changes due to
trough-shaped corrosion
measured values: residual wall thicknesses
Figure 11: Measurements of wall thicknesses, estimation of development during normal operation and worst case
Source: Spiegel, W.; Herzog, T.; Magel, G.; Müller, W.; Schmidl, W.: Dynamische chlorinduzierte Hochtemperaturkorrosion von Verdampfer- und Überhitzerbauteilen aufgrund spezieller Belagsentwicklungen: Häufiger Befund in Abfall- und Biomasse gefeuerten Dampferzeugern. Augsburg: Chemin GmbH.
fly ash downstream
boiler with 15mass content-%
Cl fly ash upstream
convection part with 17mass content -% Cl
boiler ash with5mass content -% Cl c oating
with3mass content-% Cl
Figure 12:
Chlorine content in the area of a boiler tube
Source: Warnecke, R.: Korrosions- diagramm – Keine Abhängigkeit vom Chlor? Düsseldorf: 13. VDI-Konferenz – Feuerung und Kessel, Beläge und Kor- rosion in Großfeuerungsanlagen, 2014.
Waste Incineration
250 300 350 400 450 500
300 400 500
600 700 800
900 1,000 1,100
1,200
Tube wall temperatures
°C
flue gas temperatures °C superficial velocity average chlorine-mass fraction in the fuel
superheater 1 superheater 3
superheater 2 extended
corrosion area
indifferent corrosion area
area v ≈ 5 m/s and
WBr,Cl ≈ 0.5 - 1,0 mass fraction - %
v ≈ 10 - 15 m/s and
WBr,Cl ≈ 0.5 - 1.0 mass fraction - %
v ≈ 5 m/s and
WBr,Cl ≈ 1.5 - 2.0 mass fraction - %
v WBr,Cl of catastrophic corrosion
low corrosion area
Figure 13: Modified corrosion diagram extended by velocity and chlorine content
Source: Warnecke, R.: Korrosionsdiagramm – Keine Abhängigkeit vom Chlor? Düsseldorf: 13. VDI-Konferenz – Feuerung und Kessel, Beläge und Korrosion in Großfeuerungsanlagen, 2014.
Table 3: Chlorine in waste
Mixed fraction Composed of the analysis substance groups
Share of residual waste
% TS
Water content
%
Chlorine content
%
fine waste fine waste 12.6 28.7 0.25
middle waste middle waste 11.6 49.7 0.48
organic organic 14.1 61.3 1.1
paper, cardboard, catonage paper, cardboard, catonages 10 21.9 0.59
synthetic materials plastic packaging incl. foils 9.5 14.3 2.7
textiles textiles
shoes 5.2 12 1.01
composites
other composites composite packagings
electronic waste vacuum bag
renovation
10.5 9.4 3.4
wood wood 1.6 13.9 0.9
hygiene products hygiene products 9 61.8 0.4
leather, rubber, cork leather, rubber, cork 0.5 6 5.9
Source: Warnecke, R.: Korrosionsdiagramm – Keine Abhängigkeit vom Chlor? Düsseldorf: 13. VDI-Konferenz – Feuerung und Kessel, Beläge und Korrosion in Großfeuerungsanlagen, 2014.
Waste Incineration
Heat flux and flue gas flow are also the driving forces for corrosion and evaluated with measurements with a probe, as well calculated with FEM [8]. Heat flux leads the material flow out of gaseous chlorine and salts to the place of highest heat flux.
The balance of corrosion drivers like chlorine content around the fouling layer and the local flue gas composition and fly ash is depending on many parameters and can change immediately.
The picture above (Figure 12) also shows the increase of chlorine concentration in the fouling layer around a tube [26].
The flue gas velocity and chlorine concentration gives a wider range of corrosion poten- tial like shown and implemented in the advanced corrosion diagram (Figure 13) [12, 25, 26]. This matter is mainly depending on the waste quality. Table 3 shows the weight range of chlorine content in different waste types and gives a picture of the difficulty to fix an individual influence to each plant. A general influence is pointed out in Figure 13.
2.2. Monitoring
Furthermore, a systematic optimisation of boiler parts by continued measurements, evaluations analysis can be the key to reduce maintenance costs caused by corrosion [22]. Predictive monitoring can help to reduce unplanned outages and shorten the revision time [19].
0 1 2 3 4 5 6
0 5.000 10.000 15.000 20.000 25.000 30.000 35.000
Wall thickness mm
Operating hours h
worst case - projection (availability)
Figure 14: Loss of wall thickness by continuous monitoring during life time (example of a existing plant)
Source: Spiegel, W.; Molitor, D.: Erfahrungen aus zwanzig Jahren Revisionsbegleitung. In: Thomé-Kozmiensky, K. J.; Beckmann, M. (Eds.): Energie aus Abfall, Band 14. Neuruppin: TK Verlag Karl Thomé-Kozmiensky, 2017, pp. 215-226.
Waste Incineration
Table 4: Monitoring and previous view of wall thickness and life time (example of an existing plant)
Compo-
nent Position and height
Zero wall
thickness Operating
time Minimum Corrosion Lifetime prognosis
mm h mm mm/
1,000 Bh h
Super- heater 3
AGin + 17m 5 40,000 4.2 0.02
•••
> 56,000AGout + 17m 5 40,000 4.2 0.02
•••
> 56,000AGin + 21m 5 40,000 3.2 0.05
•••
8,000AGout + 21m 5 40,000 3.7 0.03
•••
< 24,000Super- heater 2
AGin + 17m 5 40,000 4.2 0.02
•••
> 56,000AGout + 17m 5 40,000 4.3 0.02
•••
> 56,000AGin + 21m 5 40,000 2.8 0.06
•••
8,000AGout + 21m 5 40,000 2.5 0.06
•••
8,000Super- heater 1
AGin + 17m 5 80,000 4.3 < 0.01
•••
> 56,000AGout + 17m 5 80,000 4.5 < 0.01
•••
> 56,000AGin + 21m 5 80,000 4.1 0.01
•••
> 56,000AGout + 21m 5 80,000 4.4 < 0.01
•••
> 56,000•••
Replacement probably necessary at next revision}
According to current corrosion rates and a required wall thickness of 3 mm•••
Replacement probably necessary in 2-3 years•••
Replacement necessary after 4 or more yearsSource: Spiegel, W.; Molitor, D.: Erfahrungen aus zwanzig Jahren Revisionsbegleitung. In: Thomé-Kozmiensky, K. J.; Beckmann, M. (Eds.): Energie aus Abfall, Band 14. Neuruppin: TK Verlag Karl Thomé-Kozmiensky, 2017, pp. 215-226.
The results of the example in Table 4, gives a good overview for further maintenance planning according to the different super-heater bundles. As well the results show that mostly just a partly exchange is necessary.
2.3. Plant feedback
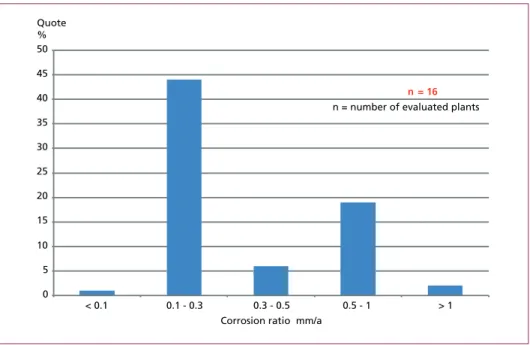
From operator side a lot of single steps are possible to reduce corrosion attack. To point out the needs a survey of 183 waste fired boilers listed in ITAD shows to the following results as a feedback of 16 plants [4] (Figure 15 and 16):
• Most boilers (44 %) have a corrosion rate between 0,1 to 0,3 mm per year in the eva- porator part. Approximately 20 % (3 plants) have much higher rates and a challenge to solve. Unfortunately no relation to steam parameter and material was possible.
• Most boilers (60 %) have a corrosion rate between 0,5 to >1,3mm per year in the super-heater part. Unfortunately, no relation to steam parameter and material was possible.
Nevertheless the above shown figures point out that the major focus with high corrosion ratios is in the area of super-heater and just a small number is related to the evaporator.
Waste Incineration Figure 15: Corrosion ratio in evaporator
Source: Born, M.; Beckmann, M.: Korrosionsschutzmaßnahmen in Abfallverbrennungsanlagen und Ersatzbrennstoff-Kraft- werken – Auswertung einer Betreiberbefragung. In: Thomé-Kozmiensky, K. J.; Beckmann, M. (Eds.): Energie aus Abfall, Band 9.
Neuruppin: TK Verlag Karl Thomé-Kozmiensky, 2012, pp. 393-412.
0 5 10 15 20 25 30 35 40 45 50
< 0.1 0.1 - 0.3 0.3 - 0.5
Corrosion ratio mm/a
0.5 - 1 > 1
Quote
%
n = number of evaluated plants n = 16
0 5 10 15 20 25 30 35
< 0.1 0.1 - 0.3 0.3 - 0.5 0.5 - 1.0 > 1.0
Quote
%
n = number of evaluated plants n = 16
Corrosion rate mm/a
Figure 16: Corrosion rates in super-heater
Source: Born, M.; Beckmann, M.: Korrosionsschutzmaßnahmen in Abfallverbrennungsanlagen und Ersatzbrennstoff-Kraft- werken – Auswertung einer Betreiberbefragung. In: Thomé-Kozmiensky, K. J.; Beckmann, M. (Eds.): Energie aus Abfall, Band 9.
Neuruppin: TK Verlag Karl Thomé-Kozmiensky, 2012, pp. 393-412.
Waste Incineration
3. Current status /design parameter of plants
Waste to energy plants are characterised by a limitation of the steam parameter caused by the high temperature corrosion. So the typical steam parameters are. 40 bar/400 °C [17]. But in deviation to this there are various other plants with different steam param- eters. The following part shows their operation experience.
3.1. Overview of plants in Germany
An overview of German waste to energy plants status 2005 is given in Figure 17:
0 10 20 30 40 50 60
< 40 bar
< 400 °C
40 bar 400 °C
> 40 bar
< 450 °C
> 40 bar
> 450 °C Ratio
% Steam parameters of the 183 waste to energy plants listed by ITAD
Figure 17: Steam parameter of 183 listed waste boilers at ITAD (2005)
Source: Born, M.; Beckmann, M.: Korrosionsschutzmaßnahmen in Abfallverbrennungsanlagen und Ersatzbrennstoff-Kraft- werken – Auswertung einer Betreiberbefragung. In: Thomé-Kozmiensky, K. J.; Beckmann, M. (Eds.): Energie aus Abfall, Band 9.
Neuruppin: TK Verlag Karl Thomé-Kozmiensky, 2012, pp. 393-412.
Site Temperature
°C
Pressure
bar Supplier Start-up year
Hameln (Germany) 450 49 SBE
(VKW) 1977 (K1)
1983 (K2)
Düsseldorf (Germany) 500 90
SBE (VKW) Lentjes: K4
1980 (K6) 1990 (K3 & 5) 1991 (K1 & 2) 1995 (K5) Oberhausen (Germany)
480
=> 460
=> 400 60 SBE
(DB)
1985 (K4) 1997 (K1 & 2)
Hempsted (USA) 443 60 SBE 1989
Table 5: Plants with high steam parameters until start up 2016
Waste Incineration
Power plant
Pressure levels
Steam tempera-
ture
Rated thermal
input waste
Rated thermal
input gas/oil
η el. net∑ η el. net waste commis-
sioning Comment
bar °C MW MW % % years
MHKW Mannheim
MK4 120 360 - 520 87 29 about
32 about
22 1997 external superheater with natural gas
directly MHKW
Mainz 40 400 - 540 88 671 57 20 2003 external superheater
with gas and steam cycle AVI AZN-
Moerdijk 100 400 - 555 231 491 42 15 1997 external superheater
& reheater with gas and steam cycle Bilbao 100/
30 330 - 540/
540 71 152 42 20 2004 external superheater
& reheater with gas and steam cycle
Andernach 70 400 - 525 51.4 8.6 about
22 < 22 2008 external superheater with waste oil / gas
directly AVI Ams-
terdam 130/
40 440/
320 2 x 93.3 - > 30 > 30 2007 internal reheater
with live steam Rüdersdorf 90/
23.4 420/
420 110 29 29 2008 first pure waste
reheater in boiler with grate combustion Table 5: Plants with high steam parameters until start up 2016 – continuation
Site Temperature
°C
Pressure
bar Supplier Start-up year
Stuttgart, Münster (Germany)
525
=> 500
=> 490 66
SBE: K26 (DB) AE & E: K21 & 22
1994 (K26) 2006 (K21 & 22)
Rüdersdorf (Germany) 420 90 SBE 2008
Naples (Italy) 500
=> 470
90
=> 80 SBE 2009
Ruhleben (Germany) 465 63 SBE 2012
Frankfurt (Germany) 500 60 Lentjes 2006
Paris Ivry (France) 470 96 CNIM
(Martin) 1969
Milano (Italy) 440 52 Martin 2000
Amsterdam (Netherlands) 440
(=>400?) 130 NEM
(Martin) 2007
Brescia (Italy) 450 60 Ansaldo
(Martin) 1998 (L1 & 2) 2004 (L3) Wheelabrator
Falls PA (USA) 500 86 Volund 1994
West Palm Beach (USA) 443 63 Volund 2015
Amager Bakke
Copenhagen (Denmark) 440 70 Volund 2016
Table 6: Plants with multi stage super-heating
Source: Schu, R.; Leitner, R.: Mehrstufige Dampfüberhitzung-Effizienzsteigerung von EBS-, Biomasse- und Solarthermiekraft- werken. Berlin: Berliner Abfallwirtschafts- und Energiekonferenz, January 2008.
Waste Incineration
Like mentioned before not all steam parameters are free chosen. Some plants are con- nected to an existing steam system of a conventional power station.
Table 5 gives an overview of plants with high steam parameters until start up in 2016.
A number of plants are also out of this average range because the final super-heater are heated by external heat or other heating is used, like shown in table 6 [17].
3.2. Experience of plants with high steam parameters from literature
In various publications the experience with high steam parameters in waste to energy plants are described.
Mannheim [28]:
The original design for the steam main line was 120 bar/520 °C, according to the existing steam line of the plant. In the meantime the parameters where decreased to 80 bar/480 °C.
Due to the experience with boilers from different ages, the economical question is one of the drivers to run a plant with benefit. The comparison between the older plants and modern plants is shown in the following figure.
capital
capital staff +
administration staff +
administration electricity/fuel oil
electricity/
fuel oil operating and
residual material
operating and residual material maintenance
maintenance
energy energy
waste
waste advantage
0 10 20 30 40 50 60 70 80 90 100 110 120
cost sales cost sales
Modern waste to energy plant 400,000 t/a
Older waste to energy plant 550,000 t/a Incineration costs
%
critical waste price critical waste price
Figure 18: Comparison of old and new plants related to gate fee price
Source: Zickert, U.: Erfahrungen mit Abfallverbrennungsanlagen am Standort Friesenheimer Insel. In: Thomé-Kozmiensky, K.
J.; Beckmann, M. (Eds.): Energie aus Abfall, Band 6. Neuruppin: TK Verlag Karl Thomé-Kozmiensky, 2009, pp. 653-668.
Waste Incineration
It can be pointed out, that the year of building and the basis of experience have a main influence on the operating price per ton of waste. As well the optimisation and ho- mogenisation of the fuel quality and the combustion control has a positive influence to the corrosion potential.
But finally the lowering of the steam parameters lead to a significant reduction of corro- sion. Until this change evaporator heating surfaces with Inconel 625 in the combustion chamber reach a life time of less than 20,000 hours.
Further optimising have been realised like:
• modification of the grate,
• optimisation of refractory and protection layers,
• water blowers, and
• pitch of heat surface.
As result of this measures the availability is between 85 % and 88 %. Further steps relat- ed to grate and refractory are planned, combined with a pressure reduction to 65 bar.
The summery of this plant is, that with the higher steam parameter, the risk for high temperature corrosion and fouling increases disproportionately and if the effects are not manageable this leads to low availability and high costs – the plant is not efficient any more.
Plant between Germany and Netherlands [15]:
In the publication the design of the plant is described, it starts with a development of a concept for a steam outlet temperature of 460 °C/60 bar.
Boundary conditions Unit waste to energy
plant 1 waste to energy plant 2
steam parameters °C/bar 460/60 400/40
gross efficiency η of
the entire system % 30.9 28.7
thermal power Pth MWth 2 x 76 2 x 76
Parameter Unit
Execution at the presented
plant Common design flue gas velocity
in the first pass m/s < 4 4 to 4.5
flue gas temperature upstream final
superheater °C maximum 700 maximum 650
live steam
temperature °C 460 400
live steam pressure bar 60 40
Table 8:
Main design data in comparison with common design data
Source: Schmalz, S.; Taubitz, J.; Witzke, T.: Zwei Jahre Standzeit eines 460 °C Über- hitzers in einer thermischen Abfallver- wertungsanlage. In: Thomé-Kozmiensky, K. J.; Beckmann, M. (Eds.): Energie aus Abfall, Band 8. Neuruppin: TK Verlag Karl Thomé-Kozmiensky, 2011, pp. 265-284.
Table 7:
Boundary conditions for plant comparison
Source: Schmalz, S.; Taubitz, J.; Witzke, T.: Zwei Jahre Standzeit eines 460 °C Überhitzers in einer thermischen Abfallverwertungsanlage. In: Thomé-Kozmiensky, K. J.; Beckmann, M. (Eds.): Energie aus Abfall, Band 8. Neuruppin: TK Verlag Karl Thomé-Kozmiensky, 2011, pp. 265-284.
Waste Incineration
Table 9: Corrosion promoting mechanism in super-heater area
Boundary condition Mechanism Countermeasure Influence on boiler flue gas temperature
upstream superheater
with increasing flue gas temperature increases the risk of corrosion
lowest possible velocity in the first boiler pass
larger heating surface through low temperature difference required
ash cover on the superheater tubes
ash cover on the superhe- ater tubes increases the risk of corrosion (underlay corrosion)
• provide effective cleaning facilities
• arrange impact pro- tection upstream of the endangered tubes (svd)
none
flue gas velocity in the first pass
with increasing speed in the first pass, the particle discharge increases in the boiler
lowest possible speed in
the first boiler pass larger boiler dimensions
salinity in the ash cover alkaline, alkaline earth and heavy metal salts increase
the risk of corrosion optimize fuel processing none
steam temperature in superheater
rising steam temperatures require higher material temperatures
on the superheater tubes
• optimize superheater circuit (counter flow/
parallel flow)
• coating the tube surface with wear-resistant materials
• size of heating surface varies according to circuit
• operating temperature ofc oating materials to be noted
steam pressure in
superheater higher minimum tube wall thickness required none
Source: Schmalz, S.; Taubitz, J.; Witzke, T.: Zwei Jahre Standzeit eines 460 °C Überhitzers in einer thermischen Abfallverwer- tungsanlage. In: Thomé-Kozmiensky, K. J.; Beckmann, M. (Eds.): Energie aus Abfall, Band 8. Neuruppin: TK Verlag Karl Thomé- Kozmiensky, 2011, pp. 265-284.
The Tables 7 to 9 show, that the concept has foreseen to lower the velocity, which is a first step to lower the corrosion risk. Upstream the super-heater the maximum flue gas temperature is with 700 °C very high but related to a part load behaviour. The final super-heater is in parallel flow and created with a wide pitch of 240 mm. The mate- rial is 13CrMo4-5 and the first four rows are cladded. During the operating time of 16,000 hours no damage takes place so an operating time of minimum two years is approved.
Frankfurt [9, 16]:
The plant in Frankfurt was renewed between 2003 and 2009 and the steam parameters of 500 °C/60 bar were kept because of efficiency reasons. Due to the experience with the old plant and cladded tubes in counter flow, the super-heater of the updated plant was designed in parallel flow and cladded with Alloy 686 (Figure 19).
Experience with corrosion effects are described like follows:
In the first rows in a height between 50 to 150 cm from the top, the corrosion rate is the highest. Further on (downstream) in the bundle the higher corrosion rate is more in the lower part of the tubes. This shows a correlation to the flue gas flow. As well tubes which are not in flue gas stream are more corroded. The operator was able to find a relationship between super-heater circuit and heat flux related to corrosion potential.
Waste Incineration
883 °C 723 °C steam mixture
288 °C
256 °C
436°C 450 °C 394 °C
500°C 387°C 328°C 331°C
704 °C
683°C 600°C 524°C 435°C 372°C
353 °C
179 °C
255 °C
220 °C
Figure 19: Heat surface circuit
Source: Keune, R.; Herden, H.; Klotz, S.; Schmidl, W.: 500 °C Überhitzer des Müllheizkraft werks Frankfurt - Ist erhöhte Ko- rrosion beherrschbar? In: Th omé-Kozmiensky, K. J.; Beckmann, M. (Eds.): Energie aus Abfall, Band 11. Neuruppin: TK Verlag Karl Th omé-Kozmiensky, 2014, pp. 395-408.
0 0.05 0.10 0.15 0.20 0.25 0.30
Jul. 07 Jan. 08 Jul. 08 Jan. 09 Jul. 09 Jan. 10 Jul. 10 Jan. 11 Jul. 11 Jan. 12 Jul. 12 Jan. 13 Corrosion ratio
mm / 1,000 h
boiler 11 boiler 12
single tube exchange 11+12 single tube exchange 12 extension evaporator 11 extension evaporator 12
Figure 20: Average corrosion ratio during diff erent operation period
Source: Keune, R.; Herden, H.; Klotz, S.; Schmidl, W.: 500 °C Überhitzer des Müllheizkraft werks Frankfurt - Ist erhöhte Ko- rrosion beherrschbar? In: Th omé-Kozmiensky, K. J.; Beckmann, M. (Eds.): Energie aus Abfall, Band 11. Neuruppin: TK Verlag Karl Th omé-Kozmiensky, 2014, pp. 395-408.
Waste Incineration
Measurements during the outage shows corrosion rates in the cladded super-heater after 30,000 hours of operation in a range of 0,05 mm/1,000 h and 0,15 mm/1,000 h.
The corrosion ratio decreases during operating time like also shown in Figure 20. But some pipes have to be changed earlier, especially when they protrude into the flue gas stream. Corrosion rates up to 0,3 mm/1,000 hours are possible.
After two years of operation in average approximately 15 % of the super-heater 3 tubes must be changed in both boilers and the super-heater 4 (final super-heater) was changed complete. After three years of operation nearly the same rate and after four years in average 4 %. These results shows that like described in Chapter 2, exchange rate/corrosion rate can be partly quite high and mostly not the full bundle is affected.
Further modifications where done after four years of operation. Due to the high inlet temperatures upstream the final super-heater the evaporator bundle upstream was in- creased by an approximately three times higher amount of heating surface to decrease the temperature by 60 K.
This modifications lead to a lower temperature and to a better temperature distribution upstream the super-heater and lower corrosion ratio like shown in Figures 21 and 22.
640 660 680 700 720 740 760 780 800
0 2 4 6 8 10 12 14 16 18 20
Temperature flue gas
°C
Measuring position from left to right flue gas duct before conversion 16.07.2009 after conversion 26.10.2010
Figure 21: Measurement of flue gas upstream final super-heater
Source: Keune, R.; Herden, H.; Klotz, S.; Schmidl, W.: 500 °C Überhitzer des Müllheizkraftwerks Frankfurt - Ist erhöhte Kor- rosion beherrschbar? In: Thomé-Kozmiensky, K. J.; Beckmann, M. (Eds.): Energie aus Abfall, Band 11. Neuruppin: TK Verlag Karl Thomé-Kozmiensky, 2014, pp. 395-408.
The effect of the modification is shown in the following Figure.
Waste Incineration Figure 22: Development of corrosion ratio after modification and without extension
Source: Keune, R.; Herden, H.; Klotz, S.; Schmidl, W.: 500 °C Überhitzer des Müllheizkraftwerks Frankfurt - Ist erhöhte Ko- rrosion beherrschbar? In: Thomé-Kozmiensky, K. J.; Beckmann, M. (Eds.): Energie aus Abfall, Band 11. Neuruppin: TK Verlag Karl Thomé-Kozmiensky, 2014, pp. 395-408.
As well the positive effect of the modification is visualised in the comparison of line 11+12 (with modification) and line 13+14 (without modification).
Stuttgart [7]:
Another plant with high steam parameters and three lines is located in Stuttgart-Mün- ster. 500 °C/61 bar are the steam parameters for the coal fired lines, as well for the waste fired one. The super-heater 3 and 4 are located in the second pass and protected by refractory (Figure 23).
The part of maintenance cost for this heating surface is approximately 61 % of the total budget. This forces the pressure to create solutions to reduce the maintenance cost.
The approaches for solving the problems have been:
• reduction of corrosion potential by optimising of combustion and heat transfer in 1st pass,
• protection of the super-heater pipes by refractory systems,
• cladding of the super-heater pipes,
• development of nano-ceramic protection layers at high loaded areas, and
• change of material (13CrMo44) for the first three pipe rows together with protection shields from Sicromal 20/10.
The optimising in the first pass leads to a reduction of flue gas temperature of approx- imately 60 K.
0 0.05 0.10 0.15 0.20 0.25 0.30 0.35 0.40
Jul. 07 Jan. 08 Jul. 08 Jan. 09 Jul. 09 Jan. 10 Jul. 10 Jan. 11 Jul. 11 Jan. 12 Jul. 12 Jan. 13 mm/1,000 h
single tube exchange 11+12 single tube exchange 12
commissioning 13+14 extension EVAP 14
superheater 4 - exchange 13
superheater 4 - exchange 14 single pipe exchange 13
extension EVAP 12
extension EVAP 11
boiler 11 + 12 boiler 13 + 14 Corrosion rate
Waste Incineration
original equipment end of 1st year end of 2nd year end of 3rd year end of 4th year end of 5th year Cost
cladding black material
Figure 24: Cost comparison of cladding versus black material with refractory during operating time
Source: Geißl, O.; Schmidt, R.: Technische Konzepte zur Reduktion der Instandhaltungsaufwendungen für Endüberhitzer. In:
Thomé-Kozmiensky, K. J.; Beckmann, M. (Eds.): Energie aus Abfall, Band 11. Neuruppin: TK Verlag Karl Thomé-Kozmiensky, 2014, pp. 409-426.
250 300 350 400 450 500 550
300 350 400 450 500 550 600 650 700 750 800 850 900 950 1,000 1,050
External pipe wall temperature
°C
Flue gas temperature °C supporting pipe grid
superheater 1 superheater 2
superheater 4, refractory protected
superheater 4, bare strong corrosion transition area
low corrosion superheater 3,
refractory protected
superheater 3, bare
Figure 23: Corrosion diagram with position of super-heater
Source: Geißl, O.; Schmidt, R.: Technische Konzepte zur Reduktion der Instandhaltungsaufwendungen für Endüberhitzer. In:
Thomé-Kozmiensky, K. J.; Beckmann, M. (Eds.): Energie aus Abfall, Band 11. Neuruppin: TK Verlag Karl Thomé-Kozmiensky, 2014, pp. 409-426.