2 2
Vladimir Chekelian MPI for Physics, Germany
E-mail: shekeln@mail.desy.de
Inclusive charm and beauty production is studied in e + p collisions at HERA for values of the photon virtuality 12 ≤ Q 2 ≤ 650 GeV 2 and of the Bjorken scaling variable 0.0002 ≤ x ≤ 0.032.
The fractions of events containing charm and beauty quarks are determined using a method based on the impact parameter, in the transverse plane, of tracks to the primary vertex, as measured by the H1 vertex detector. The charm and beauty inclusive cross sections, the structure function F 2 c¯ c and, for the first time, the structure function F 2 b b ¯ are measured. The results are found to be compatible with the predictions of perturbative quantum chromodynamics and with previous measurements of F 2 c¯ c .
International Europhysics Conference on High Energy Physics July 21st - 27th 2005
Lisboa, Portugal
PoS(HEP2005)040
1. Introduction
Heavy quark production is an important process to study quantum chromodynamics (QCD). It is expected that perturbative QCD (pQCD) at next-to-leading order (NLO) gives a good description of heavy flavour production in deep-inelastic scattering (DIS), especially at values of the negative square of the four momentum of the exchanged boson Q 2 greater than the square of the heavy quark masses. Measurements of the open charm (c) cross section in DIS at HERA have mainly been performed in exclusive D or D ∗ meson production[1]. The measurement of the beauty (b) cross section is particularly challenging, since b events comprise only a small fraction (< 1% at Q 2 = 12 GeV 2 ) of the total cross section. The b cross section has been measured in DIS (Q 2 >
2 GeV 2 ) and in photoproduction (Q 2 ' 0 GeV 2 ) by H1[2] and ZEUS[3], using leptons from b decays.
In this report the results [4, 5] are presented on inclusive c and b cross sections in e + p scat- tering at HERA in the range 12 ≤ Q 2 ≤ 650 GeV 2 . Events containing heavy quarks can be dis- tinguished from light quark events by the long lifetimes of c and b flavoured hadrons, which lead to displacements of charged decay tracks from the primary vertex. The distance of a track to the primary vertex is reconstructed using the precise spatial information from the H1 vertex detector.
The charm structure function F 2 c c ¯ and the corresponding structure function for b quarks F 2 b b ¯ are obtained from the measured cross sections after small corrections for the longitudinal structure functions F L c c ¯ and F L b b ¯ .
2. Experimental Method
The analysis is based on low Q 2 [4] and high Q 2 [5] samples of e + p neutral current scattering events corresponding to an integrated luminosity of 57 . 4 pb − 1 , taken by H1 in the years 1999-2000 at an ep centre of mass energy √ s = 319 GeV with a proton beam energy of 920 GeV.
In order to determine a signed impact parameter (δ ) for a track, the azimuthal angle of the struck quark φ quark must be determined for each event. To do this, jets are reconstructed by the invariant k T algorithm in the laboratory frame using all reconstructed hadronic final state (HFS) particles. In the low (high) Q 2 analysis the p T of the jet was required to be above 2.5(5) GeV in the angular range 15 ◦ ( 10 ◦ ) < θ < 155 ◦ ( 170 ◦ ) . The angle φ quark is defined as the azimuth φ of the jet with the highest transverse momentum. If there is no jet reconstructed in the event, φ is reconstructed using the azimuth of the HFS four-vector in the high Q 2 analysis and π − φ elec , where φ elec is the azimuthal angle of the scattered electron, in the low Q 2 analysis, because the HFS is not always well reconstructed at low Q 2 . The direction defined in the transverse plane by φ quark and the primary vertex is called the quark axis.
If the angle between the quark axis and the line joining the primary vertex to the point of distance of closest approach is less than 90 ◦ , δ is defined as positive, and is defined as negative otherwise. Tracks with azimuthal angle outside ± 90 ◦ of φ quark are rejected. In addition in the high Q 2 analysis tracks are rejected if they lie outside a cone of size 1 in pseudo-rapidity–φ space centred about the jet axis. The δ distribution, shown in figure 1, is seen to be asymmetric with positive values in excess of negative values indicating the presence of long lived particles. It is well
PoS(HEP2005)040
/ cm
-0.2 -0.15 -0.1 -0.05 0 0.05 0.1 0.15δ
0.2Tracks
102
103
104
105
106 H1 Data
Total MC uds c b
/ cm
-0.2 -0.15 -0.1 -0.05 0 0.05 0.1 0.15δ
0.2Tracks
102
103
104
105
106
Figure 1: The distribution of the signed impact parameter δ of tracks with respect to the primary vertex in the x–y plane. Included in the figure is the expectation from the Monte Carlo simulation for light, c and b quarks. The contributions from the various quark flavours are shown after applying the scale factors obtained from the fit to the subtracted significance distributions of the data (see text).
described by the Monte Carlo simulation. Tracks with |δ | > 0.1 cm are rejected from the analysis to suppress light quark events containing long lived strange particles.
In order to optimise the separation of the quark flavours, use is made of the quantities S 1 , S 2
and S 3 defined as the significance (δ / σ ( δ )) of the track with the highest, second highest and third highest absolute significance, respectively, where σ ( δ ) is the error on δ . The events contributing to the S 2 distribution also contribute to the S 1 distribution. Similarly, those contributing to the S 3
distribution also contribute to the S 2 and S 1 distributions. Events in which S 1 and S 2 have opposite signs are excluded from the S 2 distribution. Events in which S 1 , S 2 and S 3 do not all have the same sign are excluded from the S 3 distribution. In the high Q 2 analysis only S 1 and S 2 are used and the S 1 distribution only contains events with one track linked to the jet.
In order to substantially reduce the uncertainty due to the resolution of δ and the light quark normalisation, the negative bins in the S 1 , S 2 and S 3 distributions are subtracted from the positive ones. The fractions of c, b and light quarks of the data are extracted in each x–Q 2 interval by fitting simultaneously the subtracted S 1 , S 2 and S 3 distributions and the total number of inclusive events before any track selection. The c, b and uds Monte Carlo simulation samples are used as templates.
The Monte Carlo c, b and uds contributions in each x–Q 2 interval are scaled by factors P c , P b and P l , respectively, to give the best fit to the observed subtracted S 1 , S 2 , S 3 and total distributions. Only the statistical errors of the data and Monte Carlo simulation are considered in the fit. The fit to the subtracted significance distributions mainly constrains P c and P b , whereas the overall normalisation constrains P l .
The results of the fit in each x–Q 2 interval are converted to a measurement of the ‘reduced c cross section’ defined from the differential cross section as
σ ˜ c c ¯ (x, Q 2 ) = d 2 σ c c ¯ dx dQ 2
xQ 4
2πα 2 (1 + (1 − y) 2 ) , (2.1)
using:
σ ˜ c c ¯ ( x , Q 2 ) = σ ˜ ( x , Q 2 ) P c N c MCgen
P c N c MCgen + P b N b MCgen + P l N l MCgen δ BCC , (2.2)
PoS(HEP2005)040
10-2 10-1 1 10 102
1 10 102 103
x=0.0002 i=5
x=0.0005 i=4
x=0.002 i=3
x=0.005 i=2
x=0.013 i=1
x=0.032 i=0 H1 Data
H1 Data (High Q2) H1 D✽ ZEUS D✽ MRST04 MRST NNLO CTEQ6HQ
Q2 /GeV2 F2cc_ × 4i
10-3 10-2 10-1 1 10 102
10 102 103
x=0.0002 i=5
x=0.0005 i=4
x=0.002 i=3
x=0.005 i=2
x=0.013 i=1
x=0.032 i=0
Q2 /GeV2 F2bb_ × 8i
H1 Data H1 Data (High Q2) MRST04 MRST NNLO CTEQ6HQ
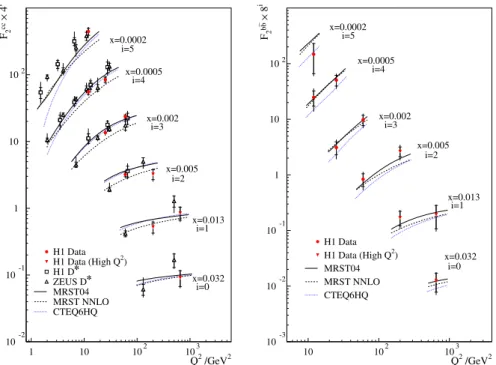
Figure 2: The measured F 2 c¯ c and F 2 b ¯ b , shown as a function of Q 2 for various x values. The inner error bars show the statistical error, the outer error bars represent the statistical and systematic errors added in quadrature. The QCD predictions are also shown.
where ˜ σ (x, Q 2 ) is the measured inclusive reduced cross section from H1[6, 7] and N c MCgen , N b MCgen and N l MCgen are the number of c, b and light quark events generated from the Monte Carlo in each bin. A bin centre correction δ BCC is applied using a NLO QCD expectation for ˜ σ c c ¯ to convert the bin averaged measurement into a measurement at a given x–Q 2 point. A small correction ( ≤ 2.6%) for the beam energy difference in the low Q 2 analysis is applied, using the NLO QCD expectation, to the measurement of ˜ σ(x, Q 2 ) which was performed at a lower centre of mass energy of 301 GeV than the data presented here. The cross section is defined such, to include a correction for pure QED radiative effects. Events that contain c hadrons via the decay of b hadrons are not included in the definition of the c cross section. The differential b cross section is evaluated in the same manner.
The structure function F 2 c c ¯ is evaluated from the reduced cross section σ ˜ c¯ c = F 2 c c ¯ − y 2
1 + (1 − y) 2 F L c c ¯ , (2.3)
where the longitudinal structure function F L c c ¯ is estimated from the same NLO QCD expectation as used for the bin centre correction. The structure function F 2 b b ¯ is evaluated in the same manner.
3. Results
The measurements of F 2 c c ¯ and F 2 b b ¯ are shown as a function of Q 2 in figure 2. The measurements
PoS(HEP2005)040
0 0.2 0.4
10-5 10-3 10-1
F
2cc–/ F
2HERA F
2cc–/F
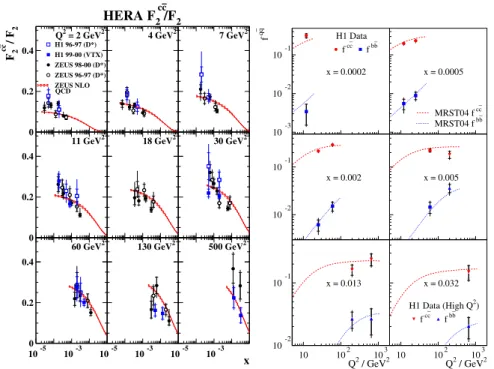
2Q2 = 2 GeV2
H1 96-97 (D*) H1 99-00 (VTX) ZEUS 98-00 (D*) ZEUS 96-97 (D*) ZEUS NLO QCD
0 0.2 0.4
10-5 10-3 10-1 4 GeV2
0 0.2 0.4
10-5 10-3 10-1 7 GeV2
0 0.2 0.4
10-5 10-3 10-1 11 GeV2
0 0.2 0.4
10-5 10-3 10-1 18 GeV2
0 0.2 0.4
10-5 10-3 10-1 30 GeV2
0 0.2 0.4
10-5 10-3 60 GeV2
0 0.2 0.4
10-5 10-3 130 GeV2
0 0.2 0.4
10-5 10-3 500 GeV2
x
10-3 10-2 10-110 102 103
x = 0.0002
f qq_
H1 Data f cc
_
f bb
_
10-3 10-2 10-1
10 102 103
x = 0.0005
MRST04 f cc_ MRST04 f bb
_
10-2 10-1
x = 0.002
10-2 10-1
x = 0.005
10-2 10-1
10 102 103
x = 0.013
Q2 / GeV2 10-2
10-1
10 102 103
x = 0.032
Q2 / GeV2 H1 Data (High Q2)
f cc
_
f bb
_