Policy Research Working Paper 6512
Increase in Protectionism and Its Impact on Sri Lanka’s Performance in Global Markets
Bartlomiej Kaminski Francis Ng
The World Bank
Development Research Group
Trade and International Integration Team June 2013
Public Disclosure AuthorizedPublic Disclosure AuthorizedPublic Disclosure AuthorizedPublic Disclosure Authorized
Produced by the Research Support Team
Abstract
The Policy Research Working Paper Series disseminates the findings of work in progress to encourage the exchange of ideas about development issues. An objective of the series is to get the findings out quickly, even if the presentations are less than fully polished. The papers carry the names of the authors and should be cited accordingly. The findings, interpretations, and conclusions expressed in this paper are entirely those of the authors. They do not necessarily represent the views of the International Bank for Reconstruction and Development/World Bank and its affiliated organizations, or those of the Executive Directors of the World Bank or the governments they represent.
Sri Lanka’s external performance defies global trends on two counts. First, the level of openness as measured by the ratio of trade in goods and services, after a strong increase in 1987–95 and stagnation in 1996- 2004, sharply fell in 2005–10 to the levels experienced during the era of import substitution. Second, the share of clothing in manufactured exports has remained largely unchanged over the past 25 years. Had there been no economic growth, this would not have been puzzling. The paper argues that these unique features can be traced to (a) the duality of Sri Lanka’s economic regime—the legacy of unfinished structural reforms of a socialist economic regime—and (b) high and growing protectionism in the 2000s. Sri Lanka’s experience
This paper is a product of the Trade and International Integration Team, Development Research Group. It is part of a larger effort by the World Bank to provide open access to its research and make a contribution to development policy discussions around the world. Policy Research Working Papers are also posted on the Web at http://econ.worldbank.org.
The authors may be contacted at fng@worldbank.org.
shows that the lack of stability in trade policy combined with recently expanding protectionism and the state’s micromanagement of investment does not create an institutional/policy setting conducive to rapidly evolving composition of exports and their fast growth. The practice of dealing with weaknesses in trade policies and the business environment through granting exemptions to various activities deemed desirable by the authorities only exacerbates distortions and creates more fertile ground for rent seeking. Without a radical overhaul of the current policy framework shaping interaction of Sri Lankan businesses with global markets, economic growth may be reduced, if not reversed.
Performance in Global Markets
by
Bartlomiej Kaminski×x/and Francis Ngxxx/
Keywords: Sri Lanka’s trade policy, foreign trade performance, trade liberalization and reform, import substitution, protectionism, business environment, economic growth, global markets JEL Classification: F10, F13, F14, F15, F18, F43
Sector Board: PREM
× This is an abridged and substantially revised version of a larger study on Revival of Inward-Orientation and its Impact on Sri Lanka’s Performance in Global Markets forthcoming in WSiZ Working Papers series, Rzeszow, Poland.
The authors wish to thank Francis Rowe for his very useful contributions to earlier drafts of this paper. We are also grateful to an anonymous referee for excellent suggestions on how to improve the argument developed in this study. The findings, interpretations, and conclusions expressed in this paper are entirely those of the authors. They do not necessarily reflect the views of the World Bank, its Executive Director, or the countries it represents.
x× University of Maryland, College Park and University of Information Technology and Management, Rzeszow, Poland, email: bkaminski71@gmail.com
xxx Trade and International Integration (DECTI) of Development Research Group, The World Bank, Washington D.C.
email: fng@worldbank.org
Contents
Introduction ... 3
1. Sri Lanka external performance in comparative perspective: in defiance of global trends ... 5
1.1. Dynamics: persistence of deficits in trade in goods and services ... 6
1.2. Shifts in direction of trade: from ‘North’ to ‘South/East’ but only on the imports side ... 9
1.3. In defiance of global trends: the puzzle of falling openness ... 10
1.4. In defiance of global trends: continued dominance of exports of garments ... 12
1.5. Textiles & Clothing (T&C) network: spectacular success story... 13
Concluding observation ... 17
2. Back to Protectionism: déjà vu all over again ... 17
2.1. Two-tiered tariff schedule: MFN tariff and para-tariff schedule ... 19
2.1.1. MFN tariff schedule: potential for distortions ... 20
2.1.2. Para- tariffs: high rates, large dispersion and further distortions ... 24
2.1.3. Total nominal protection: dramatic growth in 2004-09 ... 26
2.2. Border charges on exports: a revived leftover from the managed trade era? ... 27
2.3. Administrative ease of foreign trading: policy-induced versus logistics-related barriers ... 28
Conclusions ... 29
3. Exemptions from domestic regulations and their implications ... 31
3.1. Neutralizing anti-export bias of a foreign trade regime ... 32
3.2. EPZs: import-substitution approach to granting ‘exits’ ... 33
3.3. Implications ... 36
Policy Implications: in lieu of conclusions ... 38
References: ... 40
"Little else is requisite to carry a state to the highest degree of opulence from the lowest barbarism but peace, easy taxes, and a tolerable administration of justice: all the rest being brought about by the natural course of things." — Adam Smith, Lecture 1775
Introduction
The links between growth performance and institutions and policies are ambiguous depending on many intervening variables that change with the level of economic development, endowments in factors of production, geographical location, demography, etc. Policies and institutions adequate for one stage may fail in another one. Examples abound. Import substitution strategy laid the foundation for industrialization of Brazil but at some point led the economy to collapse under the weight of accumulated inefficiencies (Krueger 1992). Some ‘miraculous’ East Asian countries (e.g., Japan South Korea; Taiwan, China) caught up with highly developed economies while keeping multinational corporations and FDI at bay while others (e.g., Malaysia, Thailand) actively chased foreign investors.
Governments in countries at a technological frontier know little about the course that R&D will take and the results it will produce, whereas those from countries at a lower level can catch up pursuing the road taken by those at the top.
Sri Lanka has defied global and regional trends in both policies and performance. In policies, it began to dismantle import-substitution institutions and policies more than a decade earlier than it happened in most other developing countries. Like so many other developing countries, Sri Lanka followed a state- led import-substitution development strategy in the 1960s and most of the 1970s. Central to the strategy was an assumption that replacing imports would reduce dependence on imports and set the stage for self-sustained growth. Sri Lanka, however, went much further in expanding the role of the state than neighboring India: by the mid-1970s it became “… one of the most inward-oriented and regulated economies outside the communist bloc, characterized by stringent trade and exchange controls and pervasive state interventions in all areas of economic activity” (Athukorala and Jayasuriya, 2004, p. 3). But with the reform package launched in 1977, Sri Lanka was a pioneer in South Asia in dismantling industrial licensing, the Soviet-style planning system, and encouraging export orientation.
Historically, Sri Lanka went through three distinct policy changes: two waves of liberalizing reforms in 1977-79 and 1990-92; and protectionist reversal in the 2000s. The late 1970s witnessed dismantling of a
‘socialist mode of production,’1 but its dismantling in Sri Lanka has never been complete and despite privatization and other liberal reforms during the second wave of reforms in the early 1990s, the state’s direct involvement in investment policies has remained heavy. So has it in managing imports. In stark contrast with the promise implicit in the first two waves of reforms, Sri Lanka has taken a protectionist path in its foreign trade policies since 2001. The government has increased its involvement in micromanaging the economy. In fact, the 2000s witnessed increased protectionism and the return of more activist forms of import substitution:2 the government’s heavy involvement in public investment
1 An extensive network of welfare expenditures and consumer subsidies was paid for with trade tax revenues. In 1977, export taxes and import tariffs made up close to 50 percent of government revenues. Post-1977 reforms were aimed at liberalizing the foreign trade regime and since then Sri Lanka had long been hailed as the first country in South Asia to significantly open its borders to trade and foreign direct investment.
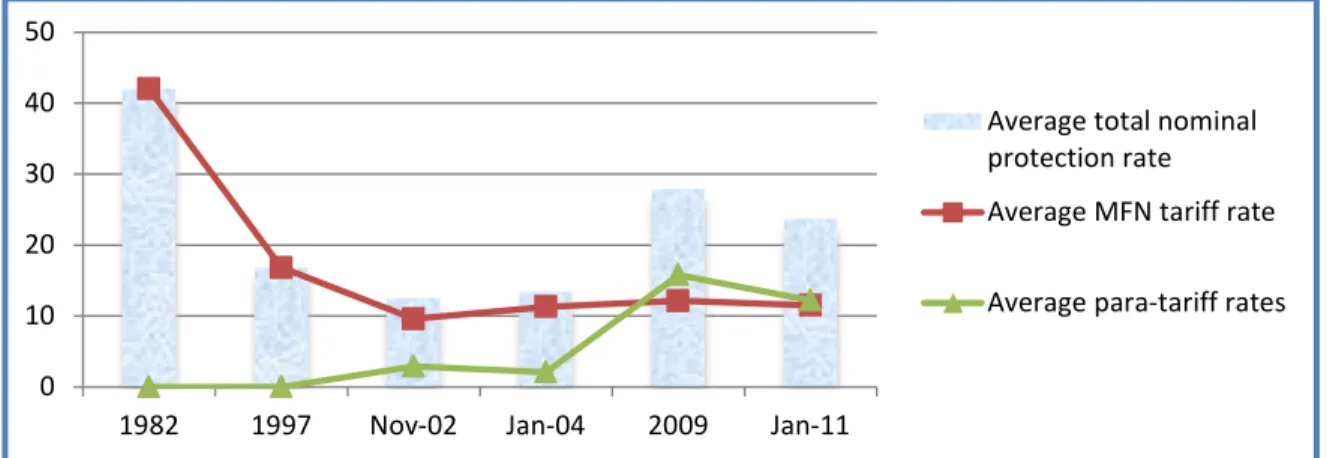
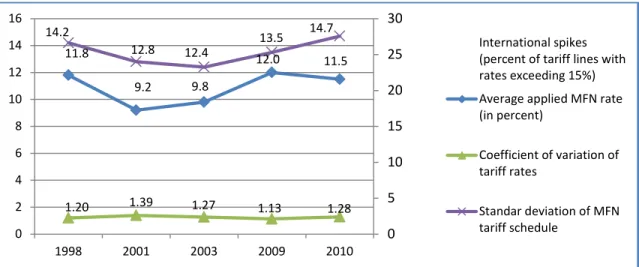
2 The average total nominal protection rate fell from 45 percent ad valorem to 10 percent in 2000-02 and increased to above 20 percent in 2008-10 (see Figure 1). In 2002, the government introduced a number of taxes levied only on imports and thus having the same effect as tariffs. This has led to extremely high levels of nominal protection completely erasing liberalization of foreign trade regime implemented in 1977-79. The average nominal protection was above 20 percent: but the average does not give accurate information as rates are highly dispersed.
programs resulted in macroeconomic disequilibria.3 This return to inward-oriented policies further increased the existing cleavage in the business climate between EPZs and the rest of the economy.
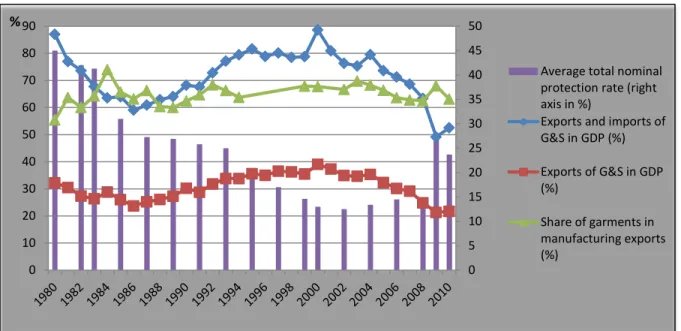
The combination of heavy state involvement in micromanaging foreign trade and investment through SEZ seems to have contributed to two unusual traits of Sri Lanka’s external performance (Figure 1). First, instead of an increase in their economic significance, exports and imports of goods and services relative to the GDP—the measure of economic openness—fell from around 80 percent in 1995-2004 to less than 30 percent in 2010. Second, the share of garments in manufacturing exports remained unchanged at between 60-70 percent over the period of 30 years.
Figure 1: Peculiarities of Sri Lanka’s external performance in 1987-2010: nominal protection, openness and the share of clothing in manufactured exports (in percent)
Left axis: trade in percent of GDP and share of garments in manufactured exports. Right axis: average total nominal protection rate in percent.
Sources: World Bank WDI database, UN COMTRADE database, and Pursell and Ahsan (2011).
These two unusual traits of Sri Lanka’s external performance—the declining tendency of economic openness and the persistently high share of clothing in Sri Lanka’s exports of manufactured goods—set the country apart from other developing countries. As for the openness, although statistics for many countries show contractions of foreign trade in terms of GDP, Sri Lanka stands out in two respects: the contraction spread over a long period of time; and the level of openness is close to levels attained during the import-substitution era almost forty years ago.
There is, however, another possible explanation for the falling openness—the increase in remittances.
The value of remittances in 2001-2010 grew at an average rate of 16 percent and was 3.7 times larger in
3 The last bout of inflation peaked in 2008. Sri Lanka has restored macroeconomic stability or “sound money;” one of—to borrow an apt phrase from Krugman (1995, 29)—the dual “Victorian virtues” in economic policy with another being adherence to free markets. It suffered from serious macroeconomic instability in 2007-08 with government running huge budget deficits and lax monetary policy producing inflation peaking at 23 percent in 2008. Double-digit inflation rates usually spell trouble as they suppress private investment because of fears of tax increases. But as a result of deep cuts in the budget deficit made in part possible thanks to financing obtained from the IMF under the Stand-by-Arrangement, inflation rate fell dramatically to 3.5 percent in 2009 and slightly edged up to 6.4 percent in 2010. In consequence, Sri Lanka has become ‘virtuous’ again at least on this count.
0 5 10 15 20 25 30 35 40 45 50
0 10 20 30 40 50 60 70 80
% 90
Average total nominal protection rate (right axis in %)
Exports and imports of G&S in GDP (%) Exports of G&S in GDP (%)
Share of garments in manufacturing exports (%)
2010 than in 2000. The growth was not only spectacular but the amounts involved were huge: on average they amounted to around 6 percent of the GDP in this period. Remittances potentially have two effects upon exports: (a) they contribute to pressures towards the appreciation of the domestic currency; and (b) lower incentives to export. On the one hand, the appreciation may undercut competiveness of some exports and boost imports, and, on the other hand, extra domestic demand may discourage exports: faced with expanding domestic demand firms do not have sufficiently strong incentives to look for markets abroad. The latter often requires significant investments necessary to gain contracts abroad and establish commercial presence in foreign markets. Hence, they both erode propensity to export and with huge levels of protection the appreciation of domestic currency may be not sufficient to make imports more attractive than domestically produced products. In addition, the civil war in 1983-2009 also reduced chances of attracting significant FDI inflows. These played a critical role in economic modernization of third tier East Asian high performers (Indonesia, Malaysia, and Thailand) and their export performance.
But neither remittances nor FDI provide any clues as to why Sri Lanka’s manufacturing exports offer has remained relatively unchanged over the last three decades or so. Among developing countries that have succeeded in expanding their GDP per capita, a typical pattern was that of a fast increase of the share of clothing in manufacturing exports followed by a period of its contraction. The share of clothing in Sri Lankan manufacturing exports peaked at 75 percent in 1984 but it still stood at 63 percent in 2010. In addition, there was little progress in diversification and sophistication of manufactured exports. Leaving aside impressive capabilities of firms of this sector to withstand global competitive pressures, domestic barriers to entry into exports may provide an explanation: A firm can take advantage of a business- friendly climate in EPZs only if it secures an export contract. Obtaining a contract usually represents a significant investment. With a fast expansion of domestic demand for products subject to high levels of protection, the option to export might not have been very appealing. Furthermore, it is an indication of limited reliance of on markets to allocate resources.
Sri Lanka has a number of advantages that can be easily tapped. First, there is geographic location. This is an island—not a landlocked country surrounded by bad neighbors. It is conveniently located close to growth poles of the emerging global economy in the 21st century. Second, it is endowed with relatively well developed human capital including entrepreneurial skills. Taking these into account, Sri Lanka has the potential to become part of global manufacturing chains as well as an export platform servicing, for instance, the South Indian economy. But without a complete overhaul of the foreign trade regime and significant changes in the regulatory domestic regime including investment policy, Sri Lanka is unlikely to boost economic growth. The rise of India, China and the rest of East Asia as a source of competition offer new opportunities: the challenge for the government is to institute policies that would unleash the country’s untapped potential.
The reminder of this paper is organized as follows. The first section examines Sri Lanka’s foreign trade performance. The second section analyzes change in the level of protectionism over the last two decades. Section 3 discusses the ways that government policies seek to minimize negative the impact of the duality in Sri Lanka’s economic regime: business-friendly for exporters and business-hostile towards firms producing for domestic markets. Section 4 concludes and sketches policy implications.
1. Sri Lanka’s external performance in comparative perspective: In defiance of global trends
Sri Lanka’s profile of economic development over the last four decades or so is unique in many respects, but one aspect stands out. In contrast to successful economies, its economic growth has not been driven by expanding exports and shifting towards more processed goods. To the contrary, it has been driven by
domestic demand fueled by government spending and made possible by labor remittances. More importantly, the 2000s witnessed significant decline in the share of exports of goods and services in the GDP. If an income from either investment abroad or remittances from labor employed abroad allows for financing import demand, there may be nothing wrong with it. But the problem is that foreign trade as a share of the GDP fell as well and Sri Lanka’s economy continues its involvement in world trade mainly in inter-industry type of trade.
1.1. Dynamics: Persistence of deficits in trade in goods and services
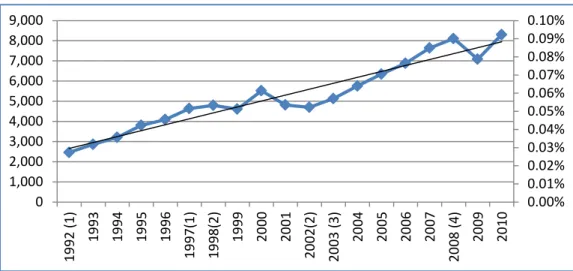
We distinguish four broad phases in exports and imports of goods and services over the period of the last two decades (see Figure 2):
1. The 1992-97 expansion: over the past two decades, this phase witnessed the most explosive growth in Sri Lanka’s exports over the last two decades. This was also the only phase characterized by faster growth in exports of goods than of their imports. The value of exports/imports increased at an average growth rate of 15 percent/12 percent reaching double-digit growth rate every year except in 1996 when exports’ growth rate fell to 8 percent and imports to 2 percent. Imports recorded a single-digit growth rate in 1997. The value of exports in 1997 was 95 percent above its level in 1992 and that of imports of 67 percent. Sri Lanka’s performance was above the average growth in total world exports with its share in these exports increasing 43 percent or from 0.06 percent in 1992 to 0.08 percent in 1997. The expansion phase coincided with a brief period of liberal reforms in the early 1990s (for their discussion, see Athukorala and Jayasuriya 2004).
2. The 1998-2002 stagnation: the average annual growth rate of Sri Lanka’s total exports fell to 0.8 percent and the value of exports in 2002 was 2 percent below its value in 1998. This phase was characterized by significant variation with exports surging 20 percent in 2000 and falling 13 percent next year. Similarly, the volatility in imports was also stark increasing by 22 percent in 2000 and falling 18 percent in 2001. This phase took place against the background of slow growth in the value of world exports: the average growth rate of world exports was 3 percent as compared to 2 percent for Sri Lanka. As a result, the share of Sri Lanka in world exports contracted from 0.09 percent in 1998 to 0.07 percent in 2002 or 27 percent.
3. The 2003-08 moderate rebound: this phase was characterized by a very strong growth of imports at annual average of 15 percent per year and exports grew at an average rate of 10 percent per year and in 2008 they were 58 percent above their level in 2003. However, in contrast to earlier phases, the rebound took place against booming global exports which grew at an average rate of 16 percent per year during this phase or six percentage points above the average growth rate of Sri Lanka’s exports. The share of Sri Lanka’s exports in global exports further retreated to its lowest level over the last two decades of 0.05 percent or 58 percent of its peak in 1998;
4. The 2009-10 global crisis and recovery: world exports fell 22 percent in terms of value in 2009 and increased by the same amount in 2010. The global economic crisis brought about the contraction of 13 percent in 2009 in Sri Lanka’s exports due to drop in import demand in USA and the EU.
However, exports strongly recovered. They grew 17 percent in 2010 and their value was even two percent above the pre-crisis 2008 level and the share in global exports was 8 percent higher than in 2008.
The dynamic of imports growth has been much more explosive than that of exports. The range in annual growth rates of imports of goods and services was between (-) 25 percent in 2009 and (+) 32 percent in 2010: the value of imports in 2010 was slightly below its 2008 level. In 2003-08 imports expanded much faster than exports; the contraction in imports in 2009 of 25 percent was much deeper and the rebound of 32 percent in the value of imports in 2010 much stronger.
Figure 2: Four phases of Sri Lanka’s exports growth and its share in world exports in 1992-2010 (exports in millions of US dollars and share in world exports in percent)
Note: Left axis: Exports in millions of US dollars; Right axis: Sri Lanka’s share in world exports in percent. In parentheses, the phase of exports performance: 1992-97; 1998-2002; 2003-2007; and 2008-10.
Source: for world exports WTO data from http://stat.wto.org/StatisticalProgram/WSDBViewData.aspx?Language=E accessed on September 5, 2011 and Sri Lanka’s exports as reported IMF’s balance of payments statistics.
The growing trade deficit of transportation services is driving overall commercial services trade deficit, but both are being driven by the goods deficit. In 2001-10, the average share of services in total exports was 20 percent with the highest value of 22 percent reached in 2001, 2003 and 2010, and the lowest of 19 percent in 2006-07. This shows that the dynamics of services exports lagged behind that of exports of goods except in 2010. The same is true for imports of services: their share in total imports was also 20 percent on average in 2001-10 with the highest values of shares in total imports of goods and services having been reached in the early 2000s and then slightly falling and strongly rebounding in 2010. Trade in services has been driven by transportation services accounting on average in 2001-08 for 60 percent of total imports of commercial services and 43 percent of their exports: even in 2010, the year of rebound after the global financial crisis. Their share in exports of commercial services increased from 46 percent in 2009 to 48 percent in 2010 and in imports from 62 percent to 66 percent, correspondingly.4 Changes in imports and exports of goods directly impact changes in trade in commercial services whose composition remained relatively stable in 1995-2010. The only significant change was the increase of the share of transportation services in both exports and imports of commercial services. On the export side, this share increased from an average of 42 percent in 1995-2003 to 46 percent in 2004-10 at the expense of two percentage point fall in the share of travel and 3 percentage point fall in the share of financial services: the share of computer and telecom services barely moved one percentage point to 25 percent. On the import side, except for computer services, whose average share declined from 19 percent to 15 percent, and financial services whose share remained unchanged at 15 percent, the
4 Own calculations based on data from the World Bank WDI database.
0.00%
0.01%
0.02%
0.03%
0.04%
0.05%
0.06%
0.07%
0.08%
0.09%
0.10%
0 1,000 2,000 3,000 4,000 5,000 6,000 7,000 8,000 9,000
1992 (1) 1993 1994 1995 1996 1997(1) 1998(2) 1999 2000 2001 2002(2) 2003 (3) 2004 2005 2006 2007 2008 (4) 2009 2010
direction of change was the same as in exports. But the expansion in import demand for transportation services was much stronger as an average share of 58 percent in 1995-2003 increased to 63 percent in 2004-10. Since the gap between imports and exports of these services has been traditionally the largest amongst other commercial services, this dynamic has contributed to worsening of enduring deficits in trade in commercial services.
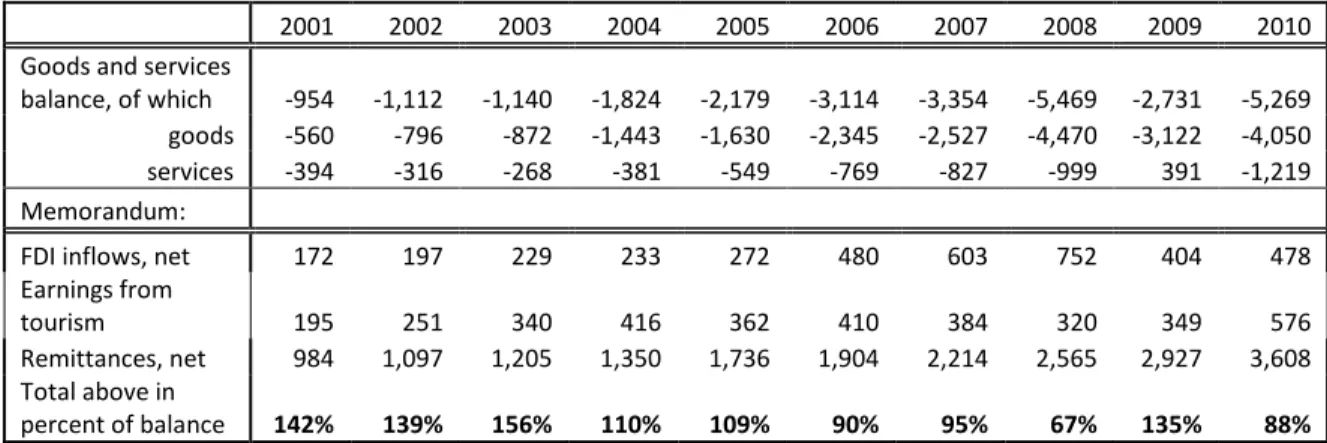
Sri Lanka has been running large deficits in its external trade in both goods and services. The exports coverage of imports of goods and services was never close to 90 percent in any year single over 1995- 2010 with the average ratio of 79 percent during this period. It reached the maximum value of 87 percent in 2001. Subsequently, the ratio fell to 65 percent in 2008. Since imports fell more than exports in 2009, the coverage increased to 77 percent only to fall back, according to preliminary estimates, to 66 percent in 2010 (see Figure 2 above). In terms of the GDP, the deficit ranged between 6 percent in 2002 and 13.5 percent in 2008. A much larger contraction in imports than in exports in 2009 brought the trade deficit down to 6.5 percent of the GDP in 2009. Deficits were consistently recorded in both goods and services balances, expect in 2009 when the services balance was positive due to cuts in imports (Table 1).
Table 1: Trade balance in goods and services, FDI inflows and workers’ remittances in 2001-10 (in millions of US dollars and percent)
2001 2002 2003 2004 2005 2006 2007 2008 2009 2010
Goods and services
balance, of which -954 -1,112 -1,140 -1,824 -2,179 -3,114 -3,354 -5,469 -2,731 -5,269 goods -560 -796 -872 -1,443 -1,630 -2,345 -2,527 -4,470 -3,122 -4,050 services -394 -316 -268 -381 -549 -769 -827 -999 391 -1,219
Memorandum:
FDI inflows, net 172 197 229 233 272 480 603 752 404 478
Earnings from
tourism 195 251 340 416 362 410 384 320 349 576
Remittances, net 984 1,097 1,205 1,350 1,736 1,904 2,214 2,565 2,927 3,608 Total above in
percent of balance 142% 139% 156% 110% 109% 90% 95% 67% 135% 88%
Sources: IMF BOP data and World Bank WDI database. Earnings from tourism as reported in Annual Statistical Reports of Sri Lanka’s Tourism published annually by the Sri Lanka Tourism Development Authority.
Foreign direct investment, foreign exchange earnings from tourism and workers’ remittances have played an important role in financing trade deficits, although their economic significance was different.
In terms of the balance of trade in goods and services, aggregate net inflows from these sources were larger than deficits except in 2006-08 with remittances towering over them. Depending on the year they were between around two (in 2002-04 and 2008-08) and four times (in 2010) larger than aggregate FDI inflows and foreign exchange revenues from tourism in 2001-10. In terms of the GDP, they averaged at 6.7 percent in 2001-10 reaching around 7 percent in 2009-10.
Both revenues from tourism and FDI inflows to Sri Lanka—very similar in terms of magnitudes—have been very small. Neither of them exceeded 2 percent of the GDP in 2001-10. In spite of the end of civil war in 2009, FDI inflows, in part because of their worldwide decline due to the global financial crisis in 2008-09, fell to 0.9 percent in both 2009 and 2010 from 1.9 percent of the GDP in 2008. Revenue from tourism increased in 2010 from 0.8 percent of the GDP in 2009 to 1.2 percent.
Although they are all sources of foreign exchange inflows and help finance deficits in international transactions, FDI stands apart from two other sources. FDI is not only a source of funding current account deficit but also an important conduit of technology diffusion critical to upgrading a country’s
export basket. Sri Lanka has not benefitted much from a dramatic expansion of capital flows over the last two decades.
Remittances and foreign exchange revenues from tourism are similar in their impact: both directly increase the purchasing power of the population. This may have two effects eroding propensity to export: (a) pressures towards the appreciation of the domestic currency; and (b) lower incentives to export. The appreciation may undercut competiveness of some exports and boost imports. Extra domestic demand may discourage exports: faced with expanding domestic demand firms do not have sufficiently strong incentives to look for markets abroad. The latter often requires significant investments necessary to gain contracts abroad and establish commercial presence in foreign markets.
1.2. Shifts in the direction of trade: From ‘North’ to ‘South/East’ but only on the imports side
Beginning around 2002, the geographical patterns of Sri Lanka’s foreign trade have undergone significant change. Its imports have shifted from highly developed “North” to developing countries or
‘South,’ mainly from suppliers in “South/East” Asia, i.e., India; Singapore; China and Hong Kong SAR, China; Malaysia; Taiwan, China; Pakistan; and Indonesia. The share of “South/East Asia” imports of Sri Lanka rose from 39 percent in 2001 to 56 percent in 2010. Exports, on the other hand, have continued to go to developed countries, although with some reshuffling as the EU has replaced the US as the major exports destination. The revival of exports in 2010, following a slump in 2009, was mainly driven by the surge of 27 percent in the value of “South/East”-bound exports, which may be a harbinger of a change in direction of exports. Overall, breaking up the trade deficit into geographical components shows that trade with “South/East” remained responsible for deficits in trade in goods, as trade with the “North”
has remained largely balanced.
The fall in the share of the “North” in total exports from around three-fourths in 2000 to 61 percent in 2010 was mainly due to the fall in exports to the US. The value of US-oriented exports contracted in 2001-10 at an annual LSG growth rate of (-) 0.6 percent. Strong export performance in EU markets at LSG rate of 10.5 percent was not sufficient to offset a 20 percentage point drop in the share of the US in total exports to 21 percent between 2001 and 2010. The share of the EU increased from 28 percent to 35 percent during this period. Moreover, the share of Japan fell by half to two percent in 2010.
As for “South/East” exports, India moved from being the 6th largest market in 2001 to the 3rd largest consumer of Sri Lankan products in 2010, after the US and EU. Yet, its share of 6 percent in 2010 remains relatively low considering proximity and Indo-Sri Lanka Trade Agreement according preferential access to Sri Lanka’s exporters.
Two emerging world trading powerhouses, India and China, recorded the largest gains in market shares in Sri Lanka: the share of India in total imports almost doubled whereas the share of China increased around 2.5 times with these two countries accounting for almost a third of Sri Lanka’s imports in 2010 up from 15 percent in 2001.
Geography and fast industrialization of these countries explain their preeminent position as major suppliers of Sri Lanka’s imports. These factors should also contribute to rapidly expanding Sri Lankan exports to these markets as their import demand has been growing at double-digit growth rates. It appears, however, that Sri Lankan businesses have failed to respond to opportunities offered by rapidly expanding import demand in South and East Asia including India. Sri Lanka’s share in total Indian imports of goods was growing each year in 2001-05 from 0.14 percent in 2001 to 0.4 percent in 2005 and started falling each year down to 0.13 percent in 2008. While the value of exports to India in 2009 was almost five times larger than in 2001, yet this was mainly the result of a surge of these exports in
2002 and 2003 from US$72 million in 2002 to US$171 million in 2002 and US$245 in 2003. In 2003-09 they grew at an annual LSG rate of 2.8 percent and peaked in 2005 at US$566 million. In 2009 they were at 59 percent of this peak value. Exports to other countries of the region were stagnant (China) or contracting (Singapore).
1.3. In defiance of global trends: The puzzle of falling openness
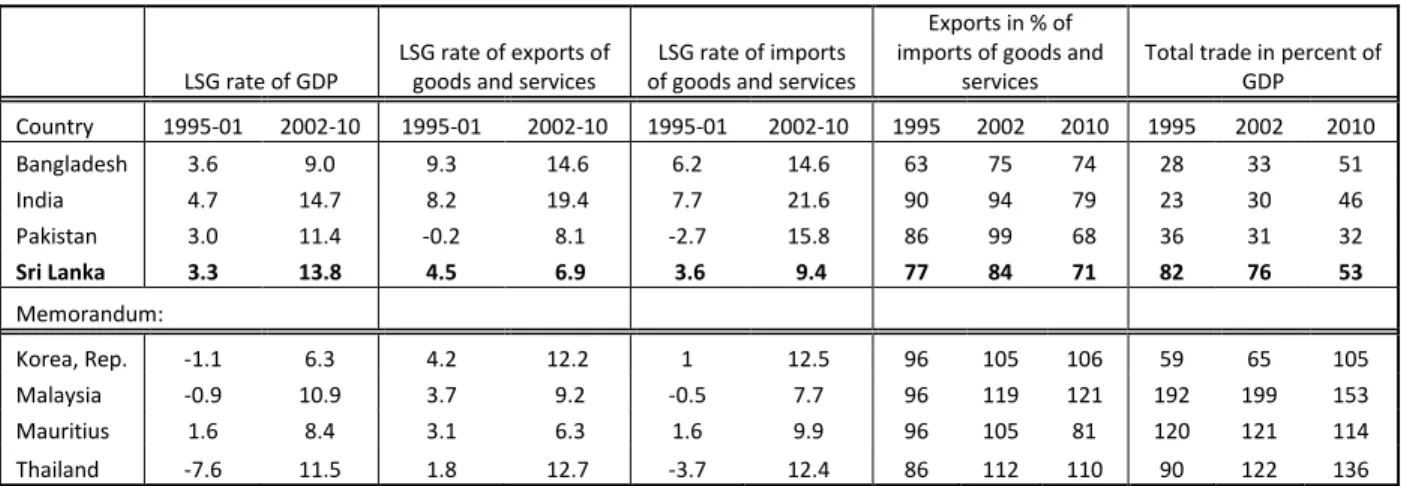
Cast against comparator countries, Sri Lanka’s foreign trade performance in the 2000s has been characterized by several idiosyncratic features: faster growth of GDP than of exports; lackluster exports growth by regional standards; declining level of openness as measured by total trade in GDP; and persistent foreign trade imbalances. These characteristics set Sri Lanka aside from other comparator countries on most counts. While most other comparator countries—except for Mauritius and to a lesser extent Malaysia—experienced export-led growth, domestic demand appears to have been the driver of Sri Lanka’s growth since 2002. LSG (least square growth) rate of Sri Lanka’s GDP in 2002-2010 was 6.9 percentage points higher than its exports LSG rate (Table 2).
Table 2: Aspects of external performance of Sri Lankan economy against selected other countries in 1995-2001 and 2002-10
LSG rate of GDP LSG rate of exports of
goods and services LSG rate of imports of goods and services
Exports in % of imports of goods and
services Total trade in percent of GDP Country 1995-01 2002-10 1995-01 2002-10 1995-01 2002-10 1995 2002 2010 1995 2002 2010
Bangladesh 3.6 9.0 9.3 14.6 6.2 14.6 63 75 74 28 33 51
India 4.7 14.7 8.2 19.4 7.7 21.6 90 94 79 23 30 46
Pakistan 3.0 11.4 -0.2 8.1 -2.7 15.8 86 99 68 36 31 32
Sri Lanka 3.3 13.8 4.5 6.9 3.6 9.4 77 84 71 82 76 53
Memorandum:
Korea, Rep. -1.1 6.3 4.2 12.2 1 12.5 96 105 106 59 65 105
Malaysia -0.9 10.9 3.7 9.2 -0.5 7.7 96 119 121 192 199 153
Mauritius 1.6 8.4 3.1 6.3 1.6 9.9 96 105 81 120 121 114
Thailand -7.6 11.5 1.8 12.7 -3.7 12.4 86 112 110 90 122 136
Sources: IMF BOP data and World Bank WDI database.
The shift from export-led growth to that driven by domestic demand took place in the 2000s. In 1995- 2001 Sri Lanka was a shining star among comparator countries lagging only behind Bangladesh and India, in terms of real GDP growth and export growth. Sri Lanka largely escaped the East Asian Crisis of 1997-1998, which deeply affected growth performance of the Republic of Korea, Malaysia, and Thailand, among others, during this period.5 But, after the 1997-98 crisis, export-led growth took East Asian economies back to the pre-crisis levels while export performance in Sri Lanka stagnated. However, strong real GDP growth meant its GDP in current US dollars was around three times larger in 2010 than in 2001 and was the second fastest growth performer in the group.
The fortunes reversed in 2002-10, albeit only in export performance in which Sri Lanka had the second worst record being slightly ahead of Mauritius by 0.6 percentage points. The deterioration in exports performance coincided with the reversal of liberal foreign trade policy that began in 2001 with the imposition of a Customs Surcharge of 40 percent levied on the value of calculated duties followed by the introduction of significant charges or para-tariffs with similar effect as duties (Pursell and Ahsan, 2011).
But it did not have impact on the GDP growth as Sri Lanka continued to be a strong performer in 2002-
5 For an examination of sources and their impact on external performance of these countries, see Cognato and Kaminski (2009).
10: in fact, Sri Lanka experienced the second, after India, fastest GDP growth among comparator countries: its GDP in current US dollars was around three times larger in 2010 than in 2001.
Hence, it comes as no surprise that openness of Sri Lankan economy fell in the 2002-10 period: its total foreign trade in percent of GDP declined from 82 percent in 1995 to 76 percent in 2002 and 53 percent in 2010 (Figure 4). Furthermore, relative to other countries, except for India and Bangladesh with respective populations many times larger than that of Sri Lanka, foreign trade in percent of the GDP has remained very low. The contraction in openness as measured by total trade in percent of GDP was not solely the result of the GDP growing faster than exports but also faster than imports. Exports of goods in terms of the GDP fell from 31 percent in 2000 to 18 percent in 2010, while imports fell from 34 percent to 24 percent during this period.
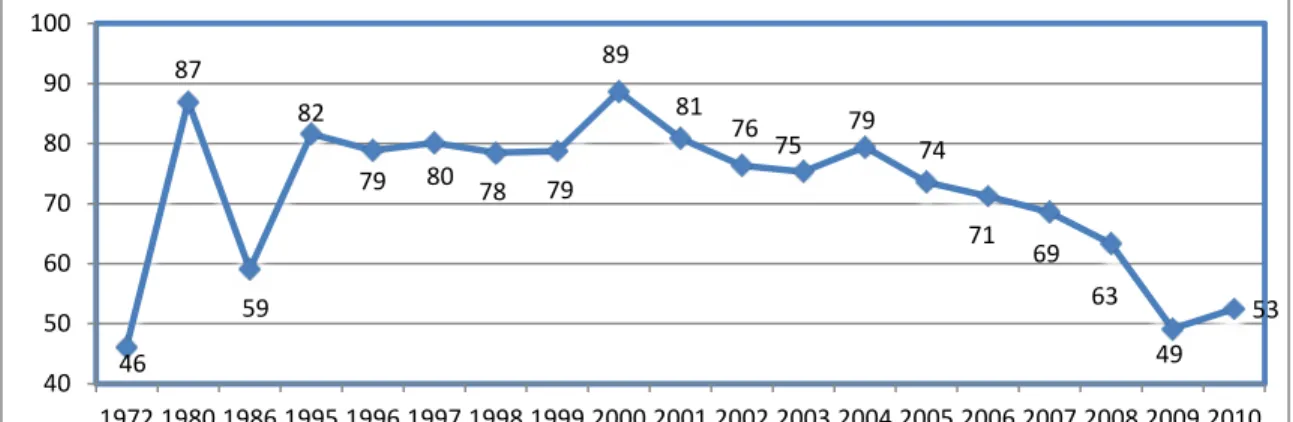
But the contraction in the level of openness as measured by total trade in goods and services in GDP between 2000 and 2009 was astounding although there was precedence of huge volatility in trade vis-à- vis GDP in Sri Lankan economic history (see Figure 3). Except for two periods in 1972-80 and 1986-95, domestic demand rather than foreign trade drove Sri Lanka’s GDP growth in 1972-2010. The level of openness in 2009 of 49 percent was barely 3 percent points above this level in 1972, which was the lowest over the whole period of 1970-2010. Furthermore, this was before the reforms in 1978, which marked the departure from import-substitution strategy. But between 1972 and 1980, foreign trade expanded faster than GDP except in 1976. The 1980-86 period witnessed the contraction in openness from 87 percent in 1980 to 59 percent followed by strong expansion over the next decade to 82 percent in 1995. In 1996-99 the growth of foreign trade moved in tandem with that of the GDP. A steep decline began in 2005. Although trade rebounded strongly in 2010, it remains to be seen whether this trend will continue.
Figure 3: Openness of Sri Lankan economy in selected years over 1972-2010 measured in terms of total trade in goods and services in percent of GDP
Source: derived from the World Bank WDI database.
The reasons for the falling openness of Sri Lankan economy, which defies trends observed across the majority of developing economies, cannot be fully explained without examining foreign trade and supply-side policies. Beyond policies and institutions, two factors may contribute to this phenomenon:
foreign currency revenue from tourism and remittances from labor working abroad. Remittances were huge amounting on average to around 7 percent in 2001-10 with an absolute deviation of 1.1 percentage points. Since they have been increasing at a similar pace as the GDP, they could not have been responsible for the fall in openness. Similarly, foreign currency earnings from tourism did not
46 87
59 82
79 80 78 79 89
81 76 75 79 74
71 69 63
49 53 40
50 60 70 80 90 100
1972 1980 1986 1995 1996 1997 1998 1999 2000 2001 2002 2003 2004 2005 2006 2007 2008 2009 2010
increase in terms of the GDP during this period. To the contrary, they even fell in 2008-09 to 0.8 percent of the GDP.6
Thus, one has to look for explanations in policies shaping investment climate as well as those affecting external interaction of businesses. While policies are addressed in Section 2 of this paper, we note below that Sri Lanka’s export basket has displayed rather remarkable stability over the last forty years with exports of garments growing at roughly the same rate as those of other manufactures and that the nature of Sri Lanka’s plugging into global markets for goods did not substantially change over the same period. Both suggest Sri Lanka’s exports basket having been frozen in time.
1.4. In defiance of global trends: Continued dominance of exports of garments
Ever since the First Industrial Revolution, developing production of garments was the first step towards industrialization. Garments towered over other products in England’s exports in the early 19th century.
They did so also more recently in exports of countries that graduated to the core of highly developed economies such as Japan or South Korea. But as countries move up the development ladder, their exports become more diversified with other manufactured exports expanding much faster. As a result, clothing as the share of manufactured exports would be falling. For instance, the share of exports of clothing in total exports of successful transition economies that joined the EU in 2004-07 peaked in 1993-2001 and then fell although exports continued but no longer limited to simple assembly of basic garments for exports (Javorcik and Kaminski 2006).
Although Sri Lanka’s exports of clothing in percent of manufactured exports peaked very early in 1984, their share in manufactured exports of 63 percent in 2010 has remained remarkably high. The peak came eight years before India and almost two decades earlier than in Pakistan and Bangladesh.
Interestingly, this also happened earlier than in more developed comparators—Malaysia, Mauritius, and Thailand (Table 3). Yet, Sri Lanka’s exports of other manufactured products relative to clothing grew relatively slower than those of other countries. The largest increase of other manufactured goods was for Korea, Thailand, and Malaysia: the share of clothing in 2010 in manufactured goods exports was respectively 2 percent, 12 percent, and 32 percent of their peak levels.
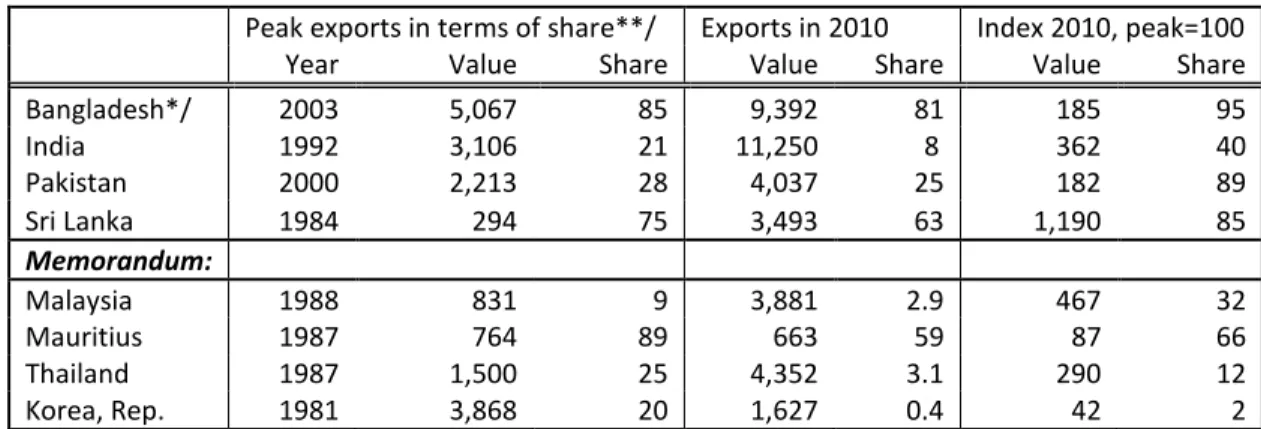
Table 3: Exports of clothing in terms of value and percent of manufactured exports in peak years over 1980-2010 and in 2010 (in millions of US dollars and percent)
Peak exports in terms of share**/ Exports in 2010 Index 2010, peak=100
Year Value Share Value Share Value Share
Bangladesh*/ 2003 5,067 85 9,392 81 185 95
India 1992 3,106 21 11,250 8 362 40
Pakistan 2000 2,213 28 4,037 25 182 89
Sri Lanka 1984 294 75 3,493 63 1,190 85
Memorandum:
Malaysia 1988 831 9 3,881 2.9 467 32
Mauritius 1987 764 89 663 59 87 66
Thailand 1987 1,500 25 4,352 3.1 290 12
Korea, Rep. 1981 3,868 20 1,627 0.4 42 2
Note: */the last year data available is 2007; **/ share of exports of clothing in total exports of manufactured goods.
Source: Own calculations based on data reported to the UN COMTRADE database.
6 Data on foreign currency revenue from tourism come from the website of the Sri Lanka Tourism Development Authority at http://www.sltda.lk/annual_statistical_reports, accessed on February 2 2012.
The share of clothing in Sri Lankan manufactured exports has not changed dramatically since 1975 but its share in exports of South Asia has significantly declined.7 Sri Lanka was in the 1980s a region’s powerhouse: its exports accounted for 20 percent of Indian subcontinent’s aggregate exports in 1984.
This share at 12 percent in 2007 is still impressive.8 Its share in Indian subcontinent’s garment’s exports was falling in 1985-89 from 20 percent to 12 percent.
From the vantage point of 1989, Sri Lanka’s profile looked very much like that of any other developing country moving quickly from unskilled labor-intensive activities to more capital- and skilled labor- intensive products. But this pattern was reversed in the 1990s: Sri Lankan producers of garments outperformed local competitors with their share shooting back to 19 percent in 1999 and other manufacturing sectors in Sri Lanka: their share rose from 60 percent in 1989 to 70 percent in 2002 and then began falling again to 63 percent in 2008 and 2010.
Hence, while other countries expanded exports of other manufactures much faster, Sri Lanka has not fared that well vis-à-vis countries that began transitioning from garments in either 1980s or 1990s.
Thailand’s performance has been particularly impressive. Until 1987, garments were one of the main levers of manufactured exports growth. Subsequently, the growth shifted to other manufactured goods with the share of garments falling from 25 percent in 1987 to 20 percent in 1991, 8 percent in 2001, and 3 percent in 2010. The scope of change as measured by the fall in the share of garments was also smaller than in India’s and other more developed comparators.
1.5. Textiles & Clothing (T&C) network: Spectacular success story
The clothing sector took off in 1977 following a bold liberalization of Sri Lanka’s economy and owed its initial expansion to quota-hopping, triggered by Multi-Fiber Arrangement (MFA) quotas, by East Asian exporters looking for countries with unfilled MFA quotas.9 Together with the government’s actions creating very favorable business climate to the apparel sector (Kelegama 2009), their entry provided an incentive to local entrepreneurs to start apparel manufacturing activities. Hence, Sri Lanka, like a number of other developing countries, could develop its own domestic capacities in large part thanks to protectionism imposed by the MFA but, above all, to the availability of local entrepreneurial talent released by liberal reforms.
The dismantling of MFA quotas-based arrangements on January 1, 2005 removed protectionist shield and fully exposed apparel producers to fierce competition from the most cost-efficient sources in the world raising concerns about the ability of Sri Lanka’s T&C network to survive in a new much more competitive post-MFA environment. The 2000s witnessed declining apparel prices due to overcapacity and China’s rapidly expanding exports. While a full assessment of recent developments in Sri Lanka’s T&C network is beyond the format of this section,10 the analysis below, based almost exclusively on foreign trade data, seeks to assess Sri Lanka’s response to new conditions in global markets. It corroborates many observations and conclusions derived from sectoral studies pointing to a significant functional upgrading of Sri Lanka’s T&C network over the last decade through moving to higher-value activities and developing specialized niches in specific product categories.
7 Sri Lanka’s exports of garments in percent of aggregate garments exports of Bangladesh, India, Pakistan, and Sri Lanka.
8 Since no data are available for Bangladesh in 2008-10, no estimate is available for more recent years.
9: In addition to East Asian producers who were the majority of foreign investors, European investors came as well attracted by rising production costs in their home countries and the liberal trade and investment regime. See Kelegama and Wijayasiri 2004, p. 158), quoted in Acevedo and Robertson (2011b).
10 For an in-depth study, see the chapter on Sri Lanka in edited volume by Acevedo and Robertson (2011b) and a paper by Kelegama (2009).
Sri Lankan T&C sector has demonstrated remarkable resilience in sustaining impressive exports despite the elimination of Multi-Fiber Arrangement (MFA) quotas under the WTO Agreement on Textile and Clothing on January 1, 2005 and a country’s rapid growth in GDP per capita implying also higher wages.11 As for the latter, note that since (a) barriers to entry into clothing manufacture are very low and, thereby, easily accessible to countries at a very low level of economic development, and (b) in contrast to capital-intensive and increasingly research and development-intensive production of fabrics, clothing industries are far more fragmented and unskilled labor intensive; various stages of clothing production tend to be subcontracted as a country moves up the development ladder. Because of high labor intensity, preserving the competitive edge becomes increasingly difficult as the labor costs continue to rise. Many highly developed countries continue producing clothing but in order to withstand competition they had to specialize in higher value added activities calling for increased capital intensity, significant R&D content, and involving outsourcing of some operation to lower wage economies.
While most quantitative assessments of consequences of elimination of MFA quotas predicted that formerly restricted countries, such as China and India, would gain the most from the removal of the quota, at the expense of other developing countries (Francois and Spinanger 2001),12 Sri Lanka’s firms not only survived fierce competition from formerly restricted suppliers but saw their exports growing in terms of value by 3 percent in 2005, 6 percent in 2006, 7 percent in 2007, and 5 percent in 2008. They fell 5 percent in 2009 but rebounded at 6 percent in 2010. Total exports of T&C network, with clothing accounting for around 85 percent of the total, grew at an impressive annual LSG rate of 6.1 percent over 2005-10 from around US$3 billion to US3.7 billion.
Sri Lanka’s T&C production and distribution network fully participates in international trading and generates substantial trade surpluses. T&C trade surplus, as percent of total imports into Sri Lanka was falling between 2001 and 2008, it increased from 14 percent in 2008 to 18 percent in 2009 and fell to 14 percent of the value of total imports in 2010. In other words, T&C surpluses covered between one fifth and one tenth of all imports. The surplus increased from US1 billion in 1999 to around US$1.8 billion in 2010 except in 2002 and 2010.13 The continued full-scale participation as well as persistence in generating surpluses demonstrates that Sri Lankan firms have been very successful in devising strategies necessary to withstand strong international competition.
Whatever these strategies might be, the international experience suggests that it usually entails moving to new market niches (Dicken 2007, p. 251). Indeed, upgrading and shifting to new market niches appear to have been at the heart of Sri Lanka’s adjustment. Viewed through the lenses of foreign trade statistics, two developments suggest significant maturing of Sri Lanka’s T&C network and its capacity to reposition itself into a higher value added segment of the industry. First, although slow, there has been a shift away from activities easily accessible to virtually any developing countries, i.e., cutting and sewing of clothing to those requiring capital and higher specialization. This shift can be captured by a significantly faster growth of exports of fabrics in 2005-10 and progress in developing backward linkages.
Textiles provide the major input to the clothing industry; they generate vertical linkages between the
11 Ironically, the emergence of a clothing production network was the result of MFA-imposed restrictions on this trade. In response to tightening of MFA restrictions, Hong Kong SAR, China firms set up firms in other Asian countries including Sri Lanka in the 1970s (Dicken 2007, p. 268).
12 Global gain for consumers, on the other hand, was expected to be huge, ranging from a few billion dollars to more than US$300 billion (Nordås 2004).
13 This was related to bomb attacks at the Colombo International Airport in July 2001 that triggered the imposition of war-risk insurance charges that led to bankruptcy of several small and medium firms (Kelegama and Wijayasiri 2004 quoted in Acevedo and Robertson 2011b). The reason for the contraction was increased demand for imported inputs as the value of T&C increased in 2010.
two. Production characteristics of fibers production stand in marked contrast to production of garments:
the former vis-à-vis the latter has high capital intensity, low labor intensity, high material costs, large average size of production units, and sophisticated technology. Fabrics experienced the fastest growth followed by clothing accessories contributing 35 percent to total exports of textiles in 2010 up from 29 percent in 2005. The share of textiles and other inputs in garments production increased from 12 percent of total T&C exports in 2005 to 15 percent in 2010. Interestingly, the 2009 slump in global import demand affected these exports more than exports of clothing: the latter contracted 5 percent whereas the former fell 15 percent.
Incidentally, this also suggests that Sri Lankan clothing exporters operate increasingly in upper-niche markets less susceptible to changes in demand and the sector had grown beyond a simple stage of decentralized small workshops engaged in outward processing. Indeed, there are large local firms with international ties. For instance, the largest producer of intimate apparel in South Asia is Sri Lanka’s MAS Holdings with an annual turnover over US$700 million and employment of more than 45 thousand people in its 28 factories and design centers located not only in Sri Lanka but also in other countries in South and East Asia.14 It is also a strategic partner cooperating with several companies worldwide such as Victoria’s Secret, Nike, Speedo, and Marks & Spencer.15
Second, the T&C network is well-developed with strong supply links in Sri Lanka. The T&C network usually develops in stages with simple assembly of imported cut fabrics and accessories being the first step, followed subsequently by a series of upgrading to replace some imported intermediate inputs with domestically produced ones and ultimately to develop its own R&D and design facilities. This upgrading does not always take place. The development of backward linkages depends not only on friendliness of domestic investment regime, availability of capital and entrepreneurial skills but also on liberal foreign trade regime. As Bair and Gereffi (2001) show in their study of Mexican T&C networks, trade liberalization has contributed to the development of backward linkages and upgrading for two reasons:
it has provided flexibility for the production and it has made rules of origin less of a problem. Without a field study, it is impossible to precisely assess the extent to which a full blown T&C network operates.
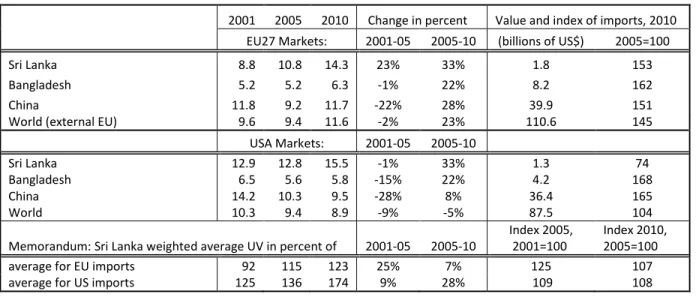
Change in Sri Lanka’s weighted averages of unit values in time and in comparison to those of Bangladesh, China and the world in two major markets for its clothing in the US and EU, accounting for almost 90 percent of T&C exports, suggests that Sri Lanka’s producers has been moving from supplying lower value added segments to supplying foreign retailers in the middle and upper tier. Several observations can be derived from the data tabulated in Table 4. First, the weighted average unit values displayed different tendencies in EU and US markets: while they fell in both markets between 2001 and 2005, the downward trend continued in the US market but not in the EU market where the weighted average was 23 percent higher in 2010 than in 2005.
Second, weighted average unit values of Sri Lankan exports to the EU dramatically improved in both periods increasing 23 percent and 33 percent, respectively; but in US-destined exports, the increase took place only in the post-MFA era in 2005-10. It was a reflection of Sri Lanka’s businesses’ focus on higher value added products such as lingerie including underwear, mainly bras and swimwear, as well as the shift from woven to knit apparel production (Lopez-Acevedo and Robertson 2011a, p. 123-25). The increase in Sri Lanka’s unit values contrasted with the contraction of these values for total imports as well as imports from China and Bangladesh in 2001-05. The increase was the largest in 2010 as set
14 This would suggest that MAS Holdings operates also as ‘middlemen’ in a triangle geometry of buyer-driven chain, observed in many East Asian countries (Gereffi 1996), which consists outsourcing some of the requested production by EU or US retailers and designers to affiliated offshore factories in countries with lower labor costs.
15 See their website http://www.masholdings.com/index.html, accessed on August 18, 2011.