POLICY RESEARCH WORKING PAPER 2859
F;+hn~;fn
Ld1111-on"ArA- Ctll '. -i.'.iVY 11 f42n Al- YIInCT4= a 5 th n; c L~13ya1111 1%,r; f; n
in Sri Lanka
Mohamed Ihsant Ajwad
The World Bank
Poverty Reduction and Economic Management Network
F Economic Policy Division June 2002
Public Disclosure Authorized Public Disclosure Authorized Public Disclosure Authorized Public Disclosure Authorized
|
POIYRESERCH
WVY3ORKING PAPER2859
Abstract.
Ajwad and Kurukulasuriya examine wage inequalities in The authors find that ethnicity is not a significant
Sri I annk's fArmr.-t- uida frnor the Sri l anka
deterInant--
of .. a.e Th1 resIut is robst to diff-erentIntegrated Survey 1999-2000. The study aims to: specifications. In addition, ethnicity is not significant in Investigate whether the labor
mnarketis any of thle conditional quantiles estimaLed.
characterized by wage disparities among ethnic and However, there is gender disparity in wage rates in Sri
gender groups. Lanka. The magnitude of this disparity varies depending
* Identify the determinants of wages and the factors on the worker's ethnicity. This gender wage disparity that affect the wage differential. varies by about 10 percent for Tamils and 48 percent
* Analyze the determinants of wages across the among other ethnicities. In addition, the authors find conditional wage distribution. that much of the gender disparity is not explained by
* Disaggregate the ethnic or gender wage disparities productive characteristics, implying that discrimination where observed into a component affected by the against women may play a role. The quantile regression endowm.ent of productive characte-ristics, as well as a estin,ate s linditat. iull. pA-aid_- tAo
-mal -oescomponent affected by the returns to those productive in the labor force is more pronounced in the upper characrerisrics in rhe laDor market. conditional wage rate distribution.
This paper is a product of the Economic Policy Division, Poverty Reduction and Economic Management Network. Copies of the paper are available free from the World Bank, 1818 H Street NW, Washington, DC 20433. Please contact Zeba Jetha, room MC2-422, telephone 202-458-4321, fax 202-522-7551, email address zjetha@worldbank.org. Policy Research Working Papers are also posted on the Web at http://econ.worldbank.org. The authors may be contacted at maiwad(iworldbank.ore or pradeep.kurukulasuriva(yvale.edu. lune 2002. (22 paaes)
The Policy Research Working Paper Series dissemmiates the findings of work in progress to encourage the exchange of ideas about deeZpmrt sses n b;cteofth sr;e ; o get the fmd;r.gs out qu.:ckl-y een; h preetto; rels hnfllI oihd h papers carry the names of the authors and should be cited accordingly. The findings, interpretations, and conclusions expressed in this paper are entirely those of the authors They do not necessarily
rephrspnt the vie!w nfthe Wnrld Banb
rtsExecutive Dtrectors or the countries they represent.
Produced by the Research Advisory Staff
Ethnic and Gender Wage Disparities in Sri Lanka*
Mohamed Ihsan Ajwad The World Bank
(maJwadwworidbaunk.org)
&
Pradeep Kurukulasuriya
0%,IIUol
of Foiesu. y du En,iviirULUhI.en"u 'LUU.ies
Yale University
(pradeep.kurukuiasuriyaayaie.edu)
Aiwad is with the Poverty Reduction and Economic Mana8ernent vice nresidencv of the Wnrld Rsnk
Kurukulasuriya is a doctoral student at the School of Forestry and Environmental Studies at Yale University. We
thank David Balan, Manuela Ferro, Elena Glinskaya, Shivanthi Gunasekera, Sharmila B. Kurukulasuriva. Lal
Kurukulasuriya, Martin Rama, Robert Mendelsohn, Gabriel Montes Rojas, and T.N. Srinivasan.
I. Introduction
This study analyzes wage disparities in Sri Lanka's formal sector. Using household survey data from the Sri Lanka integrated Survey i999-2000, we examine the extent of disparities in wage eamings due to ethnic and gender differences. Sri Lanka makes an interesting case study for ethnic disnarities because of the ethnic tensions that have been prevalent over the last two decades'. The claims of discrimination have sparked a civil strife that has gathered momentum since the mid '80s. A study of gender disparities in Sri Lanka is relevant because the country is often viewed as one of the most
p.ogressive
comf.;es intAhe
region _; rer5 -Adto th.e
gne _2 TUnnr.r- , r-r +i,n e+l;-.iand gender claims of equality or inequality are anecdotal and the need for rigorous evidence is clear.
This study has four main objectives. First, it investigates whether the labor market is characterized by differences in the hourly wage arnong ethnic groups as well as between males and females. Second, it iuenuiies ute deter minants of wages ana the iacwrs thaL affect tne wage differential.
Third. the determinants of wages are analyzed across the conditional wage distribution. This allows us to identify where characteristics are rewarded most, rather than only quantify the retums to characteristics on average. Finally, where wage disparities are observed, it is disaggregated into a component affected by the endowment of productive characteristics and one, which is affected by the returns to those
"Vr^Ai ;hoio,.tistpc in thek laohr
r. lret.
Tfit is fiu,rnA
flatti,p
,ehwnsto
+P,.,-c,e
.*.;csare different across groups, we hypothesize that discrimination exists 3 . In determining the factors affecting wage disparities, this study controls for human capital accumulation using worker's highest level of education achieved, potential labor market experience. Other controls used include the sector of employment (i.e. public or private), geographic locaLion, industry type and the number oi nours worKed.
Wage disparities among ethnic groups or between gender groups exist in almost every country and one can think of two main reasons for this. Firstly, members of different ethnic/gender groups may choose different levels of accumulation of productive skills. This maybe motivated by, among other things, culture, geographic proximity, historical reasons, etc. Second, even in the presence of equal
p1omdnurminta nf
tnre%1iitiv.e
.dri11s wamo iinpnii,lihitv
rmay i-ivait if Ppvw,levo-re ui-A ,rli ldifferently depending on the ethnic/gender group of the worker. Such potential causes of wage disparities are not necessarily mutually exclusive and hence, may occur in conjunction with each other.
'Claiming that the majority Sinhalese (74%) has discriminated against the Tamil minority (18%), a group of Tamil
mitants, nam-ed tie Tami Tigers
Lve engagteu in an intnsive oaile wiii inS nri LanKan Government for almost two decades. The New York Times (February 24, 2002) reports that the conflict has thus far taken the lives of more
#%-
LLAQU60A,000
WV,'~'peopleX.
jJUJ12
Sri Lanka boasts the first female head of state in the world and also has a high female formal sector participation
rate.
3
For a critical analysis of many discrimination studies, see Heckman (1998)
2
Considerable research on wage inequality due to ethnicity/gender has been carried out in the United States, particuiarly since the emergence of civii rignts legislation (Becker, 1957; Arrow 1973;
Squires; 1991; Marshall. 1974. Gunderson. 1989)4. A limited number of studies have examined the determinants of wages in Sri Lanka. Exceptions include, Aturupane (1997), Bowen (1990), Kelly (1993), Rama (1999), and Ranasinghe and Hartog (1997). This study distinguishes itself from the above studies in three ways. First, this study estimates wage equations with detailed information on Sinhalese, Tamils, Moors snd OAfl.er ethnicilipc OtA,.er stAudi-c e,nerol.ly, conerota on 1i'ffen. es bet-w . Cn.-Lnlaa -A
Tamils only. Second, this study controls for geography, using provincial indicator variables, and it controls for the industry of employment, which the above studies do not do. Third, we are not aware of any other study to investigate the ethnic and gender impacts on wages, by identifying the component of wages that is explained by the endowment of productive cnaracteristics, versus the component that is explained by the returns to productive characteristics. In addition to the above studies, Glene (1 9R6) and Dunham and Jayasuriya (2000) investigate the economnic liberalization and income inequality in Sri Lanka. Other studies have explored various aspects of ethnic tension and disharmony in the island (Rotberg, 1997; Bidwai, P, 1993; Philipson, 1998). However, while there is intense interest in the ethnic
; rinS-, T gnka hy the pnonlr media, thie academirc litertua.hre ho-c Lot pFs-ed
4- 0i. 'w.op.
vigorously, especially with regards to quantifying the magnitude of wage inequality between the two main ethnic groups.
The remainder of this paper is organized as follows. The next section presents a description of the data used in th-,e study. Section m presents a desciption of the unconditional differences between various productive factors and labor market outcomes by gender and by ethnicity. Section IV analyzes the determinants of log hourly wages. The penultimate section presents the Oaxaca decomposition where appropriate and Section VI concludes.
4
Maume (1999) found that African American men are not promoted as frequent a rate as White men. Raudenbush and Kasim (1998) did not find that ability or occupation preference to be significant in explaining ethnic-based wage differences. Baldwin and Johnson (1996) argued that roughly two-thirds of the difference in wages of Black and White men cannot be attributed to productivity. Duncan (1994) found that labor market discrimination may limit the eaming potential of Black males or that differences in school quality may not have the same effect over time for Black a[d White males. Maxwe'l (194
A' euheri ic' d that
E-erconurolg l iguv
ur yand ability biases that exist when estimating the education-wage relationship, differences in wages arise from ethnic differences in the
qu-0-_tJ., Of ed m.tion raL4er4,on fLIn= om differen-cesi q* of ed.-cion. Y et, We .berger '199-8)O
AuL-,
.T - -_~~~~~~~~~~~ '..4 NeV t4i
~77O)
k~ bJIULWCU U1m4White and Hispanic males with college degrees earn, on average, 10 to 15 percent more than their comparable Black
and Asian male and White female college graduates. Likewise, Hs.ueh an-d Tienda (1995) fn,lnA thhat m;^txren
receive less compensation for similar labor force participation as well as observing a greater incidence of unemployment periods among minority men Mason (1999) for instance noted that 50 percent of the African American and Latino male to White male wage differentials are due to market discrimination.
3
II. Data
This study utilizes the Sri Lanka Integrated Survey 1999-2000. The survey was conducted across all nine provinces in ate country between October 1999 and ihe tnird quarter oi 20uu. ine dataset is based on interviews of 7,500 households and includes data on 35,181 individuals. Given reservations regarding the quality of the data from the North and Eastern Provinces of the country (due to ongoing military operations) we conduct our analysis on a restricted dataset that excludes the two provinces.
However, the North and the East are interesting regions because minorities mainly inhabit these regions.
To exan e the .- robnatness of our results, _ .- conduct an analysis _ ith a dafaset inclusive of the North and Eastern Provinces.
This study focuses on salaried full time (as opposed to casual and other types of) wage earners.
Wages are defined as the take home salary of an employee plus bonuses and tips (the value of benefits
tnat an emrployee may receive frorm ieir workplace, incomes from own businesses, property rents, and transfers are excluded) 5 . We restrict the sample to workers between 18 and 65 vears of age and working more than 20 hours per week. Thus, the sample in total includes 2167 workers of which 92 percent are Sinhalese, 4.3 percent Tarmil, 1.1 percent Moors and about 2.6% belong to other races. These proportions indicate that Sinhalese are over represented in the fornal labor force, and that the other three minorities
-re
u-r den erp,esented
mrth.e fnirmal
cPrtnr6tHnuyprP aonrn-vivnatPlu 1
nprepPn1of forrn.al sctor
rwlrare male and 39 percent female which is representative of the current gender composition of the salaried full time workforce'.
In our multivariate weighted regression model, we use as the dependent variable the log of hourly wages (LOGWAGEHR). Tne nOurs worked per day is calculated as the ratio of the reported nours worked per week to the number of working days per week (which we assume to be 5 davs). Although studies of wage determiinants employ different explanatory variables depending on the particularities of the study and the availability of data, this study employs a set of explanatory variables that can easily be compared with other studies on wage determinants (Blau and Beller, 1992; Oaxaca and Ransom, 1994;
Olsen. an.d Coppn, 2001; Sherer, 2000). The two .. ost conmmoly eployed controls for a o rer'_ s productive skills are educational attainment and number of years of work experience. We employ a series
5
There is possible selection bias herein that diascariintion could be reflected not in wage rates but on wnemer or not a person is able to get a job that allows him or her to work more than a limited time.
6 m -
JIJUIUIPIUUVL '_ IJUai A4iU J. UAV L MLLVy__
04111JV.7A1_ .e:.1 :_
LLWU3IVV UVIiL yULUViiiI.VbJ LO IJO.L.._..
. A__ _r A1. I "Can:_L
01il1U5, _1_ _ _ ____ I IC- AJ prJlJI II --- , 0percent Moors and about 2% belong to other races.
C.
e -fli,fl t'.nnnJ (2000) reprte lte rn a of Jge USleJ and It,LUain JM w.! force is
approximately 65% and 35% respectively. The ethnic composition is comparable with our sample estimates.
4
of indicator variables that represent the level of education completed by the worker. 8 As with other studies, we proxy for the real experience of a worker with the potential experience given the worKer's age and education. We. define potential experirence (FXP) as a workers age less the number of years of education received less six 9 .
The sector of employment is reflected by an indicator variable which divides workers into the public or private sector. An indicator variable is also included to denote whether the worker is employed
iL a rLUal or urban area. The industries rep.-esentred iAn th-e sarmple include (a) agrclture, hunting and forestry; (b) mining and quarrying; (c) manufacturing; (d) electricity, gas, and water; (e) construction; (e) trade, restaurants, and hotels; (f) transport, storage and communications; (g) finance and business; and public administration and defense. In order to capture the potential impact of geography on wages earned for such impacts, we use indicator variables based on provincial information to identify tne geographic location of the worker. The geographical coverage extends to all nine provinces of the country.
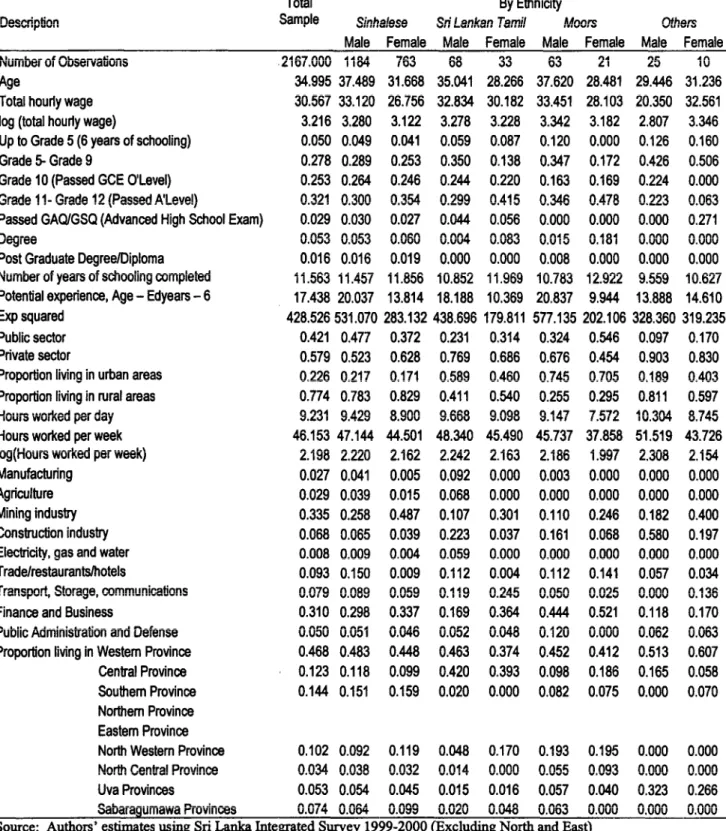
m. Unconditional dhfference between opnder/ethnic - runs
Table 1 presents the unconditional sample-weighted means for a variety of variables related to the study. The unconditional difference in the hourly wages between the two ethnic groups is statistically insignificant at conventional levels of significance. The unconditional means of the sample indicates, however, that the hourly wage of Tamii male workers is approximately 0.30 Sri Lankan Rupees (SLR) lower than Sinhalese male workers. The Tami i wome,-n appear
toearn about 3.4 percent more per holr than do Sinhalese women, albeit the difference is not significant. The difference in the wage rates of Sinhalese and workers of other ethnicities (including Indian Tamils, Malay, Burger and smaller Chinese workers) is also similar. Non-Sinhalese males and women earn 13 and 12 percent less than their
isimaiese co-uiLerparts, respectivelly. vve-al:, wormien earnn about 6 percMItL less
ivunn ,,,alle w0J-er-s.
The accumulation of human capital, measured here by the highest level of education completed, suggests that, on average, all workers had completed at least 11 years of formal education'°. In essence, the average worker has the equivalent of a GCE O'level certificate. Female Tamil workers tend to have a marginally higher average level of education (12 years), compared to both Sinhalese Male and Female workebsrs and compared -rid" male Townfl 1 lrorkers. Fernaele Moors ho-d th.e hialltest n,imber of ye of s As Neai and Johnson (1996) indicate, the number of years of schooling is a noisy measure of a worker's SKill because it measures an input and not an output. In addition, the measure leaves out the quality of education received.
9 Corrections are made to ensure that any additional years that a respondent may have spent on his or her formal educaul.on, genrally duc
to grade repet.iton, Jlu accountedfor
when vvn... dedi,.ng e 6 E ue..10 Heckman (1998) draws attention to some of the problems associated with using a measures like number of years of schooling to capture huiman capital, since personnel deparent venSus
datacommonly
aV.ailbleto econometricians.
5
education, with 13 years. Almost 18 percent of Female Moors have an undergraduate degree, while 8 percent and 6 percent of female Tamils and female Sinhalese have undergraduate degrees, respectively.
1i1e avezagea ag
irtj VI
4 WUILVl iI ULU b4LiJIlV lb iJ 35yumb. V'VlItr.lb Il UIV b41ilple h14avcapproximately 17 years of potential work experience. Sinhalese workers have 1.8 years of additional experience compared to Tamil workers, although the difference is not significant. Analysis of the difference in means of experience between the two ethnic groups is significant at the 95% level for female workers.
Workers snend about 9 hours a day, on average, at work= Sinhalese femnales work marainallv less hours per day than Tamil females (8.9 as opposed to 9.1 hours per day), while there is also no significant disparity among males of Sinhalese and Tamil ethnicity for hours worked. However, males from other races appear to work about 10.4 hours a day on average.
T;.e
&11A-s-;bU-#n
AWLU IU'-.m.,of
MJ WWL~I Y.L-v1-e
jJGtiv&IFUUMIIIa;.pto -;...44
ALIve ;.rdu;e
LU'., UIUUJ%O%AUf.able
kJ. Q I GUI %,2) .-eval
j 4l,W64Gl+U=at *Ue
UIaL U11 l iaIJJilLy la-loyi
employed in the finance and business industry (including finance, insurance and real estate/business) and the agriculture industry. The agriculture, trade and hotels and finance and business industries together accounted for more than 60% of employment. The above representation of employment reflects the underlying structure of economic activity in Sri LanrKa in recent times where, aiong witn the traditionai agriculture sector. the service industries (esneciallv in finance and tourism) have begun to play a very prominent role (Central Bank, 2000).
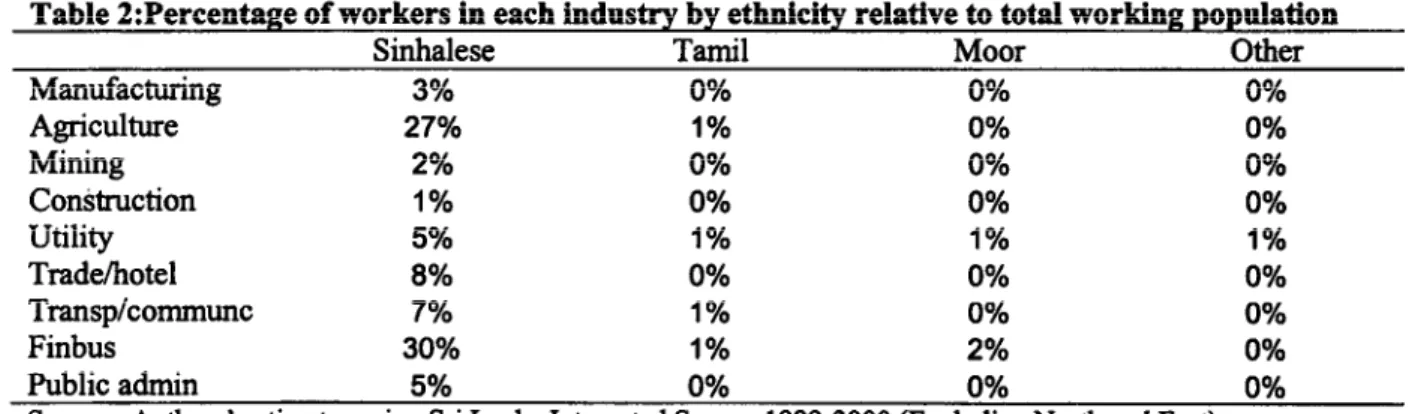
The proportion of Tamils workers in each industry is less than the proportion of Sinhalese workers. A complementary and pertinent statistic is the proportion of workers by ethnicity relative to the
total r..b r of-t-rr of +'k.t s..e ethnici;;+ {Table 3 A, ex ;a-;o o +3e dis4+.bu-4on of +ek
tUt4al *.LI % J1 PA VTLf a, .1 tt* U L ,1
~
fMIlh'IJ .ASUt, . fIR t.aa.IU.IISI,1 V It. E& '.41UOLU UULLUL Mi. UIC..ethnicity of the workers across the various industries reveals an interesting pattern. There appears to be a very high proportion of Sinhalese and to a smaller extent others, in the Agriculture sector. On the other hand, the proportion of Tamils and Moors is highest in the utility and public administration sectors.
interestingly, the data indicates tnat tne proportion of Tamii workers is higher than the proportion of Sinhalese workers in public administration. finance and business, utilities and manufacturing. The proportion of other races is highest in the utilities and manufacturing sectors respectively. Participation of the ethnic groups in the various industries suggests that a large proportion of minority's are in utilities and public administration.
Thne anlqo vxo..tdk rnAonninnol
mean
of wo nages A lk- etl,,ic g o *... th.eindustry wage suggests that any claim of bias (in wages) against Tamil workers is not obvious. For
example, in the manufacturing and agriculture industries, Tamil workers earned an additional SLR.4.22
and SLR.3.28, respectively, compared to Sinhalese workers. In the case of the construction industry
Tamil workers earned an additional SLR.24.00 per hour" 1 . In all other industries, Sinhalese workers eamed (on average) more than Tamil workers, with the most dramatic ditfterence (more than SLK 8.00j) observed in the construction industrvy trade, restaulrarnts and hotels industry and transpnrt, storage and communications industry and utilities industry. Sinhalese workers in public administration, finance and the manufacturing industries earned approximately SLR 3.00 marginally more than Tamil workers. There appears to be more inequality in wages between gender, rather than ethnic groups. In addition, the
UlDiRUILt 1iS Ulr LSiIIiI.alIl ali101-U1gr .JIUlaluov, 1a4Ulv UliIl IdLIUi WUL&Ibr-. U-LLI
Ule case
i OfUULtLal
workers, the gap between male and female earnings is approximately SLR 6.00 per hour (in favor of males). In contrast, female Tamil workers earn on average less than SLR 2.40 per hour relative to Tamil male workers.
More than 40% of the sample resides in the Western Province, the weaithiest of all 9 provinces in Sri Lanka- While this reflectq the underlvina npoulation distrihution in the iqland in general12 this i_ alsn bound to influence the relative wage of Tamnils as they predominantly live in less economically active areas. That is, location of the workers does make a difference to their earning capacity. However, in this analysis, we exclude the North and Eastern Provinces-two of the most economically depressed the
co-+-, -ULk^
rL-1,41;-;+
+A A+A+ of+1 +A--AsaA 1 ;WVJUA-LL, VT s Os=J D *fl* V *.*fl ; WA9s SL Va., It WO VU U V W UsAb ULQUt 9..
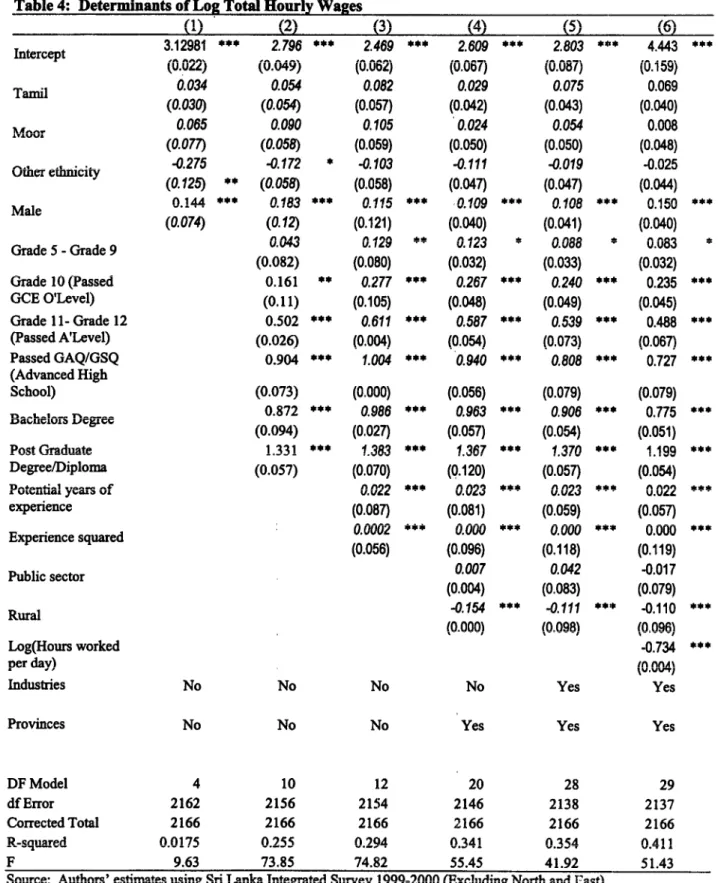
IV. Determinants of log wages per hour
Table 4 presents the determinants of wage earnings among salaried wage earners. The dependent variable is the log of the totai wages per hour. Specification (i) uses gender and ethimcity as the only determinants of wages. Workers from Other ethnicities appear to earn almost 28 nercent less than Sinhalese, and men earn about 14 percent more than women.
Specification (2) includes education as an additional determinant of wages. All the education indicator variables, except the Grade 5 - Grade 9 variable, are significant at a 1 percent level. The
A;,- 44-- of clk.- ;. A"L. coef.c-r+g w.tr educa+.;on -is-- -co+.ed fo; Zs ConS:_4-_4t -i'uLl xs
LL A1W1LAMIA M -f ". WWLI LI IL4I VT AILd %AA~IA%IC&U , La GO,V.LLJULIL%LA lJi I LJ IOUW1L ILL WIUI VA1bLU16
literature (Van de Well et al, 2000; Cameron, 2000). Estimates of the returns to education based on the methodologies of Mincer (1974) and Becker (1975) have helped establish high rates of return to education in developing countries and have been cited as evidence for furither investment in education, especially primary education (rsacharopoulos (i985; 1994), World Bank (i986)). T ne inclusion of the education variables has three main effects of other included variables. First; the hourly wage paid to
t This result must be interpreted with care, as the number of observations for Tamil workers was very small relative to Sinhalese workers; which is more than likely to influence the mean of wages earned by thi. grou.
2
Given that more than 70% of total industrial activity is concentrated in the Western Province
7
Other races drops from 28 percent to 17 percent. Secondly, the wage premium paid to males increase from 14.4 percent to 18.3 percent.
squared are significant at a 1 percent significance level (specification 3). As expected, hourly wages appear to increase with experience, but the relationship is concave. The inclusion of experience results in a further increase in the wage premium granted to Moors, while the lower wage rate observed among workers in Other races becomes insignificant. in addition, the premium paid to maie workers decreases to II nercent when experience is held constant. Interestingly; the inclusion of the experience variables also has the effect of making the Grade 5 to Grade 9 variable significant at the 5 percent level.
Specification (4) has three additional controls in the determination of log hourly wages. These controls are whether or not the worker is in the public sector, works in an urban area, and the province of
+1th n,no.er. 'TI.0 a seconr of fh.,flnsn'fon+ +.ot a--I--- to 1,gre a oigr. --
4 nt ;.mfac+ on fs 4
wagee
,v ua V Wnt.~V. r., .. - II- --.
oe.-L -LV...
y..J -. -... aFJj~D% L0 M A WL - Va -a ,nll,L, .... .JAJ " A.. Ivrate. However, several of the geographic indicator variables have a significant impact on the wage rate.
For instance, workers in rural areas appear to receive about 15 percent less than their urban counterparts.
None of the race variables becomes significant in specification (4). However, males appear to earn about i i percent more than their femaie counterparts.
Specification (5) includes all the controls of (4). with 8 industrial indicator variables included. As in (4), all of the race variables remain insignificant, and the male indicator remains significant.
Specification (6) includes the wage determinants from (5) and the log of the hours worked per day. The levels of significance of all the variables in (5) are observed in (6). In addition, it appears that the log of
the hours
orked hrs .-.a
ea4,rnand
s ;n,nan+ onwage .ae
The coefficients on Specification (6) deserve some explanation. First, as in all the other specifications, none of the race variables are significant at the 10 percent level. Men tend to earn about 16 percent more than their female counterparts. All the education indicator variables are significant at the i percent level, except that Grade 5 to Grade 9 variable, which is only significanTi at the 10 percent level.
We find that the returns to primary education is about 8 percent while the returns to passing the O'level examination is about 24 percent more than if the worker had less than 5 years of education. Therefore, the retums to passing the O' level examination is 16 percent relative to passing primary school' 3 . Workers who pass the A' level examination earn about 49 percent more than workers with less than 5 years of experience an.d orkers with a bachelor's degree earn about 78 percent more thfa wlorkers -,;,i less than 5 years of experience. The pattern of the potential years of experience is as expected. That is, wage rates increase with years of experience but the relationship is concave. The optimal amount of
'3UC C.ul"se m LS coUare well witU £LUy (' 993. R..uLy SUnU LUaL LUI rLeULU s .LULUUY edUUcatUiU are. auuUL W
percent and the returns to passing the O' level examination is 18 percent.
8
potential experience appears to be 36 years. The sector of employment, i.e. public or private, appears not to affect the wage rate of workers significantly. In addition, a number of geographic variables assume
siifict cf:.ci. tsn o.-.A s i -,rl., areas oarorr to% eav, albnilt 1 l
r1,irgnt less thrin cirnilnr
OI&IIIUflLGU C.tfllaefLdl , W Mt VT=J a11 S m tk'S
_IA
workers in urban areas. The number of hours worked has a negative impact on the wage rate and the industry indicator variables assume significant coefficients.
The OLS results in Table 4 suggest that race variables generally have no impact on hourly wages and tnat men are paid a premi-urM relatizve to wormen. iOwVever-, tuh
auUvVjysu'w ihave ow be intLrpreted with caution because of the possibility of heterogeneity. Table 5 presents the OLS and quantile regression estimates of the determinants of log wages using specification (6) of Table 4. The quantile regression estimates are performed at the 0.10, 0.25, 0.50, 0.75, and 0.90 quantiles.
For the ethnicity variables, the OLS results and the quantile regression results all suggest that
ethn1iCit+ hoc
inniwmactt nn t1hew uage r_ite nf fwrmn1 pertnr inmn1nvlt-^es The ,,ender vnrinhle iQ pnositV. 2nti
significant for all the estimated quantiles, as for the OLS. Interestingly, however, it appears that the returns to being male are higher at the top of the conditional wage distribution than lower in the conditional wage distribution. In the case of education variables, the coefficient signs and the
signinfcance are
veryshIin[lar to
'Uie OLS case. Of uieC V[i4UIbl UIUL shoUW V4LLIdUUII acoUbs UiL q-UailUlUti, ILaDDears that Passed GAO/GSO (Advanced high school) has a higher return at the top of the conditional distribution; while the variables completed Grade 5-Grade 9 and completed a postgrduate degree/diploma have lower returns at the top of the conditional wage distribution. The potential experience and potential experience squared have the expected signs across all quantiles except when
n=0A
IA At th. l1nwur et-nA nf the i,ninditinna1 wage disdtr.hii1ion the re.iniis
t,pYnpri-nr.p
2nppertn hp.
close to zero. Figure 1 presents the locus traced by coefficient estimates across quantiles.
V. Decomposition of the Wage Gap
I
nC aDoveanal-ysis shUws
uIaUL con dUiiLio1l41 impac ofeI'L. L Y 1i UIsgI 1LIgLaUt Un it Ua L deeiUii1lof wages per hour. However, there is a significant gender disparity in hourly wages. In the case of the Sinhalese, female workers earn about 1 1 percent less than their Sinhalese male counterparts, and Tamil women appear to eam about 10 percent less than their Tamil male counterparts. These disparities are much higher for Moors and for Other races. Our estimates suggest that Moor women earn about 37
percent.tls
tlheSsMor ran M,n e.
IhilP (ierurinern earti ohi
itAR tprcepvnt less
thrnithei;r
Othervmre
counterparts. Our estimates are comparable with Kelly's (1993) estimate of a 28 percent wage premium
paid to male employees and Rama (1999), and Ranasinghe and Hartog (1997) estimate of a 20 percent
wage premium paid to males relative to females.
There appears to be a significant variation in the conditional wage disparities between males and females for the four ethnic groups considered here. Therefore, it would be useful to decompose the
A:.PG iint,n t1ht ,whiwh iS eypvtdi.n.p Ku nrneluut-tiv.
,1r-rct.rtit.h ^tw,y_ mn, nt mii opSda pnvr..nipn.t
that measures the returns to productive characteristics. A disparity in the returns to productive characteristics is defined as discrimination.
This study employs a decomposition proposed by Blinder (1973) and Oaxaca (1973). Both
LUUIVb UWUlllUbi U19 111RW_I HIULA rl UUJ WUOV ULI_-_llUtl I ILU LUIL W[lCll 1 4tLWUUWUOi LU U1LIW_TULXV5 Ul
productive characteristics and into differences in returns to characteristics, as might arise from discrimination. Applications of the Oaxaca- Blinder decomposition include identifying the gender wage disparities in 15 Latin American countries (Psacharopolous and Patrinos, 1994), measuring the disparity in living standards between ethnic minorities in Vietnam (Van de Welle and Gunewardena, 2000),
et.-timting the gender nmrnematinn gasn amnno high lewvel pypt'iivpg in thp TUS (f-trnuin andi Hallv--k
2000), and estimating the public-private wage differentials in Canada (ueller, 1998).
Following the Blinder (1973) and Oaxaca (1973) methodology, the log of the wage rate of individual i belonging to group j is given by,
ill = X 0 W f 3 +e, [1I
WIVLVeeX, LUis
a vecItor of obeVU0edV wage-r-eladq.
cI.L-aCtVeL-;sV;c &LIU t: tLUedisuibuu iiOllllally W-UI ze1ro mean and constant variance. The vector Ai3 represents the returns to the observed characteristics. These returns are assumed to be common across members of the same ethnic group but can be different across groups. In effect, members of each group compete with each other, but not with members of the other group. So, the return to each characteristic is equalized within groups, but not necessarily across groups.
Non-discrimination thus means that all workers reaardless of ethnicitv comnete in tlhe Sae market.
Equation [I] is estimated for males and females separately. If it were the case that the returns to characteristics of the males are the baseline, then a female worker with the average characteristics of a male, and compensated under the wage structure of a male worker, will receive WK = pMXiF . In this case, the wage differential can be attributed to differences in productive characteristics between the male
-ULd fe.-. VT vJ £%-'1 0, ut r,o d v to ur,eqwal Fpy 0s""c4U%1r0. A ilsl la.
InW,,,, - ln W. = ,F Xn- ; 21
Equation [2] provides a measure of the difference in observed wages between males and females, purely due to the group's characteristics and not due to differences in returns to characteristics.
The wage differential due to the difference in the rates of return on characteristics for a female, with mean remale cnaractenrstucs, Is given by,
1iW = .W- iF FP PM L iF L[3J
10
Since expression [3] is the wage difference due to the different rates of retums to skills based on whether a worker is male or femaie, it can oe interpreted as a measure of discrimination.
The wage differential between males and females, each with mean skills, is then given by subtracting [3] from [2],
InW. In WF = -M(XM -XF)(+ OM -/FF)F [4]
The above specification uses the characteristics of a male worker as the baseline.
14 The total gender wage differential is then given by the sum of the difference in characteristics between members of
the two grouips and the Aifference in, rehwrns to characteristics for mean ferale charactestics. The first term,
47u(.X, - XF), refers to the pre-market factors that lead to a wage disparity. In other words, it represents the impact of the difference in the productive characteristics between the sexes. The second factor, (M - .BF )x,YF measures the difference in returns to skills between the males and females. This is our measure of discrimination, since it relates to the inconsistent rewarding of productive characteristics for women versus men.
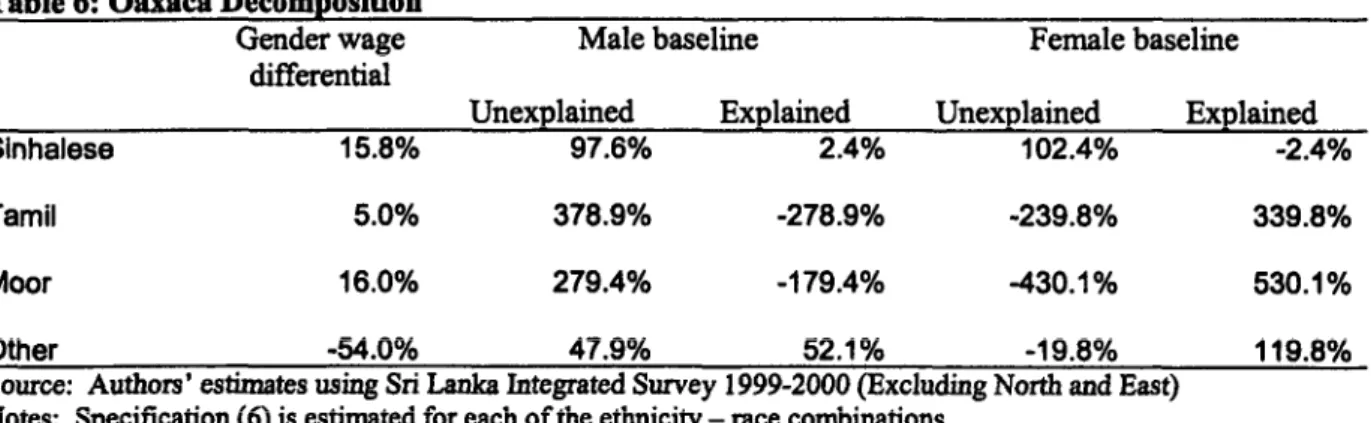
AbUle 6 F theLL&J UA VI oUa Ulu, WG5.v, UiLLVJLVJUa4 WVV II Ibe. re,, d ivii llialub,
disaggregated by ethnicity. The results are obtained by estimating [4] separately for the four ethnic groups using Specification (6). The first row of the table presents the findings when males are the baseline, while the second row presents the findings when women are the baseline" 5 .
Wnen the male wage structure is assumed to be the true wage structure, the explained portion is always smaller in magnitude than the unexnlained portion of the gender wage differtntial. The overall average wage gap between the sexes appears to be 15.8 percent for Sinhalese workers. Negative 2.4 percent of this difference in wages is explained by differences in characteristics, while 97.6 percent of the gap is not explained by productive characteristics. For Tamils and Moors the overall wage gap is 5
M_c..
A.d. 16 pr-.t s 0j...ib,e. v C.a.e tna,aj,an..edlJ p.fl;on ofA LLO.i wvage diff-.-t.il exceedsb 'U,e I'UL
log wage differential, suggesting that the productivity related characteristics of women is higher than the characteristics for men, but the returns to those characteristics is lower for women than for men. For Other races, the overall wage gap is -54, implying that the women are favored to the men in this ethnicity.
Furtnermore, tne tnere is an even split between tne unexplained and expiained portions of the overall wage differential.
For Sinhalese and Tamils, a similar pattem of results is observed when the female wage structure is assumed to be the true baseline. That is, the unexplained portion of the wage differential exceeds the
14 For Tamils as the baseline, in WM
-W =
FF= ,+ (8M-PF)XM . Ransom and Oaxaca (1994) show that the use of the two baselines provides two extremes.
'5 Ransom and Oaxaca (1994) show that the decomposition obtained using the two baselines are in fact extreme cases and hence, any combination of flu and 3FF are possibly.
11
actual wage differential between the sexes. For Moors, the unexplained and explained portions of the gender wage differential are negative 365 percent and 465 percent respectively. T-he result that the exnlained nortion of the wage differential exceeds the actual gender wage gap suggests that Moor women have lower productive skills than Moor men, but the returns to those skills are higher for women than for men. Thus, Moor women appear to be favored in the labor market, conditional on other factors. In the case of Other races, there appears to be an even split between the explained and the unexplained gender
The Oaxaca decompositions reveal that a large fraction of the wage gap between men and women is not explained by differences in accumulation of productive characteristics. The implication here is that discrimination (as defined in this paper) is playing a role in the determination of wages in the Sri Lankan labor force.
VI. Conclusion
This paper investigates the gender and ethnic wage disparity in the formal sector of employment using the Sri Lanka Integrated Survey 1999-2000. The study begins with an analysis of the unconditional
-,age
A
cno.-a;e4 a c o r ; .- A .dn ge.l Adr -roups. Tn aAA;ddi n to -wage ra-t.s _+lA.4r - esbetween the ethnic groups and the gender groups are observed. Second, using standard models of the determinants of wages, the factors that affect wage rates are identified. Third, we analyze the manner in which the rates of return to log wages per hour vary with the estimated quantile. In other words, we measure, not only -ne return to various dnaracteristics on average, but also the returns to characteistics for different points in the conditional distribution. Thereby identifying where characteristics matter, rather than only whether they matter on average. Finally, where wage disparities are observed, i.e.
gender, the difference is disaggregated into a component that is affected by the endowment of productive characteristics as well as a component, which is affected by the returns to those productive characteristics
in, th,e
labor mr. rket Th. Thtt.er comrpn.n..n.t is tliniogh.t ofmc as a
PrnwPslrof diaprr. n,tion,
There are differences in the unconditional wage rates between ethnic groups and between the gender groups. However, when human capital and other labor market determinants are controlled for, the difference in the wage rates is small between ethnic groups. In fact, the finding of ethnicity not impacting wages is robust to vurious specifications and uhe results are unaffected by the cnoice of the restricted and unrestricted samples. On the other hand, there appears to be a sizable difference in the wage rates between males and females in the formal sector, controlling for ethnicity. Conditionally, there appears not to be a significant impact of being a member of a minority group in determining wage rates. There is a gender disparity in hourly wages, which amounts to a 15 percent premium paid to males. We find that
the. nnnditianiA vender wave differentiAls are. bhnuit I11 10, 37 anidi AR ,eprtpt fnr Sinhalpee, TCM.ils
12
Moors and Others. Decomposition of the wage differentials into a component explained by productive skills and a component that is unexplained by productive skills suggests that much of the differential is unexplained by uii stock of productive cnaracteristics for Sinhalese, Tamils and uOter races. However, Moor women appear to be favored relative to Moor men with respect to wage rates.
There are three main shortcomings of this study. First, estimating the impact of discrimination on wages is complicated by the many endogenous factors that affect labor market outcomes. For instance, the decision to pursue education may be affected by discrimination itself. The direction of the bias is not
t2r becanise on Onll hrnwd the lo.wer rPhlrs t,o eAnatinnal attaiinmnpnt colid lead to a lower ovrall level
of education in the discriminated group, while on the other hand, the discriminated group may choose to
"over educate" themselves in order to compensate for difference in wages due to discrimination. Second, unobserved variables that are correlated with ethnicity/gender make the interpretation of the coefficients
JU, I -A wY..1zA 4- l _ 11- _e-1 we i-1_50 _ v _ _-ldt____ _ v- __l _ ___ _
UldIfcUIt. LU mllIniiUZ UIm paIct Uo
UIIUUbseLvedU
valiableUb taig thI resuts, We alsoU estmate teequations for males and females separately and obtain similar patterns of coefficients. A third
shortcoming is that we focus on wage disparities only, ignoring ethnic and gender inequalities in hiring
decisions, promotions, etc. For instance, if Tamils were held to a higher standard when managers make
hiring decisions, but pay tne hired workers the same salary as they would a Sinhalese worker, then the
above analysis would not capture the disrimination.
References
Arrnw (1973) 'Theorv of discrimination" in ARhenfelter, 0 anti Rees A (edt) niwcriminntion in the labor
market, Princeton, NJ: Princeton University Press, p. 3-33.
Ashenfelter, 0 and Oaxaca, R (1987) The Economics of Discrimination: Economists Enter the
Co-UuIuoo...II T.-.e E II- Cs of IIIM;U4 Ll.scr. ., I L.; IO Lat- T ), she Ae.a Ecor.om.;c
Review, v77, n2, Papers and Proceedings of the Ninety-Ninth Annual Meeting of the American
Pno;n110c ASSOCULaI;on,
p.pid.
31-J3.J.I T h1 ... in__. /,%Y%Y%kx TIT'l A r ZC _ el~ T _1_.
AtsiUa 1JUVViUP11o- 1L X3d[IK kZ.VV) l tA JJJ5 ZnIVIMUMMIIIUI I WaUL1bL1sV- S l LaiKa.
http://www.adb.org/Documents/EDRC/Statistics/Environment/srilanka.pdf
Baldwin, Marjorie L. and William G. Johnson. (1996) "The Employment Effects of Wage Discrimination against Black Men." Industrial and Labor Relations Review, v49, p. 302-316.
Becker, Gary (1957) Economnics of discrimination. Chicago: University of Chicago Press.
Betrand, M and Hallock, K (2000) "The Gender Gap in Top Corporate Jobs", NBER Working Paper 7931.
Bidwai, P (1993) "Island at Sea", New Statesman & Society, v6 i260, p. 16.
Blinder, A (1973) "Wage Discrimination: reduced form and structural estimates", Journal of Human Resources, v8, p. 436-455.
Cameron, L.A. (2000) "Poverty and inequality in Java: examnining the impact of the changing age, educational and industrial structure", Journal of Development Economics, v62, p. 149-180.
Central Bank of Sri Lanka (2000) "Labor Force Data 2000". htn//wwwlankaneteentralbankI dermo_labour_force.html
Chiswick, B. (1973) "Racial Discrimination in the Labor Market: A Test of Altemative Hypotheses",
IjUnLc.u, K.eV U..-. C. rT. Auvial LIl, E...ir.gs &nd CUMILIZZ"IrIA5- .O4JILWVLII. Case, of
0I
AYUIa ogi Men.Social Science Journal, v3 1, p. 237-250.
Dunham, D, and Jayasuriya, S (2000) "Equity, Growth and Insurrection: Liberalization and the Welfare Debate in ContempOrary Sri Lanka", yxford Development Studies, -v28, nI.
Giewwe, P (1988) "Economic Liberaiization and income inequality: furtner evidence on tne Sri Lankan experience", Journal of Development Economics, v28, p. 233-246.
Glewwe, P (1996) "The relevance of standard estimates of rates of return to schooling for education policy: A critical Assessment", Journal of Development Economics, v51, p. 256-290.
Gunderson, M. (1989) "Male-Female Wage Differentials and Policy Responses", Journal of Economic Literature, v27, il, p. 46-72.
14
Heckman, J. (1998) "Detecting Discrimination", Journal of Economic Perspectives, v12, n2, p. 101- 116.
VKelly,
IT (19293"Dn-
11-a4-11duct.,,,, k,l,o CIPf-ti..el,,
,i-nT
I ah^v orlMarkt.?9 VRptEvidence from Sri Lanka", mimeo.
Kingdon, G.G and Unni, J (2001) "Education and Women's Labor Market Outcomes in India",
LUucallon rcounuom5i,
V-,i2, p. 1
I.3,23p.
Marshall, R. (1974) 'Tne Economics oI Raciai Discrimination: A Survey", Journal of Economic Literature, v12, n3, p. 849-871.
Mason, Patrick L. 1999. "Male Interracial Wage Differentials: Competing Explanations." Cambridge Journal of Economics, v3, p. 261-299.
Maxwell, Nan L. 1994. "MTe Effect on Black-White Wage Differences of the Differences in the Quantity and Quality of Education", Industrial and Labor Relations Review, v47, p. 249-264.
Mueller, R.E. (1998) "Private-public sector wage differentials in Canada: evidence from quantile regressions", Economics Letters, v60, p. 229-265.
Oaxaca, R. (1973) "Male-Female wage differentials in urban labor markets", International Economic Review, Vol. 9, pp.693-709.
Olsen, R.N. and A. CopDin (2001) "The Determinants of Gender Differentials in Income in Trinidad and Tobago", Journal of Development Studies, Vol. 37, No. 5, pp. 31-56.
Philipson, L (1998) "Sacrifice: War and Negotiation in Sri Lanka", Accord Series- An International Review of Panwn Tnitiativo WNo 4, Connilintion Re-mnurcesX TrK
RegMa M. (1998)Z "Mi The Sr
ATnL-s TTnP,M,,p!n%v,M,,e,t AT>,hb|pm,Ro^2we4itid
Xapnihnc Aavea".-ch w-i
paper, 2227, The World Bank, Washington DC.
Ranasinghe, Athula and Hartog, Joop (1997) "Investment in Post-Compulsory Education in Sri Lanka",
lillUI-eo,
Ji a1Urgue JULILULUZ, I lINe,e,lV,11.L1UL.Raudenbusn, Stephen W. and ARafia M. Kasim. 1998. -"Cognitive Skill and Economic Inequality: Findings from the National Adult Literacy Survey." Harvard Educational Review, v68, p. 33-79.
Reimers, C.W. (1983) Labor Market Discrimination Against Hispanic and Black Men, The Review of Economics and Statistics, Vol. 65, No. 4, pp. 570-579.
Rotberg, R. (1997) "End Sri Lanka's endless war", Christian Science Monitor, Vol. 90, Issue 6, p.
19.
Squires, Gregory D. 1991. "Deindustrialization, Economic Democracy, and Equal Opportunity: The Changing Context of Race Relations in Urban America." Comparative Urban and Community Research 3,p. 188-215.
Van de Walle, D and Gunawardena. D (2000) "Sources of Ethnic Inequality in Viet Nam".
Journal of Development Economics, Vol. 65, p. 177-207.
1s
Annex
T nis sectuon proviaes a onei recap oi ure ineory OI asymmeu-ic refurns to proucuuve SKillS d-ue to gender. Wage inequalities do not always imply that discrimination does not prevail, nor does wage equality always imply that there is no discrimination. Consider two scenarios in which a fair labor market leads to unequal wages between two groups. Consider, first, a case in which one group has a specific skill that is highly rewarded in the market. In this case, workers with the skill would be more employable and
co - -. A flflst. r s,rn V - - O- . Tn c T," OT- -f i^,h a c ,n,a-ir% a la kn nn,arVlst Ari l* tU*V vspn hk, tnrA t iptHyit -t7 y*_-lW- v Y -- nnn dA p t fnva rniA ?In t
by discrimination, will show unequal outcomes across the different groups. Another example of a fair labor market resulting in unequal outcomes across races could be caused by geography. For instance, if one group inhabits geographic areas that are underdeveloped and undercapitalized, then labor market outcomes wouiu also re[l-ct inequait-y. 'wn neuer uie wage Inequaluly is CutSeu uy pZe-incMUZ; la
1albU[whether it is caused by discrimination in the labor force has different policy prescriptions.
In this paper, we adopt the model presented in Becker (1957). The driving force behind discrimination is assumed to be racist preferences (or racial animus) by some agents in the model.
Assume that price taking firms produce output from labor input. The production function is then:
jv'fV ) [A1]
where L is the total labor input. There are two groups of workers in the model, say, Sinhalese (S) and Tamils (T). Assume that each agent supplies labor inelastically at Ls and Lr respectively for S and T.
Suppose that the wages for S and T are respectively ws and wT. In addition, suppose that labor from the two groups are perfect substitutes. Then the firm's profit fumction is:
7(Ls, LT) =J(Ls + LT) - wsLs - wTLT [A2]
Suppose that firm owners hav,Ze Aid_;ca! but possiby
,fpreferecs"t The11 it.iliHY Anptio is +k
given by,
u(ir, LS, LT) [A3]
A utility maximizing finn owner solves:
max u((lr, LS, LT), LS, LT) [A4j
(LS LT)
The first order conditions are given by,
~
-
~
xI 7 T r__V___S___)
[f(L)-ws]+
(7l,Ls,LT)-o [A5]
a;r 841
16
au(r, Ls, LT) rf X(L) - wf I + au(ir,LS, LT) =
0[A6]
In equilibrium, labor supply must equal labor demand, thus:
1 | Ou(;r,LT,Ls) &(UQ,LT,Ls) [A7]
WS-T=
I[l7T
aau(Q,LT,Ls)L 0LS Uj-r
Hence, ws-wT whenever
0u(1r LT.LR) 0U(1r.LT LX')
-;S -, > \ - ~[A8]
aLs aLrF
Condition [A8] suggests that groups S earn a higher wage whenever employers prefer group S workers more than workers from group T.
17
Table 1: Unconditional means
Total By Ethnicity
Description Sample S.inhalease -Qri Ign.>^n TMmil AA,oors Othhar
Male Female Male Female Male Female Male Female
INumberofOlbservauon lb l.21u7. 10 4 173
00
3303
21 25IV
Age 34.995 37.489 31.668 35.041 28.266 37.620 28.481 29.446 31.236
Total hourly wage 30.567 33.120 26.756 32.834 30.182 33.451 28.103 20.350 32.561 log (total hourly wage) 3.216 3.280 3.122 3.278 3.228 3.342 3.182 2.807 3.346 Up to Grade 5 (6 years of schooling) 0.050 0.049 0.041 0.059 0.087 0.120 0.000 0.126 0.160
Grade 5- Grade 9 0.278 0.289 0.253 0.350 0.138 0.347 0.172 0.426 0.506
Grade 10 (Passed GCE O'Level) 0.253 0.264 0.246 0.244 0.220 0.163 0.169 0.224 0.000 Grade 11- Grade 12 (Pass-d A'Level) 0.321 0.30n 0.3-5 0.299 0.415 0.36 0.478 0A n n063 Passed GAQ/GSQ (Advanced High School Exam) 0.029 0.030 0.027 0.044 0.056 0.000 0.000 0.000 0.271
r% -.-- n tIC13
~~~~A)
AC2t AAeA A AIA f% A" AflA4 AiO 404 A A A Au [at; V~~~~~~~~.U,J.j U.U,j? VJ.VUU U.UIFt V.Uvli V Vi W . 101I VJ.v V. UUU
Post Graduate Degree/Diploma 0.016 0.016 0.019 0.000 0.000 0.008 0.000 0.000 0.000 Number of years of schooling completed 11.563 11.457 11.856 10.852 11.969 10.783 lZ.922 9.559 10.627 Potential experience, Age - Edyears - 6 17.438 20.037 13.814 18.188 10.369 20.837 9.944 13.888 14.610 Exp squared 428.526 531.070 283.132 438.696 179.811 577.135 202.106 328.360 319.235
Public sector 0.421 0.477 0.372 0.231 0.314 0.324 0.546 0.097 0.170
Private sector 0.579 0.523 0.628 0.769 0.686 0.676 0.454 0.903 0.830
Proportion living in urban areas 0.226 0=217 0.171 0t589 0 460 0 745 0.705 0189 0.403 Proportion living in rural areas 0.774 0.783 0.829 0.411 0.540 0.255 0.295 0.811 0.597
fl V14 flAIMf aonn A ano AAMD n 4A7 7 .71) 4A'JAA O 7AIZ
HloumO worokedper day
9 .2 9.429 8.900 9.668 9.VQW 9 I I V2.30U v.7I45Hours worked per week 46.153 47.144 44.501 48.340 45.490 45.737 37.858 51.519 43.726 log(Hours woried per week) 2.198 2.220 2.162 2.242 2.163 2.186 i.997 2.308 2.154
Manufacturing 0.027 0.041 0.005 0.092 0.000 0.003 0.000 0.000 0.000
Agriculture 0.029 0.039 0.015 0.068 0.000 0.000 0.000 0.000 0.000
Mining industry 0.335 0.258 0.487 0.107 0.301 0.110 0.246 0.182 0.400
Construction industry 0.068 0.065 0.039 0.223 0.037 0.161 0.068 0.580 0.197 Electricity, gas and water 0.008 0.009 0.004 0.059 0.000 0.000 0.000 0.000 0.000 Trade/restaurants/hotels 0.093 0.150 0.009 0.112 0.004 0.112 0.141 0.057 0.034 Transponrt, StnoranA mmmiiniratinn 0.079 0.089 0.059 0.119 0.245 0.050 0.05 0.000 0.6 n
Finance and Business 0.310 0.298 0.337 0.169 0.364 0.444 0.521 0.118 0.170 Public Administraton and Defense 0.050 0.051 0.046 0.052 0.048 0.120 0.000 0.062 0.063 Proportion living in Westem Province 0.468 0.483 0.448 0.463 0.374 0.452 0.412 0.513 0.607 Central Province 0.123 0.118 0.099 0.420 0.393 0.098 0.186 0.165 0.058 Southem Province 0.144 0.151 0.159 0.020 0.000 0.082 0.075 0.000 0.070 Northem Province
Eastem Province
North Westem Province 0.102 0.092 0.119 0.048 0.170 0.193 0.195 0.000 0.000 North Central Provin'a nnqA n0n03 r4.nq n n0A n nnn n.nsA n na nn nn nn n A
Uva Provinces 0.053 0.054 0.045 0.015 0.016 0.057 0.040 0.323 0.266
Sabaragumawa Provinces 0.074 0.064 0.099 0.020 0.048 0.063 0.000 0.000 0.000 Source: Authors' estimates using Sri Lanka Integrated Survey 1999-2000 (Excluding North and East)
18
Tabhie
of orkehs in:Percet i each indsi- byi +16iI ,re!4.veto t on*dl nwVriv "nipla4nSinhalese Tamil Moor Other
- S~~~~fliqn nfl, nf, ^nl,
IVIaZILUMA4LLUMr, a 70 U 70 1.570 U 70
Agriculture 27% 1% 0% 0%
ivimiig 2% 0% U%O 0%
Construction 1% 0% 0% 0%
utility 5% 1 % 1 % 1 %
Trade/hotel 8% 0% 0% 0%
Transp/comnmunc 7% 1% 0% 0%
Finbus 30% 1% 2% 0%
Public admin 5% 0% 0% 0%
Source: Authors' estimates using Sri Lanka Integrated Survey 1999-2000 (Excluding North and East)
Table 3: Percentage of workers in each industry relative to total number of workers of the same etyi_i
Sinhalese Taniil Moor Other
Manufacturing 3% 0% 2% 0%
Agriculture 13% 23% 4% 27%
Mining 23% 0% 10% 0%
Construction 0% 4% 2% 0%
Utilitv 2% 0% 20/. 0%
Trade/hotel 0% 1% 2% 0%
Transn/commuinc 1% 0% 2% 0%
Finbus 1% 6% 9% 3%
PA