Policy Research Working Paper 6354
Productivity, Innovation and Growth in Sri Lanka
An Empirical Investigation
Mark A. Dutz Stephen D. O’Connell
The World Bank
Poverty Reduction and Economic Management Network Economic Policy and Debt Department
February 2013
WPS6354
Public Disclosure AuthorizedPublic Disclosure AuthorizedPublic Disclosure AuthorizedPublic Disclosure Authorized
Produced by the Research Support Team
Abstract
The Policy Research Working Paper Series disseminates the findings of work in progress to encourage the exchange of ideas about development issues. An objective of the series is to get the findings out quickly, even if the presentations are less than fully polished. The papers carry the names of the authors and should be cited accordingly. The findings, interpretations, and conclusions expressed in this paper are entirely those of the authors. They do not necessarily represent the views of the International Bank for Reconstruction and Development/World Bank and its affiliated organizations, or those of the Executive Directors of the World Bank or the governments they represent.
Policy Research Working Paper 6354
This study investigates the impact of key business environment indicators on productivity, innovation, and growth in Sri Lanka through a cluster-level productivity analysis, a firm-level total factor productivity analysis, and a firm-level innovation analysis. For the cluster- level productivity analysis (as measured by output and value added per worker), it combines two established data sources in a novel way by importing average
‘industry-size-location’ cluster-level business environment variables from the World Bank Enterprise Survey to the comprehensive Sri Lanka Census of Industry productivity data available for similar clusters of enterprises. For the firm-level total factor productivity analysis, it compares data from the 2011 World Bank Enterprise Survey with those from 2004. For the firm-level innovation analysis, it compares findings from the 2011 World Bank Enterprise Survey with a representative sample of
This paper is a product of the Economic Policy and Debt Department, Poverty Reduction and Economic Management Network. It is part of a larger effort by the World Bank to provide open access to its research and make a contribution to development policy discussions around the world. Policy Research Working Papers are also posted on the Web at http://
econ.worldbank.org. The author may be contacted at mdutz@worldbank.org@worldbank.org.
enterprises collected as part of the Sri Lanka Longitudinal Survey of Enterprises. The empirical findings highlight the importance—for cluster-level productivity, firm- level total factor productivity, and innovation—of connectivity to global knowledge (reflected by one or more of export participation, directly imported inputs, foreign ownership, and use of the internet), availability of skills, access to finance, and competition. The paper also presents evidence, under the assumption that the samples are statistically representative, that both allocative and average technical efficiency have improved, with allocative efficiency increasing roughly four-fold between 2003 and 2010, and accounting for the overwhelming share of the aggregate increase in total factor productivity over this time period. Most of the improvement in allocative efficiency has occurred among larger firms, and in large rather than small cities.
Productivity, Innovation and Growth in Sri Lanka:
An Empirical Investigation
Mark A. Dutz and Stephen D. O’Connell
1Keywords: Economic growth, productivity, innovation, business environment.
JEL Codes: O47, D24, O31, O53.
This paper is a product of the Economic Policy and Debt Department’s innovation and growth work program, as part of the Poverty Reduction and Economic Management Network. The paper was co- funded by PRMED's budget and SASEP resources. The corresponding author may be contacted at mdutz@worldbank.org.
1 PRMED, The World Bank, and City University of New York, respectively. The paper benefited from helpful feedback from Francis Rowe. The authors thank the South Asia Labor Flagship team and David McKenzie for providing datasets used in this study.
2
I. Introduction
Sri Lanka sits at an important moment in its history. Per capita income, nearly double that of the average across South Asia, reflects the country’s rising status as a middle-income country. Sri Lanka also outperforms other South Asian and lower-middle income countries overall with respect to a range of social indicators. In the two years since the end of an armed conflict spanning three decades, the Sri Lankan economy weathered the global economic crisis with minimal downturn and has been growing at a relatively high rate since then, namely 8 percent year-on-year in the first quarter of 2011 (World Bank 2011). There has been sustained optimism for the prospect of accelerated economic growth and poverty reduction during the anticipated post-conflict years. As in many middle-income countries, much of this hope lies with the potential for the private sector to generate investment, spur productivity and generate broader- based, more inclusive growth. It is more important than ever to identify and assess existing constraints to investment, productivity, innovation and growth in the Sri Lankan economy.
The challenge of translating the momentum from the peace dividend into sustained higher growth of 8 percent or more a year will require structural reforms aimed at promoting aggregate savings and private investment, and increasing connectedness to global knowledge (including attracting more FDI) as a vehicle for technological upgrading. Recognizing this need, the government’s development plan –the Mahinda Chintana– seeks to raise investment rates in the country from current levels of about 25 to 35 percent of GDP. Given the government’s limited fiscal space, the bulk of the increase in investment must come from the private sector. An important distinction must be made, however, between factors which will result in a one-time upward shift in investment levels and capacity utilization rates of existing physical or tangible capital, and self-sustaining ‘endogenous growth’ as a result of transformational entrepreneurship and investment by firms in intangible or knowledge assets that drive productivity and innovation in the private sector. It is the latter that will help ensure that Sri Lanka sustains its 8 percent real GDP growth target and is the focus of this paper.
Growth theory typically assumes that aggregate output is produced combining human capital with physical capital, with growth in output explained by growth in measured labor, capital and raw materials, plus a residual part unexplained by traditionally-measured tangible inputs referred to as ‘total factor productivity’ (TFP). Aggregate output typically fails to grow as fast as it could due to insufficient savings, insufficient investment in physical and human capital, and insufficient increases in TFP. A key fact of development is that differences in measured inputs typically explain less than half of the enormous differences in per capita national income (Jones and Romer 2010; Caselli 2007). Lower-income countries are less developed not only because they have less physical and human capital per worker than developed economies, but more importantly, because firms use their tangible inputs of labor, capital and raw materials less
3
efficiently – and without combining them with sufficient complementary knowledge-intensive intangible assets.2
Insufficient increases in aggregate, economy-wide TFP reflect three complementary dynamics within the economy: (i) sectoral misallocation, with a large proportion of the working population remaining in lower-productivity sectors of the economy, such as low capital-intensity and low knowledge-intensity segments of agriculture or informal jobs; (ii) within-sector, across-firm misallocation, in which less productive firms account for a disproportionate demand for resources and are not forced to exit and make room for more productive existing firms or new entrants by the selection mechanisms of ‘creative destruction’; and (iii) insufficient within-firm productivity upgrading or innovation, the commercialization by transformational entrepreneurs of new-to-the-firm (and in a few instances also new-to-the-world) process, product, organization and marketing technologies, literally turning ideas into higher productivity and wealth at the firm level (and also across firms, given the prevalence and social desirability of knowledge spillovers across firms).
This study explores the impact of the Sri Lankan business environment on productivity- enhancing resource reallocation across firms within clusters of enterprises, on TFP at the firm level, and on productivity-upgrading innovation within firms. Our focus on business environment constraints in manufacturing is motivated by our finding that Sri Lanka has not had the same productivity benefits from sectoral resource reallocation as other South Asia economies and that there may be a need for future growth in manufacturing to come more from increases in TFP rather than be driven mainly by increases in employment shares. The paper undertakes an empirical exploration of what aspects of the business environment are associated with increases in productivity (as measured by output and value added per worker at the cluster level, and TFP at the firm level) and innovation (as reflected by indicators of within-firm improvements in product, process, organization and marketing technologies). In this context, we examine wherever possible which forces constrain productivity and innovation in the manufacturing sector and to what degree these constraints matter relative to each other.
For the cluster-level productivity analysis, we combine two established data sources in a novel way by importing average ‘industry-firm size-location’ cluster-level business environment variables from the World Bank Enterprise Survey (WBES) to the comprehensive Census of Industry productivity data available for similar clusters of enterprises. We use a novel empirical approach by comparing the relative importance and distance to a ‘productivity frontier’ given the potential relaxation of constraining business environment indicators. For the firm-level TFP
2 The importance for growth of three main classes of intangible assets has been explored recently, namely firm investment in computerized information (software and databases), innovative property (R&D spending, product development in the financial industry, architectural, engineering and other designs), and economic competencies (reputation and branding, employee training, and business process improvements). Based on the quantification of these classes of intangible assets, intangible investment is actually greater than tangible investment in the UK, US and Sweden,; and in Canada, Denmark, Finland, France, Germany and Japan, it comes close (OECD 2010). See Dutz et al. (2012a) for a recent application to another middle-income country, Brazil.
4
analysis, we compare data from the 2011 WBES with the earlier 2004 WBES. For the firm-level innovation analysis, we compare findings from the latest WBES with a representative sample of enterprises collected as part of the Sri Lanka Longitudinal Survey of Enterprises by de Mel et al.
(2009). These analyses provide complementary windows into key levers with which policymakers may improve the efficiency and novel use of resources already available in the economy.
Section II provides a context for the ensuing analyses by reviewing the importance of productivity and innovation as key drivers of sustainable high growth rates. Section III summarizes historic trends pertaining to reallocation of resources across broad sectors of the Sri Lankan economy. Section IV presents our main business environment-related hypotheses.
Section V presents the data, methodology and analysis of cluster-level productivity. Section VI and VII then present the data, methodology and analyses of firm-level TFP and innovation.
Section VIII concludes. Our empirical findings highlight the importance of connectivity to global knowledge (reflected by one or more of export participation, directly imported inputs, foreign ownership, and access to the internet), availability of skills, and access to finance as key correlates of cluster-level productivity and firm-level TFP and innovation. We also present evidence, under the assumption that the samples are statistically representative, that both allocative and average technical efficiency have improved, with allocative efficiency increasing roughly four-fold between 2003 and 2010, and accounting for the overwhelming share of the aggregate TFP increase over this time period. Most of the improvement in allocative efficiency has occurred among larger firms, and in large rather than small cities.
II. The Growth Benefits of Endogenous Productivity Improvements
Compared to advanced economies, productivity in developing economies is low because the average firm is less productive and because there are much larger differences in productivity across firms, both across sectors and within sectors, with less efficient firms having disproportionately large market shares. There is a growing body of empirical work documenting large gaps in productivity across firms in developed and developing countries (Syverson 2011, Banerjee and Duflo 2005). Recent empirical work for Latin American countries (Pages et al.
2010), for the Brazilian manufacturing sector (Ferraz and Monteiro 2009), for India (Dutz 2007), and for China and India (Hsieh and Klenow 2009) indicate that within-country TFP differentials across firms are much greater in developing economies than in the United States and Europe:
within disaggregated industries of the manufacturing sector, a plant at the 90th percentile of the productivity distribution makes on average 5 times as much output with the same measured inputs as the 10th percentile plant in China and India, while this dispersion in the U.S. has been estimated to be closer to 2:1 (Syverson 2004).
There is a twin policy challenge posed by such large within-country productivity heterogeneity.
A first challenge, and important source of productivity increase, is improving the allocation of
5
resources between enterprises. This reallocation of resources across firms includes both inter- sectoral reallocation, shifting labor and other inputs across sectors from more backward segments of agriculture to more knowledge-intensive segments in agriculture, manufacturing and services, and within-industry reallocation, shifting resources within industries from typically small, less efficient firms to growing, more efficient firms. Both structural change and selection- driven within-industry dynamics are important contributors to overall growth. McMillan and Rodrik (2011) show that Asia’s labor productivity growth in 1990-2005 exceeded Africa’s and Latin America’s largely by ensuring that the broad pattern of structural change contributed to, rather than detracted from overall economic growth.3 Within-industry dynamics are also important. In a well-functioning market economy, within-industry selection processes typically lead to the exit of a large number of relatively inefficient subsistence or ‘necessity’
entrepreneurs, and allow the reallocation of these individuals as wage workers, and the reallocation of related assets to higher-productivity, growing firms. Hsieh and Klenow (2007) find that Indian TFP could increase by 40-60 percent by achieving the U.S. level of allocative efficiency with existing resources and technologies.
The second policy challenge posed by large within-country productivity heterogeneity is how best to increase innovation or within-firm productivity upgrading. Indeed, the co-existence of efficient and inefficient firms within the same industry suggests that it should be possible for lagging firms to close the efficiency gaps. However, raising within-firm productivity through innovation is easier said than done, given the lack of sufficient empirical evidence on what works in specific contexts. On the upside, the shift in population as workers move from rural agriculture to metropolitan areas, urban geographic spaces that facilitate face-to-face learning and creative interactions between young entrepreneurs, skilled people, and institutions connected to global knowledge, should help unleash the required innovation (Glaeser 2011).
There are a number of reasons why productivity and innovation remain low. Enterprises that lag behind firms from more advanced economies in adopting and adapting available global knowledge may not be learning sufficiently from existing technologies that are better than what they are currently using, and may not be adequately improving their own products, processes, organizational and management practices, and marketing methods. The remarkable growth experiences of Western European countries and Japan in the aftermath of World War II are relevant here. Comin and Hobijn (2011) provide evidence that those countries that caught up most moved up to a higher growth path mainly driven by growth in TFP, accompanied by a large pickup in the speed of adoption of new technologies – with a substantial part of the differential adoption rates explained by differences in the amount of investment and technology transfers from the U.S. It is well-established that firms in lower-income countries spend fewer resources
3 McMillan and Rodrik (2011) show that some Latin America and Sub-Saharan Africa countries have experienced productivity-reducing structural change in response to globalization, as labor has moved in the wrong direction, from more to less productive activities including low-productivity segments of services and informality – related to local circumstances, choices made by domestic policy makers, and domestic growth strategies.
6
on R&D and apply for novel patents less frequently (Dutz and Sharma 2012), offer in-service training more rarely (Riboud et al. 2007), and have lower levels of managerial skills and training than firms in higher-income countries (De Mel et al. 2009, and Bloom and van Reenen 2007), suggesting potentially distorted incentives for firms to innovate and significant room for ‘catch- up’ growth. Firm decisions to undertake innovative, productivity-enhancing activities are likely to be jointly dependent on firm-level factors —such as managerial education and practices, workforce skills, and local spillovers— and business environment factors affecting incentives and risk-return considerations. In a sample of more than 26,000 manufacturing establishments across 71 developed and developing countries, Dutz et al. (2012b) find that product and process innovations are fostered by a pro-competitive business environment providing ready access to information, financing, export opportunities, and other essential business services that facilitate the entry and expansion of young firms. As highlighted in Box 1 for the case of China, increases in productivity and innovation are contingent on high domestic savings translated into high investment, coupled with reforms that spur global learning by firms from FDI, trade, and integration into global value chains, among others.
Box 1: China’s sustained high growth driven by savings and endogenous TFP growth
According to Yusuf (2011), China’s growth since 1979 can largely be explained with reference to four factors: (i) a steep and sustained high level of capital investment in productive industrial assets and infrastructure, facilitated by high and rising national savings rates; (ii) a succession of reforms that gradually introduced market institutions and disciplines, and accelerated structural transformation of labor out of agriculture and its employment in urban industrial activities; (iii) technological catch-up and advances in many different fields, facilitated by FDI as a conduit for technologies from abroad; and (iv) the integration of trade, capital flows, and the emergence of international value chains that multiplied the opportunities for export-led growth. All four factors contribute to increases in TFP, as investments in capital often consist of imports that embody global technological advances that are new-to-the-firm.
A sources-of-growth decomposition analysis confirms the importance of capital investment and TFP for sustained high growth rates. Between 1978 and 2004, physical capital and TFP contributed 3.2 and 3.8 percent respectively to China’s annual GDP growth of 9.3 percent. And over the last decade of this period, physical capital and TFP shares were even higher, contributing 4.2 and 4.0 percent of annual GDP growth of 9.7 percent.
Sources of Growth (1978-2004)
Annual percentage rate of change
Output Contribution of: . Period Output Empt. per Worker Physical Capital Education TFP
78-04 9.3 2.0 7.3 3.2 0.2 3.8
93-04 9.7 1.2 8.5 4.2 0.2 4.0
Source: Bosworth and Collins (2008)
7
III. Context: Sectoral Reallocation of Resources and Enterprise Dynamics
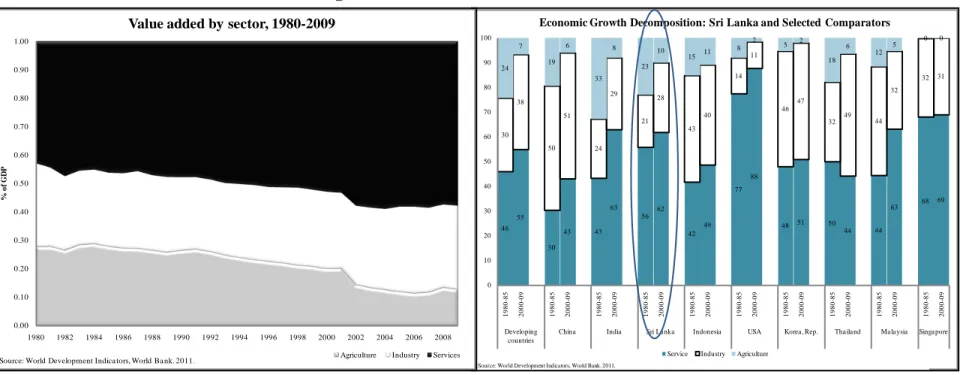
Over the past thirty years since 1980, there have been significant changes in the underlying structure of the Sri Lanka economy from agriculture to manufacturing and services. In terms of value added, manufacturing has remained roughly constant at 29 percent of GDP, while the value addition of agriculture has declined by 17 percentage points to 12 percent as the services sector has increased its share to 59 percent of GDP (Figure 1, panel A). The proportion of the largely non-traded services sector in Sri Lanka is large even by South Asian standards, where the size of the services sector stands out relative to other developing regions of the world. Services-led growth has become more pronounced in recent years putting it closer to the composition of economic growth in OECD countries than other developing countries. Over 60 percent of real GDP growth recorded from 2000 is accounted for by growth in the services sector (Figure 1, panel B).
Sectoral reallocation from agriculture to manufacturing has played an important but less significant role in Sri Lanka’s labor productivity growth than for other South Asia economies.
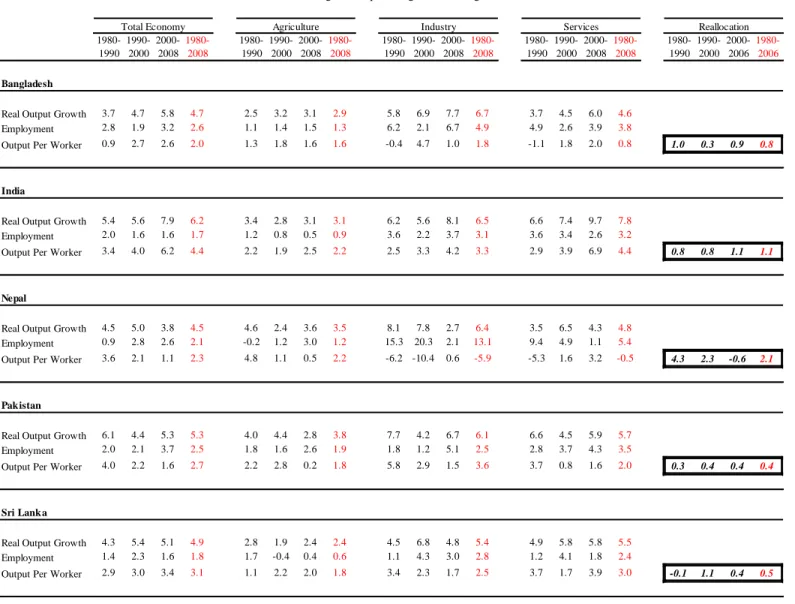
Over the past several decades, Sri Lanka has not benefitted from sectoral resource reallocation to the same degree as its South Asian neighbors. Table 1 provides estimates of economy-wide productivity enhancements from sectoral reallocation based on national accounts data. The contribution of sectoral reallocation to overall growth is given by:
𝑅𝑒𝑠𝑜𝑢𝑟𝑐𝑒 𝑟𝑒𝑎𝑙𝑙𝑜𝑐𝑎𝑡𝑖𝑜𝑛=𝐺𝐷𝑃1980−2008− � 𝑘𝑖,1980∗ 𝐿𝑎𝑏𝑜𝑟𝑃𝑟𝑜𝑑𝑖,1980−2008 𝑖=𝑎,𝑚,𝑠
where 𝐺𝐷𝑃1980−2008 is the annual growth rate of GDP from 1980 to 2008, 𝑘𝑖,1980 is the share of employment in sector i (indexed by agriculture, manufacturing and services) in 1980, and 𝐿𝑎𝑏𝑜𝑟𝑃𝑟𝑜𝑑𝑖,1980−2008 is the average annual growth in labor productivity from 1980 to 2008.
Over this time period, broad sectoral reallocation contributed approximately 15 percent to average annual growth in output per worker in Sri Lanka (0.5/3.1), as compared to 25 percent in India (1.1/4.4), just under 40 percent in Bangladesh, and nearly all of the productivity growth in Nepal.
Figure 2 shows the path of structural change from the early 1980s to 2008 in terms of employment share changes in agriculture, manufacturing and services relative to GDP per capita, for Sri Lanka and for other South Asian and international comparator countries. As illustrated in Panel A, Sri Lanka’s transition out of agriculture has largely kept pace with its level of development. Panels B and C, however, show that while the share of employment in both manufacturing and services has increased, resource changes over this period are larger in the service sector relative to the manufacturing sector. To the extent that Sri Lanka’s employment share patterns may over time become more aligned with average patterns across countries as it continues to develop, this suggests that there is a potential for further strong growth in
8
employment in modern tradable services and non-textile and apparel manufacturing and a need for more increases in TFP across all sectors.
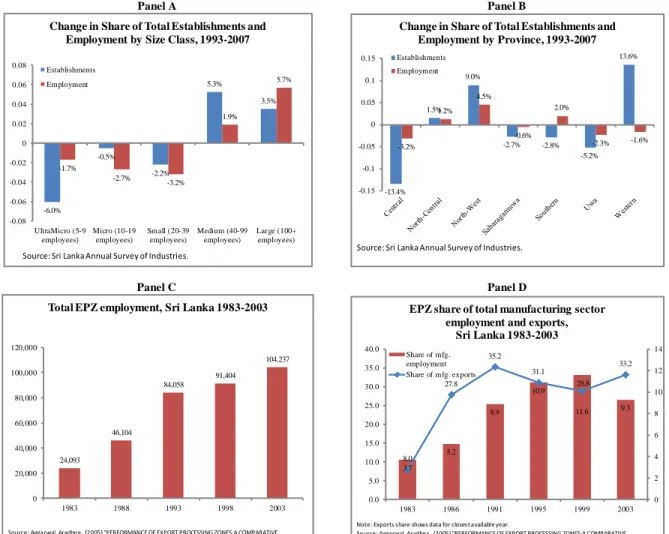
Underlying this cross-sectoral resource reallocation are patterns of enterprise dynamics that include a changing size and regional distribution of firms, and an increase in the number of firms and participation of workers in export processing zones (EPZs). Figure 3, based on manufacturing establishments, highlights: a shift between 1993 and 2007 in the number of establishments and employment shares from smaller firms (less than 40 employees) to medium and large firms (panel A); a shift in the number of establishments and employment shares from Central and Uwa regions to North-Central, North-West and Western regions (panel B); an increase in total employment in EPZs from 24 to over 100 thousand between 1983 and 2003 (panel C); and an increase in employment and export shares from roughly 4 and 8 percent in 1983 to over 9 and 30 percent by 2003.
IV. Empirical Approach for Productivity and Innovation Analyses Subjective and objective indicators affecting performance outcomes
A commonly-used metric to assess the severity of business environment constraints has been the percentage of firms that subjectively report a given constraint as ‘major or severe’ to their business operations. Corruption, electricity and political instability are typically top bottlenecks affecting business operations as reported by enterprise managers across South Asian countries.4 Figure 4, panel A illustrates the ranking of constraints as perceived by manufacturing firms between 2003 and 2010, ranked by top perceived 2010 constraints. Interestingly, while electricity has remained the top subjective constraint (for 42 percent of firms in 2003 and 36 percent in 2010), followed by tax rates (up to 29 from 19 percent), inadequately educated labor (up to 27 from 22 percent), access to financing (up to 25 from 20 percent), and tax administration (up to 22 from 13 percent); political instability is no longer in the top five, falling from 34 to 14 percent of respondents, while corruption fell from 17 to 8 percent of respondents. Figure 4, panel B reports the ranking of constraints as perceived by manufacturing versus service firms in 2010 (no service establishments were sampled in 2003). The largest differences in ranking of ‘major or severe’ constraints between manufacturing and service firms concern electricity (33 percent of manufacturing respondents versus 19 percent of services respondents, a difference of 14 points), access to financing (the most important perceived constraint for manufacturing, 12 percentage points higher than for services firms), inadequately educated labor (again ranked more problematic for manufacturing than services firms), and access to land (the most important perceived constraint for services, 8 points higher than for manufacturing firms). It is difficult to draw actionable policy recommendations from these data, however, as there is a natural tendency for managers to focus on such external-to-the-firm factors rather than possibly more important shortcomings related to a lack of ability to tap global knowledge flows, insufficient in-service
4 These were the top 3 subjective constraints across South Asia region countries, as reported in Dutz, O’Connell and Tan, 2011.
9
training investments, inadequacies in management style, or other productivity-enhancing investments that were not undertaken, or that firm managers may not even have been aware of.
Another concern regarding subjective responses is that firms' perceptions may reflect differences in firm performance -- successful firms may view their business environment as less limiting.
Given these and related shortcomings of subjective indicators, this paper aims to exploit objective business environment indicators to examine and quantify the intensity with which different business environment variables are correlated with productivity and innovation outcomes, rather than rely on subjective perceptions reported by managers. Objective business environment indicators reflect the actual incidence of various factors which potentially constrain business operations. These include metrics such as the share of electricity used that came from generator(s) that the establishment owns or shares, the losses from crime as a share of sales, the share of investment financed externally, the share of sales financed on credit, and internet access.
Hypotheses
Our core hypothesis is that business environment factors are important determinants of variation in productivity and innovation across firms. Productivity and innovation are likely also to be explained by additional firm-specific factors such as managerial education and practices, workforce skills, and local spillovers. We test hypotheses related to each of the following major areas of the business environment in the context of productivity and innovation5: (1) incentives for productive entrepreneurship, including the extent of competition faced by the firm, enterprise regulation and corruption, and crime and security; (2) access to skills; (3) connectivity to global knowledge through trade and other channels; (4) access to finance; and (5) access to quality physical infrastructure. This section reviews findings from the empirical literature relevant to these five major areas to motivate the main hypotheses regarding the association between business environment indicators and productivity and innovation in Sri Lanka.
(1) Incentives for productive entrepreneurship. Whether entrepreneurial talent is allocated to productive entrepreneurship (wealth creation by increasing within-firm TFP through innovation), to unproductive entrepreneurship (wealth diversion via rent seeking), or to destructive entrepreneurship (wealth destruction via criminal or conflict-generation activities) depends on the relative payoffs facing individuals with entrepreneurial talent (Baumol 1990). For rapid, sustainable growth, it appears essential that the prevailing ‘rules of the game’ in the business environment allow transformational entrepreneurs to grow quickly and reap sufficiently generous rewards from innovation without fear of expropriation by public rent-seeking or private crime.
We use the following business environment measures:
• Competition. Gorodnichenko, Svejnar and Terrell (2010) find robust evidence of a positive relationship between foreign competition and innovation using enterprise-level data similar to those employed in this paper. We hypothesize that foreign competitors not only pressure
5 See Trajtenberg (2009). See also Dutz (2007) for a similar broad definition of innovation and description of these four areas that provide key levers for innovation policy in addition to physical infrastructure.
10
local firms to innovate to maintain competitiveness, but also to introduce new ideas, products and business practices which may spill over to local firms via market interactions.
• Extent of government ownership. Ayyagari, Demirguc-Kunt and Maksimovic (2011) examine the effect of government ownership on firm innovation. They find that state ownership (if the state owns 50% or more of the company).
• Enterprise regulations and corruption. Hallward-Driemeier, Khun-Jush and Pritchett (2010) examine the effect of the ‘deals environment’ (the prevailing extent of informal payments, deals, and the impact of uncertainty) on employment growth. To measure the deals environment, they use measures of overall management time with government officials and the size of bribe payments made to ‘get things done’. In our innovation analysis, we proxy for the regulatory environment by including the number of inspections a firm received from the Inland Revenue Department. On a related link between industrial regulation and insufficient product innovation, Goldberg et al. (2010a) argue how the lack of “creative destruction” among multiproduct firms in India over the period 1989-2003 (product churning is substantially lower among Indian than U.S. firms due to the lack of shedding of existing product lines) is due to the legacy of industrial license requirements for establishing and expanding capacity in the manufacturing sector (once the high sunk costs of expanding operations were incurred, firms were reluctant to withdraw established product lines).
• Crime and security. We relate measures of crime and disorder—specifically, the percentage of sales lost due to crime, theft and disorder—to measures of productivity based on the hypothesis that areas with higher levels of crime and conflict may experience lower productivity through a misallocation of either entrepreneurial talent or other resources. In South Asia, conflict- and crime-prone areas also typically have lower infrastructural stocks, higher levels of corruption, worse health outcomes, and a greater incidence of poverty (Ghani 2010, and Ghani and Iyer 2010).
(2) Access to skills.
• Worker training. Studies show that firms' capacity to absorb and benefit from new technology depends on management and worker training (see Bell and Pavitt 1992).
• Education and skills of the top manager/owner. de Mel, McKenzie and Woodruff (2010) show the importance of firm owner characteristics such as ability, motivation and competitive attitudes to risk as a primary drivers of growth, based on a series of surveys of own account workers and owners of enterprises in Sri Lanka. Based on a follow-on representative survey of over 2,800 micro, small and medium privately-owned firms in Sri Lanka in 2008, de Mel, McKenzie and Woodruff (2009) show that owner ability (more educated individuals, higher logical ability), conditioning on firm size and other firm characteristics, has a significant and substantial impact on the likelihood of a firm innovating and higher profitability. We use measures of both education and business training to assess the relationship between education, skills and innovation.
11
(3) Connectivity to global knowledge. A range of activities related to participation in international markets may have beneficial impacts on firm outcomes, especially those related to international buyers/suppliers that bestow knowledge spillovers from commercial interaction (learning by exporting/importing) or firm-specific abilities to access and utilize knowledge flows and best practices via global connectivity through the internet or technology licenses. Sutton (2007) argues that developing economies benefit through the vertical transfer of capabilities from foreign to domestic firms. Gorodnichenko, Svejnar and Terrell (2010) explore whether firms that supply a larger share of sales to MNCs innovate more than firms that sell more to the domestic market, and find that these vertical relationships induce innovation by domestic firms. As part of exploring the range of vertical capability transfers between domestic and foreign firms, they also simultaneously include export and import indicator variables, as well as market competition indicator variables. We relate the following knowledge-related indicators to outcomes:
• Access to knowledge and learning through trade: Firms can acquire more advanced technologies and learning capabilities by exporting to technologically more advanced markets and engaging with customers in those markets, with foreign buyers often providing their local subcontractors with technology, capital equipment and training so that the latter can produce to higher specifications and standards. While the traditional evidence has been inconclusive (see Wagner 2007 for a review of the literature on exports and TFP), Kraay (2006) finds evidence that past export experience helps explain current TFP for Chinese firms, and Lederman (2009) finds that a firm's export status is positively correlated with the probability of innovating. For India based on plant-level data for over 20,000 firms over 1989-2008, Mukim (2010) finds that exporting improves firm performance, though Tabrizy and Trofimenko (2010) do not (they find that self-selection of more productive firms into exporting explains the productivity differential between exporters and non-exporters).
Cheaper intermediate and capital goods imports, on the other hand, may allow firms to produce existing goods using the same inputs as before, but at lower cost. They could also open up new ways of producing existing goods, and even allow entirely new goods to be made. Acharya and Keller (2009) estimate that the contribution of international technology transfer to TFP growth exceeds that of domestic R&D and that imports are a major channel for these spillovers. Topalova and Khandelwal (2011) show a causal link between increases in the number and volume of imported inputs from abroad and increases in TFP in India, while Goldberg et al. (2010b) link access to new imported inputs and new products introduced by domestic firms in India.
• Access to knowledge through other channels
o internet use: firms can acquire disembodied external knowledge flows from open source information such as scientific, technical and industrial journals, informal contacts and communications through networks of specialists, trade and industry associations, and other knowledge flows accessible through the internet, via e-mail or website use.
12
(4) Access to finance. Ayyagari, Demirguc-Kunt and Maskimovic (2008) explore whether financial development promotes growth by fostering innovation and thus increasing efficiency, with such an effect occurring if the financial system has an important role in supplying capital to firms that are innovating. Ayyagari, Demirguc-Kunt and Maksimovic (2010) explore the role of corruption and tax evasion on innovating firms and firms that use external finance. In a similar vein, Aterido, Hallward-Driemeier and Pages (20119) examine the impact of access to finance, business regulation, corruption and infrastructure on employment growth. With this literature as motivation, we test whether the following measures are associated with firm performance:
• Sources of financing for new investments. Fernandes and Pakes (2008) find that firms with higher TFP are more likely to receive loans, suggesting that loan-granting institutions are able to select out the more productive firms; and that states in which a disproportionate number of firms received loans are the states with less underutilization of both labor and capital.
(5) Access to quality physical infrastructure. Calderon and Serven (2004), using an infrastructure-augmented growth regression (including as non-infrastructure growth determinants indicators of trade openness, government burden, inflation and real exchange rate overvaluation, plus indicators of human capital and financial depth), show that growth is positively affected by the stock of infrastructure assets, where their aggregate index of infrastructure stocks includes data from telecoms (the number of main telephone lines per 1,000 workers, also augmented by mobile phones), power (the electricity generating capacity of the economy in MW per 1,000 workers), and transport (the length of the road network in km per sq km of land area, also augmented by the railroad length), based on panel data of over 100 countries spanning 1960- 2000.
• Electricity. Aterido, Hallward-Driemeier and Pages (2011) examine the incidence of power outages on firm outcomes, finding that poor infrastructure has a detrimental effect on the growth of all firms but the micro ones. Fernandes and Pakes (2008) find that firms which suffer more production losses due to electricity outages have lower TFP and underutilize both labor and capital.
It is important to note that this study deals entirely with constraints to productivity and innovation faced by existing establishments. We identify which aspects of the business environment are most important and potentially impactful in improving productivity and innovation within incumbent firms. We unfortunately cannot examine the constraints to increasing the prevalence of high-productivity entrants, which may have an even greater overall disruptive transformational growth potential than existing incumbent firms – as we do not observe those firms that could have entered but were prevented from doing so by prevailing constraints in the business environment. Thus, our analysis does not, and cannot, account for the productivity effects of increased industrial dynamism though entry and exit per se.
13 V. Cluster-level Productivity Analysis Data sources
The Sri Lanka manufacturing sector data were provided by the National Statistics Office (NSO) in summary format by industry, firm size and provincial location.6 We use data based on the 2004 Census of Industry, a comprehensive nationwide establishment census which collected data for fiscal year 2003. The data are aggregated by two-digit ISIC code, establishment size (5-9, 10- 19, 20-39, 40-99, 100+ workers) and nine provinces.7 Data include counts of total employment, number of employees by gender as well as total output, total raw materials consumed (value added is defined as output minus raw materials), and a compensation bill. All currency accounts have been converted to 2005 USD at purchasing-power-parity.
We match these data to indicators constructed from the 2004 World Bank Enterprise Survey (WBES) dataset, which also covers data from fiscal year 2003. This survey collected detailed data on manufacturing establishment operations and constraints to business and investment for the first time in Sri Lanka. The dataset is comprised of 452 establishments stratified by province and industry.8
We construct indicators of the business environment based on averages of objective indicators in given industrial ‘clusters’ (defined as firms in a given province, grouping of industries at the 2- digit level, and establishment size class). To ensure an adequate number of establishments in each cluster, we drop one dimension of the cell when there are fewer than five establishments in any given cluster until an adequate underlying number of establishments is reached (that is, we first substitute with location-size clusters, then industry-size to ensure that we have at least our cutoff of five or more establishments per cluster).9
6 Due to confidentiality restrictions, establishment-level data were not able to be procured through the NSO.
7 The Census of Industry surveyed all plants, although those with 1-4 workers were not included in the dataset. The analysis excludes utilities, mining and quarrying, and a few other industries which, due to the methodology of data collection were available but are commonly thought of as outside the manufacturing sector. To protect the confidentiality of survey respondents, the Department of Census and Statistics have top-coded employment size categories for certain sectors with few very large firms (into an “other” category) to prevent them from being identified in the cell data. This necessitated aggregation of cells in the 100-499 and 500+ size categories into one single 100+ size category. We focus on seven provinces since Northern and Eastern provinces have been omitted due to civil unrest causing questions of data reliability and consistency. Specifically, conflict in these areas precluded the collection of surveys in 1993 and 1998, so we excluded them from all years to maintain a consistent sample.
8The sample size for the 2004 WBES in Table 3 reflects the estimation sample used in the firm-level TFP analysis presented in Section VI. The cluster level indicators, however, are based on the full sample of 452 surveyed establishments.
9 A similar approach has been used, among others, by Aterido et al. (2011). While in principle there could be up to 490 possible location-industry-size clusters (14 2-digit industries x 7 provinces x 5 size classes), in practice given available data we are able to construct 322 location-industry-size clusters.
14
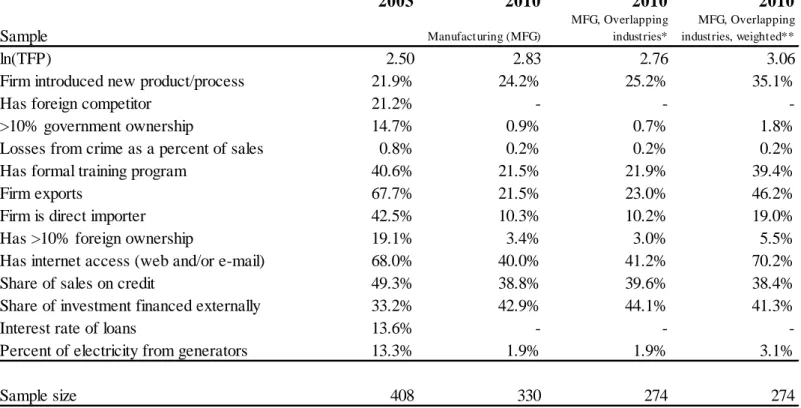
Summary statistics of business environment indicators at the establishment level for 2003 are presented in the first column of Table 3.10 Of all sampled establishments, roughly 15 percent have at least 10 percent government ownership, 68 percent participate in export markets, 68 percent have and use internet, 41 percent have a formal training program, while only 21 percent report facing a foreign competitor. The mean interest rate on loans is around 14 percent, with an average share of investment financed externally of 33 percent. The average rate of losses from crime is low, under 1 percent of sales, and the mean share of electricity sourced from private generators is around 13 percent. In addition to these WBES indicators, the outcome variables based on the Census data are the log of output per worker (its mean across clusters is 9.22, or
$10,071) and the log of value added per worker (its mean across clusters is 8.45, or $4,687).
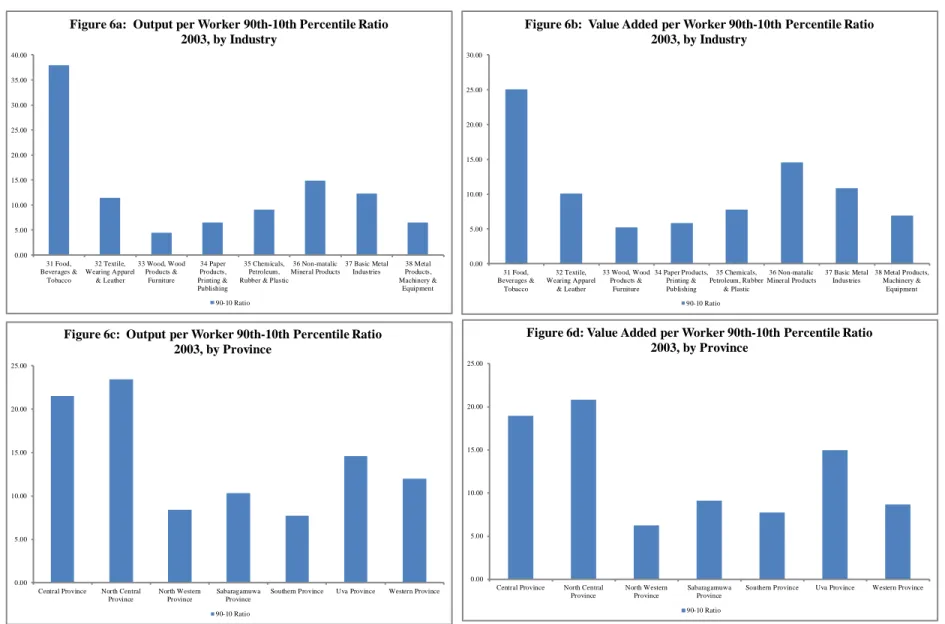
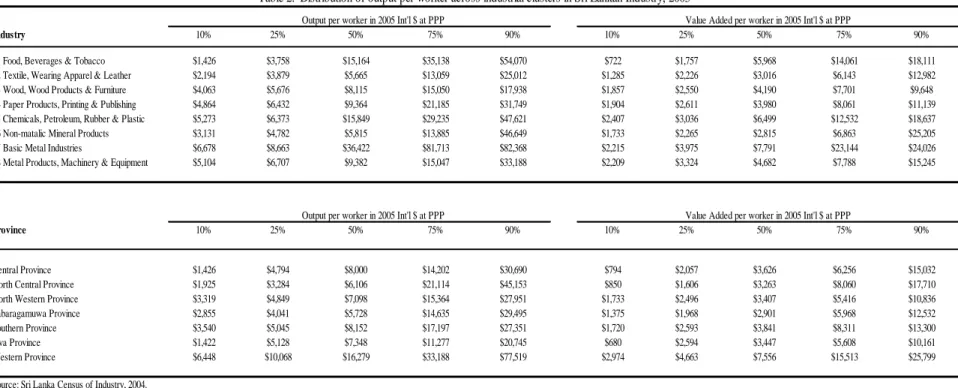
Figure 5 presents evidence of large labor productivity heterogeneity across industrial clusters.
Although it would be desirable to explore these dispersions based on establishment-level data at the most disaggregated product level while controlling for differences in quality and market power, the results are nonetheless suggestive. Across industrial clusters, the 90th percentile in output per worker is, on average, ten times that of the 10th percentile. The industrial sectors with the greatest dispersion in productivity are food/beverages/tobacco and non-metallic mineral products. Dispersion across locations is as prominent if not more so—with an average ratio of output per worker for the 90th relative to the 10th percentiles greater than 20 in the North Central and Central provinces. These numbers are likely an understatement of the actual firm-level dispersion in productivity, given that they are based on averages across firms within a given location, sector and size group. In principle, large dispersions in productivity for the same product highlight the enormous potential for catch-up productivity upgrading or exit by the less productive firms.
Methodology and empirical model
The empirical specification to estimate the effects of business environment on productivity is given by:
ln(𝑋/𝐿)𝑖,𝑗,𝑘 =𝛽𝐴𝑖,𝑗,𝑘+𝛽𝑍𝑖,𝑗,𝑘+𝜀𝑖,𝑗,𝑘 (1)
where ln(𝑋/𝐿)𝑖,𝑗,𝑘is a generic productivity measure (in this case, output per worker) for an industrial cluster of firms in province i, sector j, of size class k. A is a vector of industry and location fixed effects to control for unobservable heterogeneity across clusters that varies by industry (due to, among others, different levels of technology and relative capital/labor intensity) or location (differential access to international markets, interaction density/information in cities, or location relative to conflict areas). 𝜀𝑖,𝑗,𝑘 is a randomly distributed disturbance term.11
10 The indicators listed in Table 3, except for foreign ownership and share of sales on credit, are used to construct the cluster averages that are then matched into the 2003 Census data.
11 We note that several existing studies argue for the exogeneity of cluster averages (as constructed) to firm-level outcomes such as employment growth or productivity. We expect this is also, if not more, the case when relating
15
This approach is based on an extensive literature studying the correlation between the business environment and development outcomes. Most recently, Gennaioli et al. (2011) use business environment averages to explain sub-national variation in per capita income levels worldwide.
Their study encompasses areas constituting more than 90% of global GDP and population, finding that the business environment is an important correlate of per capita incomes. Two productivity measures comprise our core analysis using the above specification estimated by OLS: output and value added per worker.
Does the business environment explain productivity differences across clusters of firms?
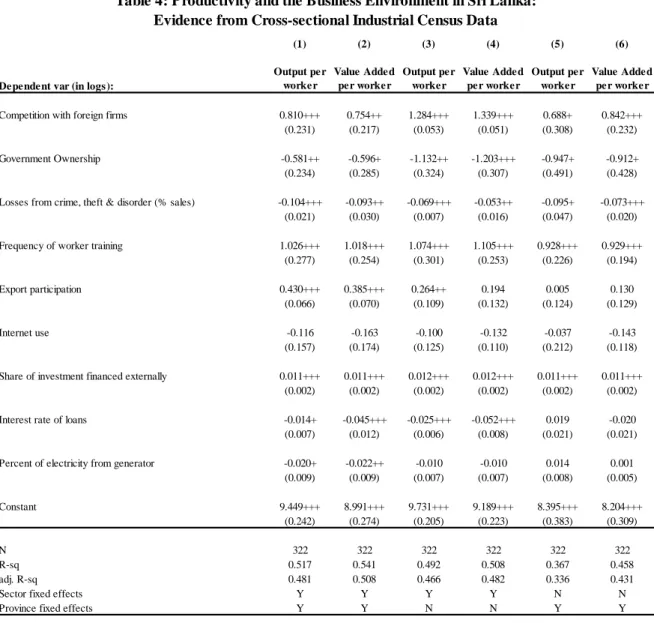
Table 4 reports the estimations from the cluster specification (equation 1). Columns 1 and 2 report the main specification for our two measures of productivity. Columns 3-6 repeat the main specifications, showing robustness of results based on exclusion of fixed-effect vectors (dropping regional and sectoral fixed effects, respectively).
We find evidence supporting many of our hypotheses regarding the relationship between the business environment and productivity. In particular, we find a strong association between productivity and access to international markets: we estimate that output per worker in a hypothetical cluster with all firms participating in export markets is 50 percent higher than in a cluster with no such exposure. We regard this as evidence of the importance of connectivity to global knowledge flows and potential spillover effects from interaction with foreign firms.
Regarding incentives for productive entrepreneurship, competition with foreign firms in local markets is strongly correlated with higher productivity: those clusters reporting benefiting from higher levels of competition with foreign firms have significantly higher productivity. This effect may be driven by both a ‘pull’ factor—where firms find it easier to adopt closer-to-frontier technologies and practices learned from competitors—and a ‘push’ factor whereby firms with foreign competitors face pressure to innovate in order to remain competitive in local markets.
Our results reflect within-cluster spillover effects of exporting and foreign competition on local firms. We also find productivity to be lower in clusters with a higher proportion of establishments with public ownership. Clusters with 100 percent government ownership would have 44% lower output per worker than a cluster with 0 percent public ownership, all else equal.
Measures of crime and conflict drastically cut into industrial performance: for each one percent of lost sales due to crime, theft and/or disorder, firms can expect to experience nearly a ten percent loss in productivity. We presume that this quantitatively large result reflects the effects of crime and conflict both on local populations (whom firms depend on as buyers) and on the deterioration or destruction of local infrastructure typically seen in conflict-affected areas.
Regarding access to skills, clusters with higher rates of employee training show the highest estimated potential gain in productivity. We posit that the large coefficient on worker training may be due to local labor markets amplifying spillover effects: worker training and skills such business environment averages from a representative survey to industrial metrics based on a comprehensive and separate data collection instrument. See Aterido et al (2011).
16
upgrading, even if conducted only at some firms within a cluster, may bestow particularly strong positive externalities on the group of firms within which workers may be able to move more easily (that is, among firms of the same size in the same location and industry). Our estimates indicate that output per worker would be almost three times higher (that is, 275 percent of current levels) in a cluster in which all firms train workers, as opposed to an otherwise similar unit which does not train workers.12
Regarding access to finance, local cost and access correlate strongly with productivity. We find that higher interest rates (cost) are associated with lower output and value added per worker, while the ability to finance investments with external funds (access) gives a significant boost to productivity—for every additional percent of investment financed outside the firm, firms can expect, on average, a one percent increase in output and value added per worker.
Finally, regarding access to quality physical infrastructure, our proxy for availability of reliable electricity supply through the grid has a weak but important correlation with industrial productivity: firms which supply power themselves more intensively can be expected to lose one percent in productivity for each additional percent increase in power supplied by generators, relative to firms that have access to the more cost-effective power from the grid.
Which factors matter most and what are the potential gains from relaxation of business environment constraints?
Estimated semi-elasticities between productivity and indicators of the business environment do not give the complete picture as to which constraints are most binding. Incorporating the incidence of a given constraint —in the form of its distance from a frontier— is necessary to distinguish which constraints are most binding to firms. For example, although worker training may have the highest estimated elasticity, it may be the case that most firms already train their workers and thus policymakers would have little to gain in spending scarce public resources on worker training programs. On the other hand, to the extent that most firms supply a large portion of their electricity themselves and do not benefit from more cost-effective grid access, there could be substantial benefit from bridging this gap via policy aimed at relaxing infrastructure constraints.
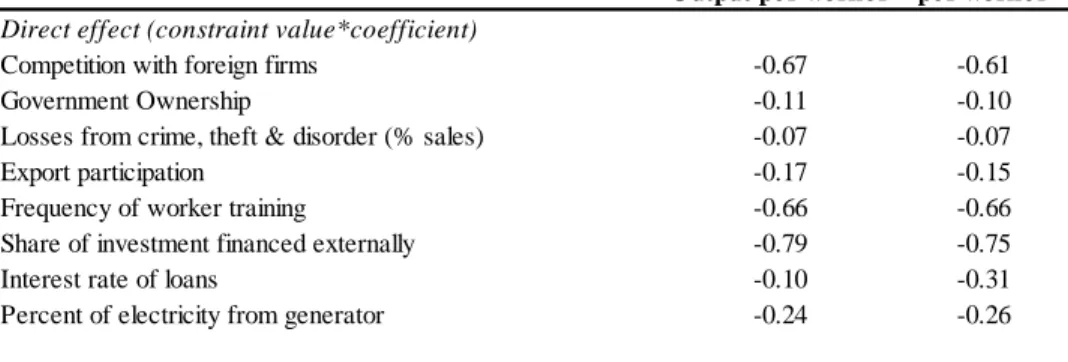
Table 5 reports the average constraint imposed by the business environment, for those indicators statistically significantly different from zero in the cluster analysis. This is calculated as the mean across clusters of the estimated coefficient (semi-elasticity) times the value of the indicator, when indicators are re-defined relative to levels at which they are no longer binding.13
12 The estimated semi-elasticities of worker training with output per worker or value added per worker are 1.026 and 1.018, respectively. These imply 178 and 176 percent increase in the productivity measure, given by exp(1.026)-1 and exp(1.018)-1, respectively.
13 Specifically, ‘full relaxation’ of constraints is a situation in which the business environment indicators are at a level where firm productivity is no longer adversely affected. For example, this ‘non-binding’ value for ‘share of electricity from generators’ is zero and would reflect the situation where firms were able to rely fully on the electrical grid and not suffer the productivity losses from power outages (whether unpredictable or otherwise). For
17
Comparing magnitudes of the average constraint imposed by the various business environment indicators within column 1 of Table 5, we find that these patterns of relative constraint importance broadly follow the estimated semi-elasticities, although there is a large increase in the prominence of interest rates, financing and infrastructure (generators), relative to the estimated semi-elasticities reported in column 1 of Table 4, once we take account of the incidence of the constraints. The top constraints to output per worker, across all Sri Lanka’s industrial clusters, are access to finance, insufficient competition pressure, and access to skills.
This pattern holds as well for value added per worker.
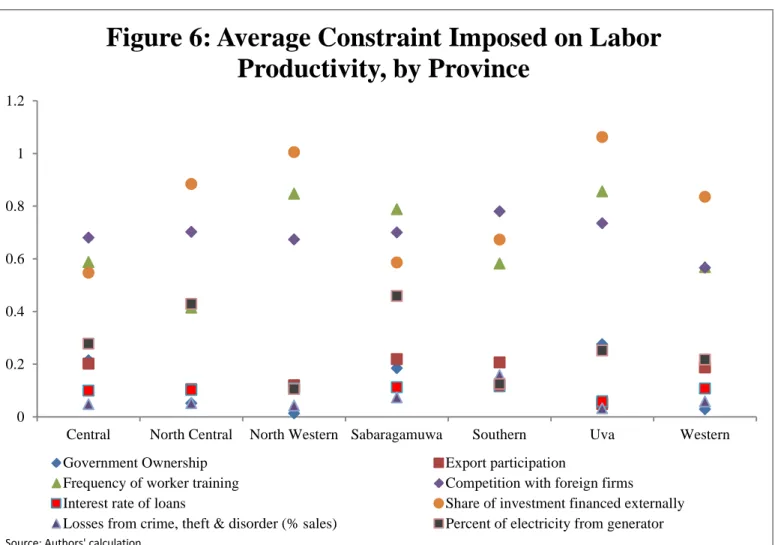
Figure 6 presents this analysis graphically by province. While lack of access to finance is typically found among the top constraints across all regions, it is outweighed by insufficient foreign competition in the Central, Sabaragamuwa and Southern provinces, and by access to skills in the Central and Sabaragamuwa provinces. Similarly, electricity/infrastructure constraints are particularly high in the North Central and Sabaragamuwa provinces. This highlights the heterogeneity in business environment constraints and their incidence across regions that may require different responses by local policymakers and officials.
The calculated impacts are next applied to estimate a potential productivity gains frontier if the parametric constraints were fully relaxed, quantifying what productivity could be in Sri Lanka’s industrial clusters if specific constraints to productivity were removed. The frontier estimation assumes that constraints are independent of each other; i.e., a relaxation of constraint A does not affect the gains from a relaxation of constraint B.14 The frontier for a given cluster (subscripts have been dropped for presentational purposes) is calculated as:
Frontier1 = ln(Prod) + ln (�(−𝑒𝑋𝑖∗𝛽�𝚤−1)
𝑘 𝑖=1
) (2)
where ln(Prod) is the reported productivity of the cluster, i indexes the significant constraints from (2), Xi is constraint i, and 𝛽�𝚤 is the estimated coefficient. Since we estimate semi-elasticities, the exponentiation (minus unity) is required to calculate the individual constraint’s effect on productivity. This is then summed across individual constraints and put into log form to be added to the reported productivity, yielding the productivity frontier.
an indicator whose non-binding value is not zero (for example, 0.5 on a 0-1 scale) we redefine the variable relative to the non-binding value [can we be clearer, how is it redefined?] and switch the sign of the variable as necessary to ensure that a positive change in the variable has a negative effect on the outcome.
14 An alternate frontier estimation approach involves a stronger (and potentially less plausible) assumption that relaxation of constraints benefit each other. Since variables are in logs, this is straightforward to do. This alternate frontier is calculated by:
Frontier2= ln(Prod)− �(𝑋𝑖∗ 𝛽�𝚤)
𝑘
(Note that since the estimated coefficients are all negative by construction, the second term is also negative.) 𝑖=1
18
Figure 7 highlights that significant gains in productivity are achievable if full relaxation of business environment constraints were possible. The gains in productivity are calculated based on existing resource inputs and technology. We calculate that these potential levels of output could alternatively be achieved in 15 to 20 years if the economy grew at eight percent per annum from its current levels of output and value added. Our productivity frontier analysis therefore implies, under the assumption of a smooth transition in policies and constant inputs and technology, that policies which incrementally relax business environment constraints over a period of 15 to 20 years could be expected to induce eight percent growth in manufacturing output and value added per annum (Table 6).
VI. Firm-level TFP Analysis Data sources
A 2011 World Bank Enterprise Survey (WBES), covering data from fiscal year 2010, was conducted as a follow-up to the original 2004 WBES (which covered fiscal year 2003). For comparability across both years, and to allow calculation of TFP based on reliable capital asset estimates, we restrict our focus here to manufacturing establishments (the 2003 sample consisted exclusively of manufacturing establishments). The 2010 manufacturing subset of the survey is comprised of 330 establishments.
Summary statistics of the 2010 manufacturing data, and the comparable 2003 data, are presented in the second through fourth columns of Table 3. The second column presents means based on all available manufacturing establishments included in the 2010 sample. There are stark differences between these 330 establishments and the 408 establishments sampled in 2003:15 only 3 percent of the 2010 establishments have more than 10% foreign ownership, while 19 percent of the 2003 establishments had this level of foreign ownership; conversely, less than 22 percent of 2010 establishments export while 68 percent of 2003 establishments exported. These differences are no doubt related to underlying differences in establishment characteristics: while the 2003 sample contained mainly larger firms with only 6 percent of establishments being micro-sized (10 employees or less), 41 percent of manufacturing establishments in 2010 are micro-sized. And while 20 percent of 2003 establishments were in the textiles sector, only 3 percent of 2010 establishments are in textiles. So differences in sample industry and size distributions, among others, account for differences in business environment indicators. While we control for these differences in the regressions with industry, size and location fixed effects, we report, in columns 3 and 4 of Table 3, how the business environment indicator means would change if the 2010 sample were more similar to the 2003 sample – by respectively restricting the sample to overlapping industries, and then also weighting the means by the 2003 sample size distribution.
15 For the firm-level TFP analysis, the 2004 WBES sample is reduced from 452 to 408 surveyed establishments due to missing information on output (sales). All summary statistics reflect this sample adjustment.
19 Methodology and empirical model
We begin by estimating a production function of the form:
log𝑌𝑖 =𝛼𝐿𝑙𝑜𝑔𝐿𝑖 +𝛼𝐾𝑙𝑜𝑔𝐾𝑖 +𝛼𝑀𝑙𝑜𝑔𝑀𝑖 +𝑙𝑜𝑔𝑇𝐹𝑃𝑖 (3) where Y is a measure of output (as measured by sales), L is employment expenditure, M is raw material expenditure, K is capital expenditure, and TFP is the residual productivity measure. We structure the productivity residual to be of the form:
𝑙𝑜𝑔𝑇𝐹𝑃𝑖 =𝛼+𝛼𝐼𝐶′ 𝐼𝐶𝑖+𝛼𝐶′𝐶𝑖 +𝛼𝐷′ 𝐷𝑖+𝑤+𝜀 (4) where Ci is a set of firm characteristic control variables, Di is a set of observable fixed effects (location, industry, size, age), w is a measure of market power (proxied by the number of competitors reported by the firm), ICi is a set of business environment variables, plus a constant and an error term. The full structural equation is of the form:
log𝑌𝑖 = 𝛼+𝛼′𝐿𝑙𝑜𝑔𝐿𝑖 +𝛼′𝐾𝑙𝑜𝑔𝐾𝑖 +𝛼′𝑀𝑙𝑜𝑔𝑀𝑖+𝛼′𝐼𝐶𝑖 +𝛼𝐶′𝐶𝑖 +𝛼𝐷′ 𝐷𝑖 +𝑤+𝜀 (5) with a vector of business environment (IC) variables included and having a direct effect on productivity.16
One methodological issue addressed in estimating the impact of the business environment variables on firm performance concerns spillovers. In addition to exploring the correlation of business environment variables and TFP, we run an additional set of regressions to explore the possibility that, in addition to the own-effects, the mean of business environment variables across other firms in the same peer group (in the same “cell” or year, industry and size group) are correlated with the firm’s level of TFP. These cell means (excluding the own-firm’s value) allow the importance of spillovers from other peer firms to be captured, for those variables where spillovers are most likely based on relevant theoretical models (knowledge-intensive variables such as whether firms train their workers, whether firms benefit from foreign ownership, whether they have access to internet services, whether they export and directly import intermediates, or whether they introduce new products).
We employ the Olley-Pakes (1996) decomposition of TFP to answer the question of whether markets are working more or less efficiently over time. Aggregate TFP is calculated as the share- weighted average TFP, given by:
Aggregate TFP =∑𝑛𝑖=1(𝑇𝐹𝑃𝑖∗ 𝑠𝑖) (6) Allocative efficiency =∑𝑛𝑖=1(𝑇𝐹𝑃𝑖∗ 𝑠𝑖)−1𝑛∑𝑛𝑖=1(𝑇𝐹𝑃𝑖) (7)
16 This single measure of productivity yields consistent results with other measures restricting and unrestricting cost shares by industry, and translog specifications. See Escribano et al. (2009).
20
where 𝑇𝐹𝑃𝑖 is the same as that in Equation (3) and 𝑠𝑖 is the share of output for firm i in the reference group. This can be decomposed into average technical TFP, which is the simple average technical TFP across firms in the reference group, and an allocative efficiency component which is the difference between aggregate and average technical TFP. The allocative efficiency component measures the covariance between output shares and productivity. This measure indicates whether the more productive higher TFP firms have higher sales shares (if the allocative component is positive) and are expanding over time (if the allocative component increases over time).
Does the business environment explain TFP differences across firms – and how important are changes in allocative efficiency in changes in overall TFP?
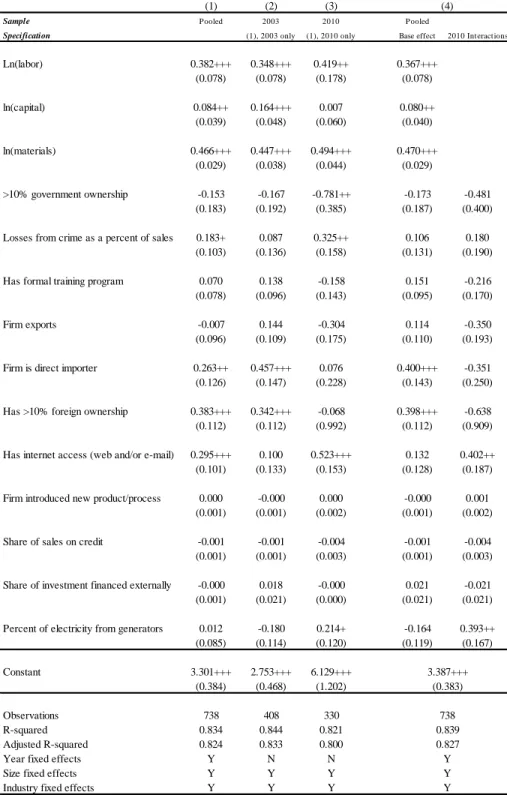
Table 7 reports the estimations for the full structural equation (5). Column 1 reports our main specification where enterprises are pooled together across years. Columns 2 and 3 report sub- samples for 2003 and 2010, respectively. And column 4 reports the pooled data with fully interacted effects for 2010, allowing a more efficient estimation of 2003 and 2010 effects.
The most significant effect across the pooled data and for 2010 is the importance for TFP of connectivity to global knowledge as reflected by access to the internet: the effect is highly significant in the pooled regression, in the 2010 estimation, and in the fully interacted pooled regression for 2010 (columns 1, 3 and 4). The only other business environment variable that is significantly associated with TFP in 2010 is the introduction of new products, highlighting an important direct link between new product innovation and TFP (columns 3 and 4).
The additional business environment variables that are significantly correlated with TFP for 2003 are connectivity to global knowledge as reflected in foreign ownership and direct importation, with both variables statistically significant at the 1 percent level of significance in the pooled regression, in the 2003 estimation, and in the fully interacted pooled regression for 2003 (columns 1, 2 and 4).
Table 8 reports the estimation for the full structural equation (5) complemented by spillover effects from cell averages for relevant business environment variables. The most significant effect across the pooled data and for 2010 is again the importance for TFP of connectivity to global knowledge as reflected by access to the internet: the effect is highly significant in the pooled regression, in the 2010 estimation, and in the fully interacted pooled regression for 2010 (columns 1, 3 and 4). There is no spillover effect from peer firms’ use of the internet. The only other business environment variable that is again significantly associated with TFP in 2010 is the introduction of new products, highlighting an important direct link between new product innovation and TFP (columns 3 and 4). However, there is here an additional positive spillover from peer firms that introduce new products: the inclusion of cell averages both increases the significance of the own-effect in the pooled interactive effect for 2010 (from 5 to 1 percent level of significance) as well as having an additional significant spillover effect in the pooled regression and in the 2010 estimation (columns 1 and 3).