Policy Research Working Paper 6192
Sri Lanka
From Peace Dividend to Sustained Growth Acceleration
Daminda Fonseka Brian Pinto Mona Prasad Francis Rowe
The World Bank
Poverty Reduction and Economic Management Network Policies and International Partnerships Unit
&
South Asia Region
Poverty Reduction and Economic Management Unit September 2012
WPS6192
Public Disclosure AuthorizedPublic Disclosure AuthorizedPublic Disclosure AuthorizedPublic Disclosure Authorized
Produced by the Research Support Team
Abstract
The Policy Research Working Paper Series disseminates the findings of work in progress to encourage the exchange of ideas about development issues. An objective of the series is to get the findings out quickly, even if the presentations are less than fully polished. The papers carry the names of the authors and should be cited accordingly. The findings, interpretations, and conclusions expressed in this paper are entirely those of the authors. They do not necessarily represent the views of the International Bank for Reconstruction and Development/World Bank and its affiliated organizations, or those of the Executive Directors of the World Bank or the governments they represent.
Policy Research Working Paper 6192
Following the cessation of hostilities in May 2009, the Government of Sri Lanka has announced a suitably ambitious macroeconomic vision to capitalize on the peace dividend. Its goals include growing at 8 percent or more per year and lowering government indebtedness from around 80 to 60 percent of GDP by 2015. This paper’s main finding is that while some post-conflict bounce is only to be expected, sustaining high growth presents significant challenges. A substantial rise in the national investment and savings rates will be needed to
This paper is a product of the Policies and International Partnerships Unit, Poverty Reduction and Economic Management Network; and Poverty Reduction and Economic Management Unit, South Asia Region. It is part of a larger effort by the World Bank to provide open access to its research and make a contribution to development policy discussions around the world. Policy Research Working Papers are also posted on the Web at http://econ.worldbank.org. The authors may be contacted at dfonseka@worldbank.org or bpinto2@worldbank.org or mprasad@worldbank.org or frowe@worldbank.org.
sustain growth rates of 8 percent even when accompanied by a significant rise in total factor productivity growth.
With the government’s balance sheet constrained by its desire to lower public indebtedness, private investment will need to become the engine of growth. This places high priority on better infrastructure, clear signals about the relative roles of the public and private sectors, and hard budget constraints and competition both to strengthen the investment climate and spur technological upgrading in pursuit of faster productivity growth.
Sri Lanka: From Peace Dividend to Sustained Growth Acceleration
Daminda Fonseka, Brian Pinto, Mona Prasad and Francis Rowe1
JEL Classification: E60, E62, E65, O40, O53
Keywords: Peace dividend, long-run growth, national savings, total factor productivity, government debt dynamics, hard budgets, competition
EPOL
1 The authors are all at the World Bank. This paper is the result of a joint effort between the South Asia Region (SAR) and the Poverty Reduction and Economic Management (PREM) Anchor of the World Bank and is part of a broader effort in SAR to understand the drivers of economic growth in Sri Lanka. We thank Constantino Hevia and Norman Loayza for helpful inputs and comments. The paper has benefited from helpful discussion at a series of seminars in Sri Lanka during March 2012, including at Colombo, Eastern and Peradeniya Universities, the Institute for Policy Studies and the Ceylon Chamber of Commerce. The views herein are entirely those of the authors. They do not necessarily represent the views of the
International Bank for Reconstruction and Development/World Bank and its affiliated organizations, or those of the Executive Directors of the World Bank or the governments they represent.
2 I. INTRODUCTION
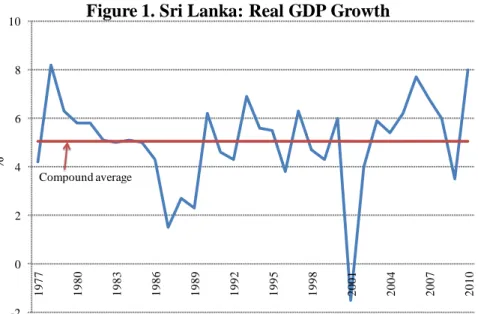
The cessation of hostilities in May 2009 presents an historic opportunity for Sri Lanka to embark on an economic trajectory filled with new and abundant promise for all its citizens. In this paper, we define policy priorities designed to convert the momentum from Sri Lanka‘s peace dividend into a sustained growth acceleration. By a ―sustained growth acceleration‖ we mean growing at rates substantially higher than the historical average of 5.0 percent (see Figure 1) for a prolonged period of time. Indeed, the centerpiece of the government‘s economic vision is
attaining and maintaining a medium-run target of 8 percent growth or more.2
The economic growth literature distinguishes between growth accelerations that are sustained and those that are unsustainable (Hausmann, Pritchett and Rodrik 2005). Sustained growth accelerations are associated with fundamental economic reform, while unsustainable growth accelerations are associated with positive external shocks and financial sector liberalization. Nevertheless, both types of growth accelerations are driven largely by
2 In fact, real GDP growth touched 8 percent in 2010 compared to an average of 5 percent over the previous 10 years 2000-09; but this was in part because of a rebound from the effects of the global financial crisis.
Similarly, while growth in 2011 is estimated at a little over 8 percent, the compound average growth rate over the three years 2009-11 is around 6.5 percent.
-2 0 2 4 6 8 10
1977 1980 1983 1986 1989 1992 1995 1998 2001 2004 2007 2010
Figure 1. Sri Lanka: Real GDP Growth
Source: Central Bank of Sri Lanka (CBSL)
%
Compound average
3
idiosyncratic, and many times, country specific causes. Moreover, growth accelerations are more likely for poorer countries, i.e. convergence forces come into play. Perhaps the most encouraging finding is that growth accelerations are fairly common.
Section II sets out three channels for the peace dividend: reintegration of conflict-affected areas; macro-fiscal; and microeconomic. While the three channels will interact with and
complement each other, our assessment is that the first two are more likely to contribute to a one- time positive shift in output levels than a sustained increase in the growth rate. The
microeconomic channel and the private sector are likely to be the most powerful at the margin in delivering a sustained growth acceleration via an increase in total factor productivity (TFP) growth. There are two reasons for this: first, the government‘s balance sheet is highly constrained by its high indebtedness and its desire to reduce this. Second, experience from countries as diverse as India, Kenya and Poland indicate that profit-maximizing firms operating in an atmosphere of competition, hard budget constraints and competitive real exchange rates offer the best hope for upgrading technology and efficiency in pursuit of faster productivity growth.
Import competition has been a particularly important spur.
Section III explores the government‘s debt dynamics systematically—not simply because the government wants to reduce its indebtedness but because a sustainable fiscal position is a necessary underpinning for fast, long run growth.3 We show that the impressive reduction in the government‘s debt-to-GDP ratio between 2002 and 2010 was driven in important part by the inflation tax on debt, helped by a pick-up in growth. In view of the low inflation target, reducing indebtedness further must rely much more on sustained and even faster growth.
Section IV presents results from a growth simulation exercise asking what level of national savings is needed for meeting the government‘s growth target. The results show that a
3Sustainable debt dynamics and moderate indebtedness reduce macroeconomic uncertainty, lower the chances of crowding out and create fiscal space both for key public investments as well as allowing countercyclical fiscal policy.
4
substantial rise in national savings will be needed to deliver 8 percent growth. This will be made easier by increasing government savings and creating conditions for a big increase in productivity growth. The private sector will need to play a key role in the latter and this brings us to section V on the microeconomic foundations of growth. Section VI concludes with a summary of policy priorities.
The results in this paper are derived from a combination of the Government of Sri Lanka‘s (GoSL) macro-fiscal vision, cross-country experience from fast-growing economies and economic theory. GoSL‘s key macro-fiscal targets are as follows:4
Double per capita income from US $2000 in 2009 to US $4000 by 2016
Reduce government debt-to-GDP from 81 percent in 2010 to 60 percent in 2015
Raise government savings from minus 2-3 percent of GDP to plus 1.5 percent
Aim for inflation based on GDP deflator of 6 percent per year
Target growth at 8 percent per year over the medium run.
II. CAPITALIZING ON THE PEACE DIVIDEND
In principle, the peace dividend for Sri Lanka would flow through the following channels:
Reintegration channel: The reintegration of the war-torn North and East into the economy would fuel a natural expansion of output.
Macro-fiscal channel: This would exert positive benefits through two sub-channels. First, real interest rates on government borrowing would tend to decline along with sovereign risk premia (see Figure 2) while the currency would tend to appreciate as capital flowed in to take advantage of ‗undervalued‘ Sri Lankan assets, financial and real. As a result, the
4Source: Roadmap, Central Bank of Sri Lanka
5
government‘s debt dynamics would improve. Second, the government would be able to reduce security-related spending and increase development spending.
Microeconomic channel: Longer business horizons and the falling cost of capital for the private sector facilitated by growing political stability and fiscal consolidation would strengthen the microeconomic foundations for growth. Rising confidence would make Sri Lanka a more attractive destination for FDI, prompt foreign buyers to source more of their purchases from Sri Lanka and push established domestic businesses to explore diversification into new areas. The net result would be an increase in investment and faster growth.
The strength of the reintegration channel would depend upon how important the North and East were in income generation prior to the conflict and how quickly economic activity there can pick up. Prior to the onset of the war in 1983 the North and East Provinces accounted for a small share of national output and employment. In 1983, the contribution to national industrial value added of both provinces was less than 10 percent (approximately 2 percent of GDP), while
-200 0 200 400 600 800 1000 1200 1400
2007M11 2008M01 2008M03 2008M05 2008M07 2008M09 2008M11 2009M01 2009M03 2009M05 2009M07 2009M09 2009M11 2010M01 2010M03 2010M05 2010M07 2010M09 2010M11 2011M01 2011M03 2011M05 2011M07 2011M09 2011M11 2012M01
Figure2. Sri Lanka: Declining Sovereign Risk
The graph plots the Sri Lankan government bond spread minus the average emerging market sovereign bond spread and is meant to capture Sri Lanka specific risk
Source: World Bank GEM
BasisPoints
Conflict Ends May 2009
6
the employment shares were also less than 10 percent of total employment in the economy.5 The structure of the economy was dominated by agriculture – 33 percent of total output and 80 percent of employment – and the produce obtained (e.g. onions and chilies) was mainly for domestic consumption and not for export. More than one half of the country‘s fish catch in 1980 came from the North and the East.
During the war period, it is estimated that the area under cultivation in the North and the East fell by between 50 and 80 percent, paddy production fell off almost entirely, and industrial production virtually halted. The bulk of the reduction was concentrated in the North, while paddy production in the East was essentially unchanged over the period. Migration out of the areas took place, both to other parts of the Island and to foreign destinations, but the population share of these areas was still about 13 percent in 2001, although, the depletion of the social and economic infrastructure during the war means that the human capital stock has fallen behind the rest of the country. It is also the case that some of the agriculture activities in the North were not totally abandoned; they simply moved to other areas like Puttalam, and may not be expected to return.
With this background, the contribution of the North and the East to future economic growth prospects will likely be modest. Reconstruction activities will provide a one-time boost in growth, but beyond that it seems that small-holder agriculture and the fisheries sector will be the main sources of continued growth. Looking back at the response in the North and East after the 2002 cease fire agreement can provide some indication of what we might expect. The agriculture and fishing sectors grew more than 30 percent per year over the 2002-2004 period. The combined share of paddy production in the North and East increased by 4 percentage points to 31 percent of national production by 2003. Tourism rebounded in the East with the rebound in tourist arrivals to all parts of the country. While those developments were impressive in that the growth was broad- based and likely pro-poor, the small overall share of these provinces in country-wide GDP and employment meant that they were a modest driver of national growth.
5 The population in the two provinces was about 14 percent of the country‘s total.
7
To exploit the potential of the North and the East, infrastructure would need to be improved and private investors would need to take an active interest in those regions. This channel is therefore likely to mesh with the macro-fiscal channels (diversion of security spending towards infrastructure and reconstruction) and the microeconomic channel.
On the macro-fiscal channel, the relatively closed capital account combined with the dominant role of state banks acted to keep real interest rates at highly negative levels in the recent past. Going forward, the effect of falling risk premia on interest rates may be offset by growing external financial integration, keeping real interest rates at positive levels (as assumed in official medium-run projections). Therefore, the main macro-fiscal benefit is going to stem from the ability to reduce security-related spending and reverse the trend decline in revenue mobilization (in important part by eliminating the tax breaks doled out by the Board of Investment, which should no longer be needed to compensate for the erstwhile risky environment). This would facilitate achieving the large increase in public savings needed for sustainable rapid growth.
While falling risk premia may not have large benefits for the government in terms of lower real interest rates, the impact on the private sector would be beneficial to the extent that it was implicitly subsidizing the borrowing costs of the government. Overall, given longer horizons and greater stability, the microeconomic channel could become a powerful channel for the peace dividend and sustainable long run growth as firms invest in new technology and branch out into new areas, spurring faster TFP growth.
As noted earlier, the three channels for the peace dividend are linked and complementary.
Eventually, their overall contribution to Sri Lanka‘s growth prospects will depend on
improvements in the country‘s growth fundamentals. Box 1 spells out the ramifications of the term ‗growth fundamentals‘ for Sri Lanka.
8
Box 1: Growth Fundamentals in Sri Lanka’s Context
In Sri Lanka‘s case, a distinction is worth making between factors which will result in a one-time upward shift in the level of output and self-sustaining growth as a result of innovation and technological upgrading.
The post-war bounce from reintegration and the full utilization of excess capacity are examples of one-time positive shifts in output.
To get onto a trajectory of sustained, faster growth, Sri Lanka will need to raise national savings rates and create conditions for faster TFP growth: an enduring result in the empirical growth literature is that long- run per capita growth is driven eventually by TFP growth. Cross-country experience indicates that a sustainable government debt trajectory is a necessary foundation for solid, long-run growth. At the microeconomic level, competition, especially from imports, and hard budget constraints will provide the incentive for profit-maximizing firms to adopt new technology, expand their product mix and find new markets, all of which will contribute to faster productivity growth. At a deeper level, meeting these requirements calls for good governance and strong fiscal, financial and judicial institutions. These are needed to ensure well-managed public finances on the one hand and the property rights, level playing field and predictable environment on the other that will give private firms, domestic and foreign, the confidence to make long-run investment commitments.
Three other Sri Lanka-specific issues are worth emphasizing:
The critical importance of good leadership as emphasized in the Commission on Growth and Development 2009 report, in particular, the assurance of inclusion combined with a long-term development vision
Nurturing ethnic peace and social stability
Taking advantage of Sri Lanka‘s favorable geography in relation to China and India.
III. MACRO-FISCAL UNDERPINNINGS OF LONG RUN GROWTH
GoSL has set itself the target of growing at 8 percent or more per year in real terms over the medium term in pursuit of doubling per capita income to $4,000 by 2016 starting from $2,000 in 2009. How do the two targets, doubling nominal US dollar GDP per capita and achieving real GDP growth of 8 percent, mesh with each other? Box 2 goes through the accounting
reconciliation. Its main point is that the doubling of per capita income from $1,000 in 2004 to
$2,000 in 2009 involved a large real appreciation of the Sri Lankan rupee against the US dollar, of 7.5 percent per year; had the real exchange rate been flat, dollar income would have increased only by 40 percent and not 100 percent. Looking ahead, keeping up this pace of real appreciation would almost surely create severe competitiveness problems for Sri Lanka (see Rowe, Mishra and Rodarte 2011). Fortunately, repeating the above calculation for the period 2009 to 2016 shows that a flat real exchange rate will achieve a doubling of dollar per capita income provided the real GDP growth target of 8 percent is achieved. It almost goes without saying that lasting peace is a
9
pre-requisite for improvements in the country's growth fundamentals to realize better
development outcomes (Chen, Loayza and Reynal-Querol 2008). In other words, Sri Lanka will have to pay close attention to the growth fundamentals outlined in Box 1.
Box 2: Doubling US dollar per capita GDP between 2009 and 2016
Sri Lanka took 13 years to double its nominal dollar per capita GDP from US$ 500 in 1991 to US$ 1,000 in 2004. Five years later, in 2009, per capita income had doubled once again to roughly US$ 2,000 as shown in the figure. The Mahinda Chinthana‘s vision is to achieve another doubling of dollar per capita income by 2016.
To get a better sense of the challenge involved, we use the following identity:
,
where G$ is nominal US dollar per capita growth, g is real GDP growth, is the growth in the bilateral Sri Lankan rupee-US dollar real exchange rate (defined such that a positive value is an appreciation), is U.S. inflation and pgr is the population growth (all compound annual average growth rates).
During the period 2004 – 2009, real GDP growth was 6 percent with the population growth rate at 1 percent, implying per capita growth of 5 percent per year. Yet dollar per capita GDP grew at a huge 15 percent per year. Assuming 2 percent US inflation, the above identity tells us that the big driver of G$ was a rapidly appreciating bilateral real exchange rate, recording an annual average appreciation of 7.5 percent.
Experience from emerging markets the world over demonstrates that sustainable public finances are an essential underpinning for fast growth. Achieving low inflation rates is not enough. Public debt has to be on a trajectory deemed sustainable by the markets. Otherwise, there may be concerns about monetization of the debt and a rise in inflation, which could keep nominal and real interest rates high. This section starts by discussing broad fiscal outcomes of the past with a view to better understanding what future fiscal outcomes might look like. Next it
500
1,032
2,089
0 500 1000 1500 2000 2500 3000
Per Capita GDP, US$
Source: CEIC data
10
looks at the management of the public finances from the prism of debt sustainability and shows how the underlying determinants of the path of the debt-to-GDP ratio (―debt dynamics‖) are likely to change quite drastically going forward. In particular, reducing indebtedness further will have to rely more on faster growth and higher primary fiscal surpluses than on inflation, which was a prime factor (along with moderate growth) in eroding the government debt-to-GDP ratio over 2005-08. Lastly, the implications of GoSL‘s medium run fiscal targets for government saving are discussed.
a. A Brief History of Fiscal Policy in Sri Lanka
Before 1977, Sri Lanka‘s development strategy was based on import substitution with the government aiming to create a comprehensive welfare state. Its enviable social development indicators for its stage of development testify to the importance placed on social expenditures in the budget. An extensive network of welfare expenditures and consumer subsidies was paid for with trade tax revenues. In 1985, export taxes and import tariffs made up 30 percent of revenues.
Fiscal outcomes in Sri Lanka over the past three decades display three main features.
First, revenue from trade taxes has been in secular decline since 1985, reaching 18 percent of revenues in 2010 as a result of the post 1977 reforms, which liberalized external trade. Falling trade taxes led to falling fiscal revenues: government revenues as a share of GDP declined from 23 percent in 1980 to just 14 percent in 2010. The good news is that the 2011 Budget has initiated a systematic effort to increase revenue mobilization through new tax instruments and improved tax policy, including by revisiting the tax breaks provided by the Board of Investment (BOI).
Second, government subsidies to both consumers and state owned enterprises have been consistently significant in expenditures, ranging from 4 to 7 percent of GDP over the years.
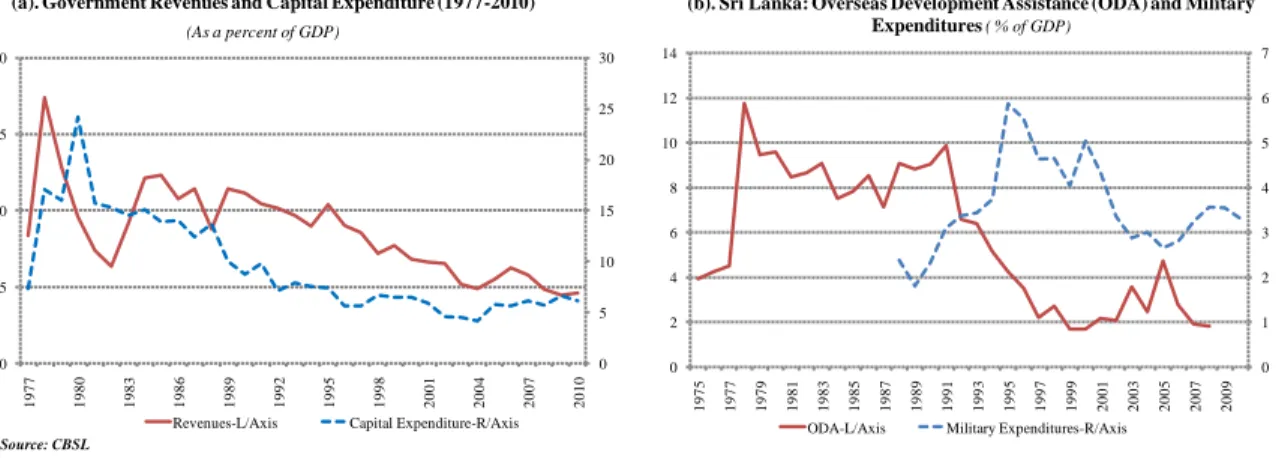
Third, since the outbreak of the conflict in 1983 defense expenditures have consumed an ever-growing share of total expenditure. With social expenditure and subsides being protected, capital spending has borne the brunt of cuts after 1980 to keep fiscal deficits under control
11
(Figure 3). However, these cuts were not enough to offset the decline in revenues, resulting in a fiscal deficit that has averaged 10 percent over the last thirty years.
Figure 3. Sri Lanka: Drivers of Fiscal Outcomes
A direct consequence is that interest costs have grown from 4.6 percent of GDP in 1985 to an average 6 percent of GDP for much of the recent decade. Rising interest costs started to kick in during the 1990s when there was a dramatic fall in concessional sources of financing as the conflict intensified. Overseas development assistance fell from on average 8.5 percent of GDP in the 1980s to just 2 percent of GDP by 2000, as shown in Figure 3 (b). Non-concessional external debt and much more expensive domestic debt became the main sources of financing in these years, helping to drive up both the stock of debt and interest costs.
b. Debt Dynamics
We focus on government debt dynamics since the late 1990s, which have been driven by the interaction among aid inflows, the conflict, inflation and economic growth outcomes. Going forward, debt dynamics are likely to be quite different from the historical evolution described here. In particular, faster growth and raising primary fiscal surpluses will need to be the focal points if Sri Lanka is to attain its goal of reducing government indebtedness to 60 percent by 2016.
0 5 10 15 20 25 30
10 15 20 25 30
1977 1980 1983 1986 1989 1992 1995 1998 2001 2004 2007 2010
Revenues-L/Axis Capital Expenditure-R/Axis Source: CBSL
(a). Government Revenues and Capital Expenditure (1977-2010) (As a percent of GDP)
0 1 2 3 4 5 6 7
0 2 4 6 8 10 12 14
1975 1977 1979 1981 1983 1985 1987 1989 1991 1993 1995 1997 1999 2001 2003 2005 2007 2009
ODA-L/Axis Military Expenditures-R/Axis
(b). Sri Lanka: Overseas Development Assistance (ODA) and Military Expenditures ( % of GDP)
12
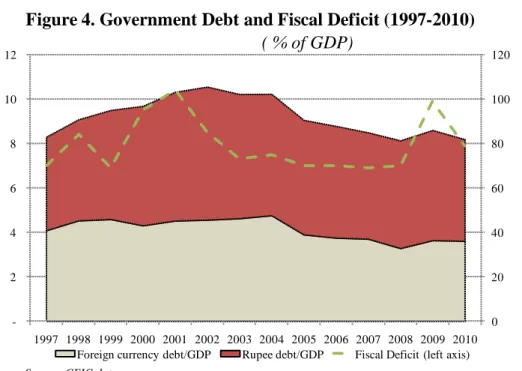
Figure 4 plots the ratio of government debt to GDP (―debt ratio‖) from 1997 to 2010. It peaked at 106 percent in 2002 after rising by some 23 percentage points of GDP starting in 1997.
It then fell by some 20 percentage points between 2002 and 2009.
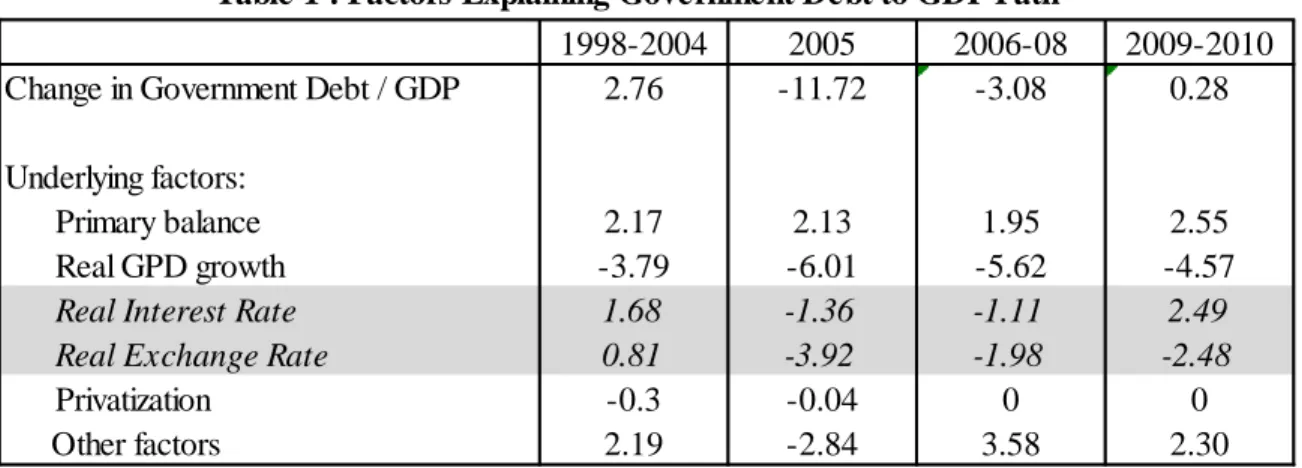
To get a better sense of the underlying factors driving this debt trajectory, we carried out a decomposition exercise aimed at apportioning changes in the debt ratio over the period 1998- 2010 to the primary fiscal deficit, real GDP growth, the real interest rate and the real exchange rate.6 In addition to these main drivers of debt dynamics, the effect of revenues from
privatization (‗divestment‘) and other, unidentified factors are shown in the last two rows of Table 1. The way to interpret the numbers in the table is as follows: the first row gives the actual change in the debt ratio for each sub-period in percentage points of GDP per year (the reason for such ―annualization‖ is that the sub-periods are not equal in length). For example, over 1998- 2004, debt increased by an average rate of 2.8 percentage points of GDP per year, while it fell by some 3 percentage points per year over 2006-08. The numbers in the other rows give the average annual impact of each underlying factor for each sub-period in percentage points of GDP: a
6 The technical details and derivations can be found in the appendix to Aizenman and Pinto (2005).
0 20 40 60 80 100 120
- 2 4 6 8 10 12
1997 1998 1999 2000 2001 2002 2003 2004 2005 2006 2007 2008 2009 2010 Foreign currency debt/GDP Rupee debt/GDP Fiscal Deficit (left axis)
Figure 4. Government Debt and Fiscal Deficit (1997-2010)
Source: CEIC data.
( % of GDP)
13
positive (negative) number means that the factor concerned raised (lowered) the debt ratio during that sub-period.
If we compare the debt build-up phase, 1998-2004 (when debt rose sharply and stayed above 100 percent of GDP until 2004) with the subsequent rapid decline over 2005-2010:7
The primary fiscal deficit hovered around 2 percent of GDP—there was not significant change here
Faster growth over 2005-2010 resulted in an additional erosion in the debt ratio equal to 1.5 percentage points of GDP per year (-3.8 over 1998-2004 compared to -5.3 over 2005-2010)
Combined real interest rate and real exchange rate impact went from +2.5 percentage points of GDP over 1998-2004 to -2.4 percentage points over 2005-2010, a swing of close to 5 percentage points per year. This was the biggest factor by far and explicable largely by a pick-up in inflation, as we shall see below.
Almost half of the 24 percentage point reduction in the debt ratio between 2002 and 2010 occurred that year, which followed the devastating tsunami of December 2004. Nominal interest rates dropped significantly and the currency appreciated in nominal and real terms as aid inflows
7 These observations are based on comparing the numbers for 1998-2004 with those for 2005-2010. The reason for splitting up the latter period in Table 1 will become apparent below.
1998-2004 2005 2006-08 2009-2010
Change in Government Debt / GDP 2.76 -11.72 -3.08 0.28
Underlying factors:
Primary balance 2.17 2.13 1.95 2.55
Real GPD growth -3.79 -6.01 -5.62 -4.57
Real Interest Rate 1.68 -1.36 -1.11 2.49
Real Exchange Rate 0.81 -3.92 -1.98 -2.48
Privatization -0.3 -0.04 0 0
Other factors 2.19 -2.84 3.58 2.30
Source: CBSL Annual Reports, Bank staff calculations.
Table 1 : Factors Explaining Government Debt to GDP Patha/
a/ The numbers in the table are the average annual impact of each factor for each sub-period of time in percentage points of GDP.
14
surged by 2 percentage points of GDP. Inflation rose to double-digit levels. The drop in real interest rates to negative levels and the appreciation of the real exchange rate explain almost half the fall in the debt ratio that year; while a pick-up in growth as tsunami-related reconstruction began explains the rest of the decline.
After 2005, ODA flows declined, the conflict intensified and domestic inflation started to accelerate in part due to the international food and fuel prices crisis of 2007-08. Real exchange rate appreciation and a decline in real interest rates continued to play an important role in reducing the debt ratio during 2006-08. Again, robust real GDP growth pulled the ratio in the same direction, while the primary deficit acted to halt an otherwise bigger decline in the ratio.
The years 2009-10 are isolated for two reasons. First, these years reflect the impact of the global financial crisis on Sri Lanka and the subsequent rebound from it; growth fell to 3.5 percent in 2009 and then accelerated to 8 percent part of which may be explicable by the peace dividend.
Second, these years provide the first hint that the debt dynamics in Sri Lanka are about to change in fundamental ways. Overall, the debt ratio remained largely unchanged from its 2008 level of 81 percent of GDP. As in the previous two periods, the strong appreciation of the real exchange rate reduced the debt burden, but unlike in the past, the real interest rate effect increased it by an almost offsetting amount.
c. Role of Inflation
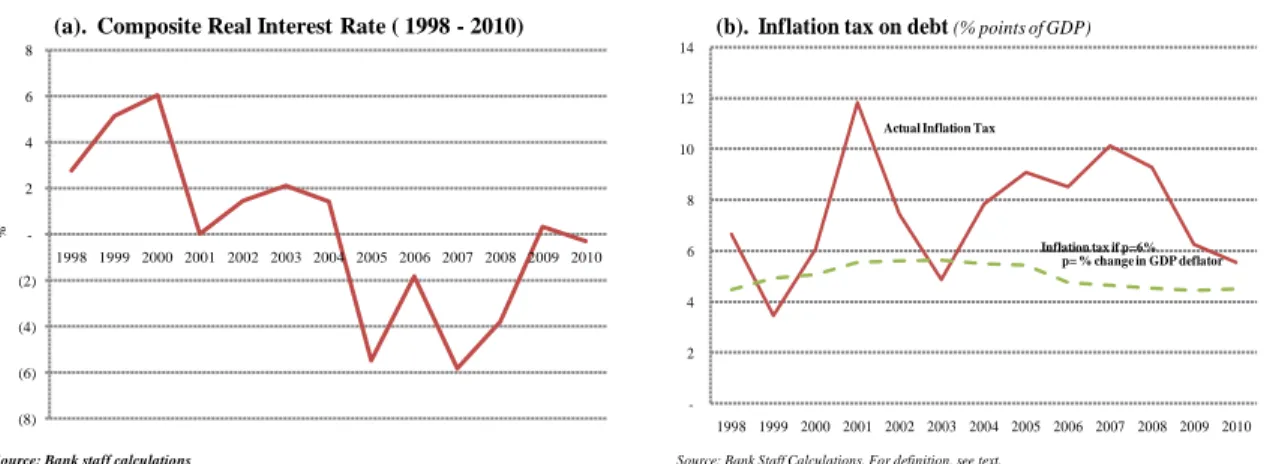
This brings us to a critical point: inflation has played a significant role in reducing the debt ratio since 2005. Figure 5(a) depicts the composite real interest rate over the period 1998 to 2009; the composite real interest rate captures the joint impact of real interest rates and the real exchange rate on total indebtedness, foreign currency and rupee.8 It was consistently positive
8 See technical annex for derivation. The advantage of working with the composite real interest rate is that it readily enables a comparison with the real interest rate used for projections of the debt ratio into the future—which are often done in a single currency environment (note that Table 1 separates the real interest rate and exchange rate effects).
15
until 2005, when it entered strongly negative territory as inflation picked up during the years 2005-08 and became a major factor in the erosion of the debt ratio.
Figure 5. Sri Lanka: Inflation and Debt Dynamics
Figure 5 (b) depicts the implicit revenues secured by GoSL from inflation, labeled
―inflation tax on debt‖, which averaged a huge 9 percentage points of GDP per year over the four years 2005-08. There is no free lunch: if inflation persists, rational investors in government securities would soon demand higher nominal interest rates and the rupee would tend to depreciate, reducing the effective proceeds from the inflation tax. For example, the proceeds from the inflation tax on debt were close to 12 percent of GDP in 2001 but neutralized by high nominal interest rates and a large depreciation of the rupee (leading to a zero composite real interest rate as shown in Figure 5(a)). But this was not the case over 2005-08, leading to large, negative composite real interest rates over this period. Three reasons for the relatively muted response of nominal interest rates and the exchange rate might be the large inflow of foreign aid after the tsunami; the dominant role of state banks in the domestic government debt market combined with the unseemly optics of demanding high nominal rates during a war effort; and the relatively closed capital account, limiting the menu of alternative investments.
Going forward, the situation promises to be dramatically different. The composite real interest rate being assumed by GoSL in its medium-term program is plus 3 percent, indicating that it is not banking on negative real interest rates. This incorporates a major switch in the
(8) (6) (4) (2) - 2 4 6 8
1998 1999 2000 2001 2002 2003 2004 2005 2006 2007 2008 2009 2010
Source: Bank staff calculations
%
(a). Composite Real Interest Rate ( 1998 - 2010)
- 2 4 6 8 10 12 14
1998 1999 2000 2001 2002 2003 2004 2005 2006 2007 2008 2009 2010 Actual Inflation Tax
Inflation tax if p=6%
Source: Bank Staff Calculations. For definition, see text.
p= % change in GDP deflator
(b). Inflation tax on debt (% points of GDP)
16
government‘s debt dynamics. The Central Bank has also announced a medium-term target of 6 percent for the GDP deflator. The implications of this are captured by the dotted line in Figure 5 (b), which computes the inflation tax at the target rate of 6 percent. The difference between the two graphs is a measure of the ‗excess‘ inflation tax on debt over this historical period, which shrank dramatically in 2009 as inflation fell to single-digit levels. With the Central Bank‘s single digit inflation target for the medium-term and a more-or-less flat real exchange rate, the
expectation of positive real interest rate going forward is well founded.
Additionally, the central bank is engaged in a systematic opening up of the capital account ( Box 3). This too will limit the ability to use the inflation tax as investors will now have alternatives, increasing the inflation elasticity of rupee-denominated assets. Therefore, going forward, one should expect a sharply reduced role for inflation in curbing indebtedness. In other words, reducing indebtedness to 60 percent of GDP is going to require faster growth and fiscal reform to raise primary fiscal surpluses.
Box 3: Financial Liberalization – Growth or Vulnerability?
The goal of the financial system is to help with resource mobilization and allocation as well as risk management in pursuit of faster long-run growth. It can, however, itself become a costly source of vulnerability. In particular, emerging economies pursuing open capital accounts and external financial integration have often found that the eventual result was higher macroeconomic vulnerability than faster growth. Vulnerability was more apt to take hold in countries where public finances were weak, exchange rates fixed, international liquidity low (low foreign exchange reserves relative to the claims on them) and current account deficits large.
At the same time, emerging market countries like India and China, which are growing rapidly, have moved cautiously on external financial integration and relied substantially on national savings in order to finance investment and growth.
Sri Lanka has an excellent credit history: it has never defaulted on its debt even during the long civil war.
Risk premia have fallen sharply following the end of the war (see Figure 2) and growing confidence in economic policy. GoSL has announced a medium-term plan to lower its fiscal deficit and the government‘s debt-to-GDP ratio.
Armed with these strengths, CBSL has embarked upon an extensive liberalization of the capital account.
Experience indicates that this program needs to be implemented cautiously. While there has been a substantial build up in foreign exchange reserves under the IMF program, these were less than short-term external debt at the end of 2011. And the equivalent of some $2.4 billion in government securities issued in the domestic market is held by foreign portfolio investors—although a cap of 12.5 percent has been placed on foreign investment in the government debt market.
17 d. Fiscal Targets and Government Saving
As stipulated in the Fiscal Management (Responsibility) Act No 3 of 2003, GoSL
announced its medium-term macro fiscal framework in November 2010 covering the period up to 2013, in which it intends to maintain government capital expenditure at 6.5 percent of GDP while lowering the fiscal deficit to 5 percent of GDP by 2013. These targets imply significant
challenges for the management of the public finances as can be readily seen from the accounting identity in equation (1). Equation (1) says that the fiscal deficit is simply the difference between government investment (annual capital expenditure) and government saving (revenue minus current spending):
(1) ,
where the left hand side is the ratio of the fiscal deficit (total expenditure G minus total revenues T) to GDP and IG and SG are government capital expenditure and saving respectively. If the fiscal deficit is to be brought down to 5 percent of GDP while capital expenditure is kept at 6.5 percent of GDP, it follows from (1) that government savings will have to be raised from the current levels averaging minus 2 to 3 percent to plus 1.5 percent, a significant swing of 3.5 to 4.5 percentage points of GDP in very short order.
A similar effort is needed to ensure that government debt falls to 60 percent of GDP by 2015. This will require the primary surplus to be raised from minus 2 percent of GDP on average over the last decade to zero immediately followed by a gradual increase to a little over 1percent of GDP by 2015.9 Slower growth or higher real interest rates will require a bigger fiscal effort.
In the next section, we focus on long-run growth dynamics and the sustainability of the post-conflict growth acceleration.
9 This calculation assumes a linear reduction in the debt ratio from 81 percent in 2010 to 60 percent in 2015, a real interest rate of 3 percent and real GDP growth of 8 percent per year. Once the goal of 60 percent is reached, Sri Lanka will be able to run primary deficits of close to 3 percent of GDP yet maintain the 60 percent debt ratio; but this crucially rests on the persistence of a differential of 5 percentage points between the real growth rate and real interest rate and the desirability of keeping the debt ratio at 60 percent.
18 IV. SUSTAINABILITY OF HIGH GROWTH
This section sets out the challenge of sustaining the high growth rates. As a starting point, Box 4 lays out the ―growth arithmetic‖ commonly used to ascertain the savings rates Sri Lanka would need to fulfill its growth aspirations. While this framework is helpful in assessing the savings effort needed from the public and private sectors to achieve economic growth targets, the arithmetic runs into trouble because it assumes a constant incremental capital-output ratio (ICOR), which is equivalent to assuming constant marginal returns to capital. In practice, with capital subject to diminishing marginal returns, the savings rate needed to support a target growth rate will rise over time for given total factor productivity, labor force and human capital growth rates. For the same reason, we would expect to see an increase in the ratio of capital to output over time. Therefore, a dynamic framework allowing for diminishing marginal returns to capital is needed to get a better sense of the medium-to-long term links between savings and growth.
Box 4: Harrod-Domar Growth Arithmetic: Simple, but Incomplete
Numerical calculations of the savings rate needed to support a target growth rate are commonly carried out using the Harrod-Domar equation. This equation can be obtained as follows:
,
where g is the growth rate of real GDP, Y, and K is the physical capital stock. The first term in brackets on the right-hand side is the inverse of the incremental capital-output ratio (ICOR) while the second is the investment rate. The simplest version of the framework assumes a closed economy so that the investment rate equals the savings rate, s. Therefore, given a target growth rate g*, the required savings rate s* based on the equation is the ICOR multiplied by g*.
Given the Sri Lankan real GDP growth target of 8 percent and an ICOR of 4.5, the required investment rate would be 36 percent of GDP. If one assumes a sustainable current account deficit of 4 percent of GDP, then the required national savings rate s* would be 32 percent. Suppose the ICOR goes down to 4 as a result of growing productivity and efficiency as part of the peace dividend. Then s* would fall to 28 percent.
With national savings averaging 22 percent of GDP over the last decade, the increase in the savings rate would need to be 6 percent of GDP. Achieving the fiscal target of raising government savings from -2 percent to +1.5 percent of GDP would require an increase in the private savings rate of an additional 2.5 percent of GDP, which is eminently feasible.
While this appealing framework indicates that a target growth rate of 8 percent is readily within grasp, it is subject to pitfalls beyond the very short run. These are discussed in the text.
With this in mind, we present results below drawn from a dynamic simulation framework calibrated with parameters and data drawn from Sri Lanka‘s own past experience as well as that
19
of other developing countries using a modified Solow growth model.10 In this model, growth is driven by the following main variables:
Total Factor Productivity (TFP) growth: The growth rate of TFP is exogenous in the simulation framework. Historically, it has averaged around 1 percent per year in Sri Lanka.
In Scenario 1, it is assumed to accelerate to 1.75 percent, which represents a substantial increase. A further acceleration to 2.5 percent is assumed under Scenario 2, a TFP growth rate few countries exhibit over long periods.11
Capital accumulation: The capital-to-output ratio for 2010 is determined by the perpetual inventory method with an assumed 8 percent depreciation rate (details may be found in Hevia and Loayza 2011, henceforth, H-L). The subsequent dynamics of the capital stock are determined by the path of national savings and the current account deficit with suitable adjustments for depreciation.
Savings: National savings is the sum of private savings and government (public) savings.
Private savings is treated as endogenous and depends upon income and demographic
variables (such as the ratio of old-age or young-age population to working age population) as well as public saving (through so-called Ricardian effects). Public savings could either be given as a policy variable (as determined by the announced fiscal targets, for example) or as a balancing figure needed to attain a required national savings rate.
Labor force and Human Capital growth: The ratio of working age population to total population (―labor force‖) is based on demographic projections while the quality of the work force (―human capital‖) is determined in accordance with the number of years of schooling and the returns to education. Both variables are exogenous.
External sustainability: The simulation framework assumes that Sri Lanka will be able to increase net external indebtedness along a path which yields a sustainable current account deficit in the 4 percent of GDP range.
The simulation framework (Annex 2 presents the underlying equation) is used to answer two types of questions: what is the national savings rate needed to support a given growth target?
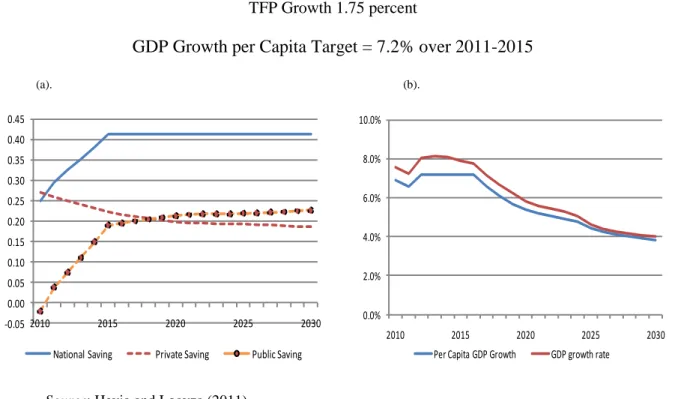
And for a given target for public savings, what growth path will emerge? Figure 6 summarizes the results from Scenario 1 with 1.75 percent TFP growth. Panel (a) shows the national savings
10 The framework and detailed results are contained in Hevia and Loayza (2011).
11 As Hevia and Loayza (2011) note, 1.75 percent is the average TFP growth rate in the top 25 percent of countries in a worldwide sample; 2.5 percent would constitute a ―miracle‖ scenario.
20
trajectory required for 8 percent real GDP growth (which translates to 7.2 percent per capita growth) over 2011-2015. The national savings rate has to increase to 41 percent by 2015 in order to deliver this growth rate.
Figure 6. Growth Scenario 1 TFP Growth 1.75 percent
GDP Growth per Capita Target = 7.2% over 2011-2015 (a). (b).
Source: Hevia and Loayza (2011)
How will the required savings rate of 41 percent for Sri Lanka be split between private and public savings? With private savings determined endogenously, most of the action will need to come from raising public savings, as shown in the figure. Public savings will need to increase from negative levels in 2010 to close to 20 percent of GDP in 2015 and eventually plateau around 23 percent of GDP. Going beyond 2015, the simulation assumes that the 41 percent national savings rate will be maintained into the future. However, as a consequence of diminishing marginal returns to capital, the growth rate of GDP declines to 4 percent by 2030 even if the savings rate of 41 percent is maintained. Indeed, to keep real GDP growth at 8 percent over the long run, the national savings would have to continuously rise above 41 percent. Box 5 provides an explanation for why the savings rate must keep rising to achieve a given growth target.
-0.05 0.00 0.05 0.10 0.15 0.20 0.25 0.30 0.35 0.40 0.45
2010 2015 2020 2025 2030
National Saving Private Saving Public Saving
0.0%
2.0%
4.0%
6.0%
8.0%
10.0%
2010 2015 2020 2025 2030
Per Capita GDP Growth GDP growth rate
21
Box 5: Why the Savings Rate Must Keep Rising with a Given Growth Target
Why must the savings rate rise continuously in the neoclassical framework underpinning the Hevia-Loayza simulation model to maintain a target growth rate? With the growth rates of TFP, human capital, the labor force, and population given exogenously, (let‘s refer to their sum as z), the only way for the growth rate of GDP to stay constant at some target level is for the capital stock to grow at a constant rate. For this to happen in the presence of diminishing marginal returns to capital, a fundamental assumption in the neoclassical framework, the savings rate must continuously increase.
Let output, Y, be given by: where A is TFP, K is the stock of physical capital, E is the working age population (―number of workers‖) augmented by the human capital variable, , to obtain effective labor input, and is the elasticity of output with respect to capital ( being less than 1 implies diminishing marginal returns to capital). Then we can write the growth equation:
(i) ,
where a ―^‖ refers to the growth rate of a variable: is the growth rate of output, is the growth rate of the capital stock, is TFP growth, and is the growth rate of human capital. We can write where is the ratio of working age population, E, to total population, N, which then gives , where is the population growth rate, completing the expression on the right-hand-side of equation (i). The expression in square brackets is the z referred to in the first paragraph of this box.
It follows from (i), for a given z and target growth rate , that must satisfy:
(ii) .
In other words, the capital stock must grow at the constant rate given by this equation. Now where s is the national savings rate, c (assumed constant) is the ratio of the current account deficit to output, and is the rate of depreciation of capital. This can be rewritten:
(iii)
Combining (ii) and (iii) gives us an expression for the required savings rate, s*, to meet a given growth target, g*:
(iv)
In equation (iv), K/Y is the reciprocal of the average product of capital, APK. Since APK goes down with K because of diminishing marginal returns (recall that APK is proportional to the marginal product of capital with the Cobb-Douglas production function assumed for Y) it follows from (iv) that s must rise over time to maintain growth at its target level of g*.
Two corollaries emerge from the above:
Suppose the savings rate is raised to meet a given growth target in line with (iv) and then held constant.
In this case, growth will slow until it reaches its steady-state value given by
along a balanced growth path (meaning that the capital stock grows at the same rate), that is, the asymptotic growth rate of GDP is determined by TFP growth, human capital and population growth (the
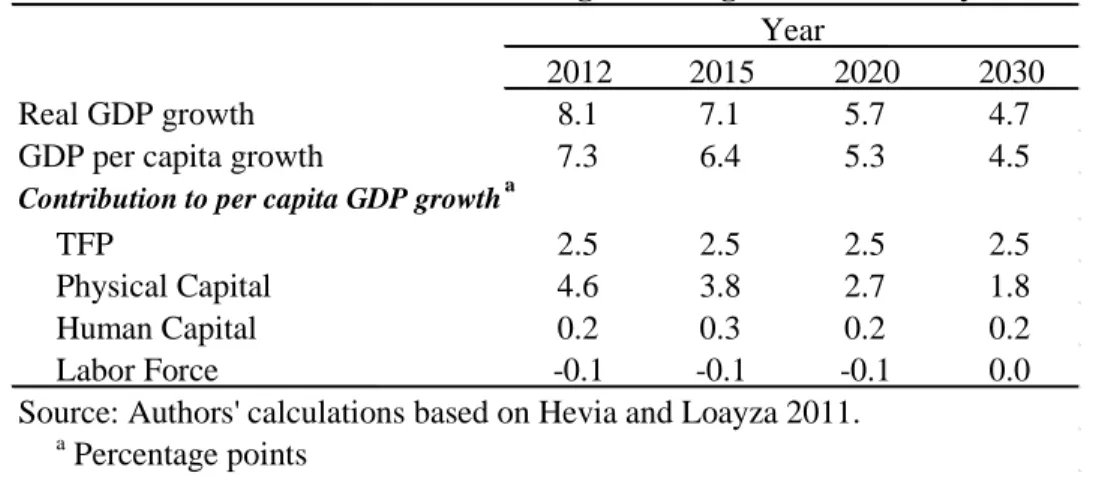
assumption is that the ratio of working age population to total population eventually stabilizes). Using (i), it follows that in steady state, , which is simply a way of decomposing the expression for steady-state growth earlier in this bullet into components attributable to TFP, capital accumulation, human capital and population growth (as in Table 2 below).
Any forces which lead to non-diminishing marginal returns to capital (―endogenous growth‖) will obviously be beneficial and require a lower savings rate for a given growth target. (Some of this is discussed in section V on the microfoundations of growth.)
22
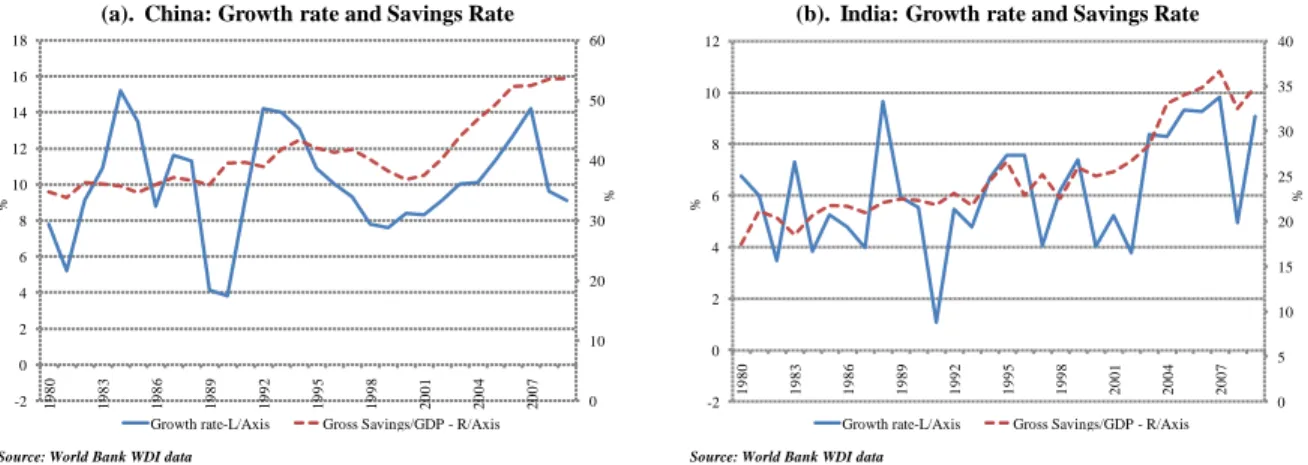
Notice from Figures 7(a) and (b), which show savings and growth rates for China and India, that the need for high savings rates for sustained fast growth is hardly extravagant.
Figure 7. National Savings and Growth: China and India
This exercise brings out two points: first, achieving 8 percent growth over the medium term in Sri Lanka will call for a huge fiscal effort to increase public savings substantially.
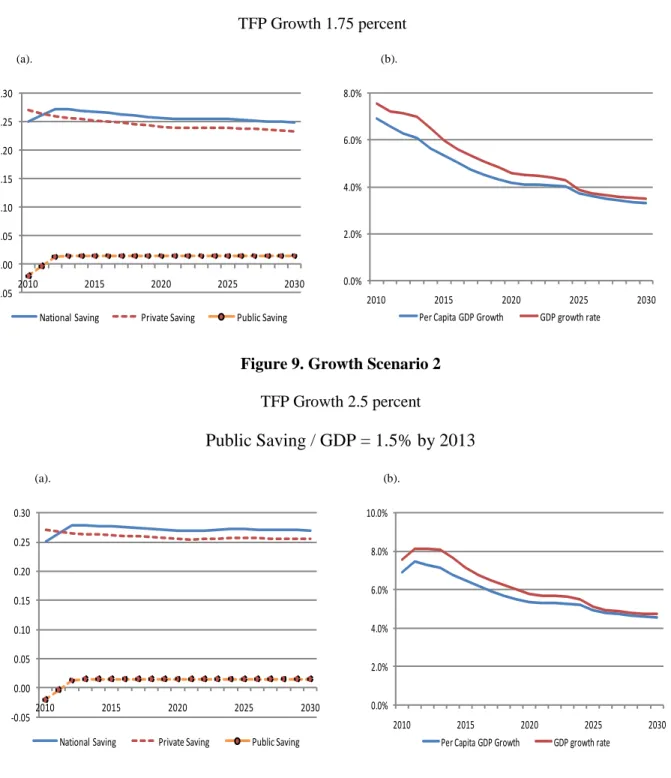
Second, even assuming the required level of savings is achieved, it will not suffice to maintain an 8 percent growth rate over the long run. Since achieving the desired level of public savings may not be feasible, Figures 8 (a) and (b) shows the growth dynamics consistent with the targeted level of public savings of 1.5 percent of GDP to be attained by 2012. This will constrain the overall level of national savings to a little over 25 percent of GDP in the medium run, leveling off at just below 25 percent over the long run. Sri Lanka does not reach the 8 percent growth target even over the medium run and the growth rate drops to less than 4 percent over the longer run.
Figures 9 (a) and (b) depict Scenario 2 reconciling the government‘s growth targets with its savings target of 1.5 percent of GDP. The key difference from the previous simulation is the assumption that TFP will grow at 2.5 percent per year over the long term. Based on cross- country experience, this is not impossible but is hard to achieve: this is a highly optimistic scenario. National savings need to rise to approximately 27 percent over the long-term; recall from Figure 7 that this is substantially less than the savings rates achieved by China and India.
0 10 20 30 40 50 60
-2 0 2 4 6 8 10 12 14 16 18
1980 1983 1986 1989 1992 1995 1998 2001 2004 2007
(a). China: Growth rate and Savings Rate
Growth rate-L/Axis Gross Savings/GDP - R/Axis
%
Source: World Bank WDI data
%
0 5 10 15 20 25 30 35 40
-2 0 2 4 6 8 10 12
1980 1983 1986 1989 1992 1995 1998 2001 2004 2007
(b). India: Growth rate and Savings Rate
Growth rate-L/Axis Gross Savings/GDP - R/Axis
%
Source: World Bank WDI data
%
23
Real GDP growth is maintained at the 8 percent target until 2014 and then declines although it stays above 6 percent until the end of the decade. Eventually, it settles at a rate which is similar to Sri Lanka‘s historical average growth rate of 5 percent.
Figure 8. Growth Scenario 1 With Government Savings of 1.5% of GDP TFP Growth 1.75 percent
(a). (b).
Figure 9. Growth Scenario 2 TFP Growth 2.5 percent
Public Saving / GDP = 1.5% by 2013
(a). (b).
Source: Hevia and Loayza (2011)
-0.05 0.00 0.05 0.10 0.15 0.20 0.25 0.30
2010 2015 2020 2025 2030
National Saving Private Saving Public Saving
0.0%
2.0%
4.0%
6.0%
8.0%
2010 2015 2020 2025 2030
Per Capita GDP Growth GDP growth rate
-0.05 0.00 0.05 0.10 0.15 0.20 0.25 0.30
2010 2015 2020 2025 2030
National Saving Private Saving Public Saving
0.0%
2.0%
4.0%
6.0%
8.0%
10.0%
2010 2015 2020 2025 2030
Per Capita GDP Growth GDP growth rate