Institut für Raumplanung Institut für Raumplanung Institut für Raumplanung Institut für Raumplanung
Fakultät Raumplanung · Universität Dortmund
Berichte aus dem Institut für Raumplanung
56
Ilan Salomon, Eran Feitelson, Galit Cohen,
Rolf Moeckel, Klaus Spiekermann, Michael Wegener Sustainable Mobility in Cities:
Qualitative and Quantitative Analysis
Final Report to the German-Israeli Foundation for the Advancement of Science (G.I.F.)
Dortmund, September 2002
Institut für Raumplanung
Fakultät Raumplanung, Universität Dortmund D-44221 Dortmund
Tel. 0231-7552291, Fax 0231-7554788
Contents
1 Introduction ... 4
2 Problem Statement ... 6
3 State of the Art ... 8
3.1 New Travel and Activity Patterns ... 8
3.2 Policy Packages ... 10
3.3 Microsimulation ... 11
3.4 Activity-Based Travel Modelling ... 13
3.5 Spatial Disaggregation ... 16
4 Life Styles ... 18
4.1 Life Styles in Israel ... 18
4.1.1 Ethnic Religious Groups ... 19
4.1.2 Demographic Trends ... 20
4.2 Life Styles in Netanya ... 21
5 Policy Packages ... 24
5.1 The Scope of Measures ... 26
5.2 A Generic Algorithm for Policy Packaging ... 26
6 The Microsimulation Model ... 32
6.1 Model Overview ... 32
6.2 Travel Behaviour ... 33
7 The Netanya Application ... 36
7.1 The Study Area ... 36
7.2 The Database ... 37
7.2.1 Land Use ... 37
7.2.2 Transport Network ... 37
7.2.3 Zone/Region/Netanya Data ... 37
7.3 Spatial Disaggregation ... 40
Contents 3
7.4 Synthetic Population ... 43
7.4.1 Methodology ... 43
7.4.2 The Synthetic Population Generator Programme ... 45
7.4.3 The Change Submodel ... 56
7.5 Output ... 57
7.6 Limitations ... 66
8 Conclusions and Future Work ... 67
9 References ... 69
1 Introduction
With the rising importance of environmental quality the primary goal of transportation policies is increasingly defined as sustainable mobility. However, the concept of sustainability does not only refer to the natural environment. Transport policies need to accommodate, to varying de- grees, three objectives: economic growth, social equity and environmental sustainability. The challenge of policy formulation is complicated by the fact that all three objectives are themselves multi-dimensional. The costs and benefits of policy measures to promote sustainable mobility in cities are likely to be differentially distributed across different segments of the population based on location, socio-demographic and economic characteristics, behavioural patterns (including travel behaviour) and demand attributes. Discrete measures designed to benefit one group often adversely affect others. Spillover effects occur between spatial units and on a temporal dimen- sion. There are positive synergies between some policies, whereas other policies cancel each other out. Thus there is a great societal benefit in designing harmonised, comprehensive policy packages to promote sustainable mobility.
It was therefore the objective of the project 'Sustainable Mobility in Cities' to advance an ap- proach for identifying and recommending policy packages for sustainable mobility. The study was to combine qualitative and quantitative methodological components:
- Qualitative analysis. In the qualitative part of the analysis, market segmentation techniques were used to identify groups and locations that will positively or negatively be affected by transport-related policy instruments. The attributes of policy instruments were used to identify complementary and contradictory effects among policy tools. The results were used to suggest possible policy packages, i.e. combinations of policies that are likely to have large positive synergies and little negative side effects.
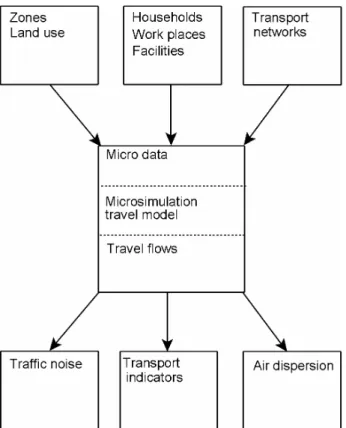
- Quantitative analysis. It was planned that selected policy packages so identified would be submitted to a more rigorous test using a disaggregate travel demand and traffic simulation model incorporating concepts from time-space geography, activity analysis, discrete choice theory, microeconomic consumer choice theory and lifestyle analysis in a Monte Carlo micro- simulation framework. The intention was that the mobility patterns generated by the model would be input to environmental submodels forecasting environmental impacts such as energy use, CO2 emissions, air pollution, traffic noise and land consumption of transport infrastructure in order to allow their assessment in terms of spatial or social equity, and so leading back to the qualitative analysis.
The project was a co-operation between the Department of Geography of the Hebrew University of Jerusalem and the Institute of Spatial Planning of the University of Dortmund.
The project was funded by the German Israeli Foundation for Scientific Research and Develop- ment (G.I.F) with a substantially reduced budget, after a proposal for a more comprehensive study on the same topic had been rejected.
Case study city for testing the methodology was to be Netanya, a town with a population of about 150,000 on the Mediterranean shore 25 km north of Tel Aviv.
Contents 5
The project could only partly achieve its objectives:
- The qualitative part of the study was successful in that it established the methodology for identifying groups and locations positively or negatively by transport policies and for qualitatively assessing the effects of policy packages. However, it was not possible to em- pirically apply the concept to the case study city of Netanya and to define a set of policy packages.
- In the quantitative part, it was possible to establish the spatially disaggregate socio- economic and network databases required for the model. However, of the model develop- ment tasks, only the first part, the generation of the 'synthetic population' was completed.
The travel simulation model, the core component of the planned model, could not be com- pleted during the project. The consequence was that the link between the travel model and the pre-existing environmental impact submodels could not be established.
The single reason for this failure to complete all planned tasks was that the work programme, even in its modified form after the rejection of the more comprehensive proposal, was far too large for the reduced budget. Hopes by the research teams to exploit synergies with other con- current research projects did not materialise. That the intended work programme would have required substantially larger resources has since been demonstrated by several similar re- search efforts both in North America and in Europe.
Nevertheless, within the constraints of the limited budget, significant tangible results have been achieved. They are presented in this report. The report starts with a problem statement and a presentation of the state of the art. Subsequently, the results first of the qualitative part of the study and then of the quantitative modelling work are reported. The report concludes with an outlook on expected future work and first ongoing efforts.
Besides the investigators listed on Page 4, the following individuals contributed to the re- search: At the Department of Geography of the Hebrew University, Galit Cohen was responsible for the collection of socio-economic and network data of Netanya. At the Institute of Spatial Planning in Dortmund, Franz Fürst and Daria Herbst processed the data for input to the simu- lation model. Stefan Schönfelder contributed the material for the state of the art in activity- based travel modelling. Klaus Spiekermann provided the methodology for disaggregating spatial data to raster cells. Rolf Moeckel developed the programme for generating the syn- thetic population. The report was written by Ilan Salomon, Eran Feitelson, Galit Cohen, Rolf Moeckel, Klaus Spiekermann and Michael Wegener.
2 Problem Statement
Effective and reliable transport systems are crucial for the functioning of post-industrial economies, as such economies are based on rapid movement of goods and people in an in- creasingly complex spatial pattern (Bell and Feitelson, 1991). Yet such systems generate sig- nificant negative externalities, such as air pollution, noise vibrations, safety hazards, visual blight, energy consumption and emission of greenhouse gases and loss of open space (OECD, 1988; Small, 1993a; 1993b). The environmental effects of transport are receiving increasing attention in recent years (Barde and Button, 1990;), due in part to the increasing attention given to non-point sources relative to point sources (for which policies are further developed), and the continuing rise in motorisation levels and vehicle-km travelled in all parts of the world (Salomon et al., 1993).
The growing concern over the widespread environmental effects of transport have generated a plethora of responses. These have been documented in a large number of recent studies (Barde and Button, 1990; Himanen et al., 1992; Banister and Button, 1993; Whitelegg, 1993).
Yet most of these responses have been limited to a few direct actions.
In recent years, the formulation of transport policies is increasingly concerned with the con- cept of sustainable mobility (Masser et al., 1992; Nijkamp, 1994). The challenge in structur- ing policies designed to achieve such a goal (regardless of the exact definition of it) is that transportation systems have to accommodate to varying degrees three major social objectives:
economic growth, social equity and environmental sustainability, each of which is multi- dimensional. That is, the definition of each requires that several variables be considered. The problem of formulating transportation policies is therefore (following Dery, 1984) a 'complex problem' where each measure is likely to ameliorate part of the problem but is also likely to affect other parts of it. Measures designed to mitigate one type of environmental externality are likely to also affect other environmental parameters, as well as to have effects on the effi- ciency and equity aspects of the transport system. Thus, each of the three main objectives may impose constraints on the degree to which the others can be attained. This requires that the scope of environmental policies be widened so that comprehensive measures addressing the multiple parameters of the issues be formulated and analysed (Oppenheimer, 1995).
The spatial aspect of environmental policy making is particularly intriguing. Emission of pollutants occurring in one area, often by through traffic, affect both local residents and resi- dents of more distant areas, often in different jurisdictions. Thus, the side effects may also take the form of spatial spillover effects, whereby measures mitigate the externalities in one geographical area but have deleterious effects on other areas. Policy packages, rather than single measures are, therefore, needed to address these multiple secondary externalities. Such packages are likely to be much more effective than single measures (Ewing, 1993; Giuliano and Wachs, 1991; Watterson, 1993; Wegener, 1996). The challenge of sustainable mobility can thus be re-interpreted as the challenge to identify the best policy packages that will help to meet the multiple, non-conforming, objectives of transport systems.
One of the more difficult issues in advancing policy packages is the understanding of the in- teractions between policy tools. Three types of interactions can be delineated. One, conflict- ing or supportive direct effects between policy measure. These take place within a complex system, in which a policy geared to attain one objective is likely to affect other objectives, not always monitored by the policy maker. For example, increasing city centre parking contra-
Problem Statement 7
dicts efforts to curtain traffic congestion in radial arteries. In other cases different policies can support each other. As Wegener (1996) showed with the help simulation models, improved public transport combined with high parking fees and high petrol taxes can reduce vehicle-km driven, and thereby reduce emission. Moreover, policies in non-transport fields can have sub- stantive effects on the transport system, and transport policies can have substantive effects on other fields. These were termed by Dery (1999) 'policies by the way', or 'residual' policies.
Examples include tax policies, from whose perspective transport is a residual policy (Cohen, 1998). Finally, there may be spatial and temporal interactions among policies. Both transport and environmental policies vary across space, and have differential effects in terms of the time span within which they are formulated and enacted. Thus, policies enacted at one time can have differential effects over time, and implications for places other than that in which they were enacted. For example, closures of roads to through traffic in one area can effect traffic flows in far-reaching areas.
Formulating policy packages under such circumstances requires that the implications of the different packages be analysed through simulation models. The challenge this study has to address is thus twofold: to advance an approach for combining policies into policy packages and to advance a microsimulation model that can be used to assess the full range of implica- tions of such policy packages. Once both elements are completed, the simulation model can conceptually be used to assist in the formulation of policy packages that will be used to estab- lish strategies for sustainable mobility.
3 State of the Art
The section reviews several fields of theoretical and methodological innovation in transport analysis and modelling. It starts from a reflection on new travel and activity patterns which call for a new kind of integrated policy packages and for new microscopic methods of policy analysis. Microsimulation combined with activity-based travel analysis and spatial disaggre- gation are the core elements of this new perspective in travel analysis and modelling,
3.1 New Travel and Activity Patterns
Mobility is a basic human activity which is the outcome of the need for access to various ac- tivities such as work, personal and household management, and leisure. While the underlying generators of the need for mobility have not changed much during the last centuries, actual travel patterns are very different from days past. Our ability to explain travel behaviour and the necessity to forecast it have seen great developments during the last 25 years.
Travel patterns during the last century have increasingly been dominated by the private auto- mobile. In retrospect, the automobile was a revolutionary technology which facilitated and brought forward profound changes in human spatial behaviour. The 'horseless carriage' tech- nology literally opened new horizons by enabling mobility at higher speeds, comfort and pri- vacy, flexibility and inexpensive travel.
But it was not solely the technology that has altered mobility and accessibility. Social, demo- graphic, economic, and political processes have made the car a major agent of change during the last century. It was not until the second half of the 20th century that the environmental costs of the car were unveiled, and the downside of driving became a factor in the public de- bate on sustainable development in transport. Eventually, the growing popularity of private cars resulted in multiple negative (as well as positive) effects which called for policy inter- vention. It became increasingly clear that the private benefits of automobility exceed the so- cial costs of that technology.
Beyond the growth in vehicle fleet size, evident in both developed and developing countries, there is a significant growth in car usage as measured by vehicle-kilometres and person- kilometres travelled. In many European countries, a significant quarter to a third of all house- holds own, or have at their disposal, more than one car. Moreover, the car has assumed sev- eral roles in society, beyond that of a vehicle. It has become a source for status and pride, and an extension of the home, as so often seen in advertisements.
Other relevant trends, which warrant an improvement of analysis tools, include various social and technological processes. For example, the growing pluralism within western society calls for a discriminating factor which lies beyond the explanatory power of simple socio-economic attributes. The concept of life style, as described below, offers a basis for discriminating be- tween market segments. Another trend is that of growing potential of using 'e-travel' options as substitutes for physical travel (Salomon, 1985). Forecasting the effects of such options re- quires tools which go beyond the capacity of traditional aggregate models. Attitudes have been identified as key factors.
State of the Art 9
For many years, studies of urban transport focused on the journey to work and the key issue was the split between public and private modes. The explanatory factors were mostly eco- nomic and demographic variables. The behavioural modelling approach developed since the 1970s, in congruence with many economic analyses, relied mainly on revealed preference approaches. Such methods, however, fell short of providing insights into the growing com- plexity of travel patterns, such as car sharing, park-and-ride, kiss-and-ride or activity and trip chaining (Adler and Ben-Akiva, 1979).
Ultimately, transport and travel behaviour analyses are oriented to practical ends. However, two routes of development are implicit in research on travel behaviour. The first is oriented to the practice of transport planning and is concerned with questions of policy analysis and forecasting.
The second can be characterised as basic research aimed at developing a deeper understanding of human spatial behaviour. A clear example of this often covert dichotomy is the increased interest in variables which are not readily available or measurable.
There is a permanent wide gap between the conceptual models of behaviour and the practical planning tools which have succeeded in operationalising these theoretical advances. Wachs (1996) mentions a thirty-year gap. With the advent of theoretical developments there should be a continuous effort to translate the very latest theoretical notions into practical tools. A number of developments in travel behaviour analysis have introduced both new concepts as well as new methods designed to address the shortcomings of present techniques.
- First, there is growing utilisation of stated preference (SP) approaches. These are used mostly in cases where new alternatives are suggested which due to novelty cannot be ob- served under conventional revealed preference approaches. Another reason for using SP is to economise on data collection efforts.
- Second, microsimulation techniques are brought forward to test and forecast the impacts of exogenous trends (e.g., economic, technological, demographic etc.) and the impacts of pol- icy measures. Microsimulation can model the new travel patterns mentioned above.
- Both techniques rely on different data than the commonly used socio-demographic and eco- nomic (SDE) attributes. There is a growing interest in attitudinal data (McFadden, 2001) as a factor to explain preference and behaviour. Attitudinal data raise some measurement and forecasting problems, nevertheless, their information intensity is high.
- Third, an important assumption was adopted, that the demand for travel is a derived de- mand, emanating from the demand for activities. Hence, rather than focusing on trips, travel behaviour analysis shifted to activity analysis, where travel is assumed to be a cost to be paid as part of the participation in an activity.
- Recently, some caveats about the widely held 'derived demand' assumption were suggested.
They are based on the phenomenon of excess travel evident in a number of situations in which trips are generated or extended due to a desire to travel. Thus, people may for exam- ple travel to a farther shopping centre not because of its quality but because they derive some benefits from the longer trip – travel is found to entail a positive utility and not just a cost (Mokhtarian and Salomon, 2001). To unveil such situations, it is again necessary to dwell, among others, on attitudinal data.
Another type of explanatory factor, employed in this study, is embedded in the concept of life style. In common language, the concept relates to 'the way people live'. This assumes that there is some type of regularity in behaviour. It is argued that in fact people do make very long-term decisions on various aspects of life: involvement in work, household formation, an orientation towards leisure and an adoption of an ideology. These, combined, can be seen as the 'policy' by which an individual lives, subject of course to various constraints.
The concept of life style rests on the assumption that a comprehensive descriptor of an indi- vidual is more powerful than a series of SDE variables. The main underlying reason is that while SDE are, in most cases, correlates of behaviour, the concept of life style has a sound theoretical basis (Salomon, 1980; 1983).
Building on the two-tier choice hierarchy presented by Ben-Akiva and Lerman (1985) which distinguishes between long term 'mobility decisions' and short term 'travel decisions', life style is suggested to form a third, upper tier (Bagley and Mokhtarian, 1999). As life style may be seen as a set of long-term preferences, it can be used as a basis for market segmentation. The population is thus segmented not by simple unidimensional SED factors but by a composite variable that reflects preferences or behavioural intentions. These are affecting revealed be- haviour, except for situations where constraints are present.
3.2 Policy Packages
Sustainable development in general and sustainable transport strategies in particular are es- sentially about balancing three meta-goals: economic growth, inter-generation equity and in- tra-generation equity. Actually, the balancing of these three meta-goals has been at the centre of transport policy debate for over twenty years, though the relative importance of the goals has changed over time (Masser et al., 1992).
The new facet introduced by the concept of sustainability into the transport policy discourse has been the greater emphasis on the need to balance interests across space and between time scales. That is, it is insufficient to strike a balance at one point in time within preset adminis- trative boundaries where the inter-generation concerns are limited to the environment. Rather it is necessary to try and find a balance between the three meta-goals in a multi-generation time frame and in situations where effects cross national and administrative boundaries.
The discussion of sustainable transport has been ongoing at two different levels. At the first level the likely and desired balances between the three meta-goals are discussed. At the sec- ond level the policy measures that should be used to achieve the goals are analysed. Yet, the policy measures discussed are most often geared to address a much narrower set of concerns than those identified at the upper level. That is, the policy measures advanced are only rarely discussed in terms of all three meta-goals.
Perhaps one reason for this apparent discrepancy between discussions is that it is obvious that no single policy measure, or even narrow set of measures, is likely to address all three meta- goals, especially if they also need to cut across time and space limitations. The complexity of policy analyses that would have to address all three objectives of sustainable transport, when they are broadly defined, may thus seem indeed daunting.
State of the Art 11
Moreover, even when policy measures are analysed with respect to a narrower objective, such as reducing CO2 emissions, it is often concluded that no single measure is sufficient (Barton, 1992, for example). A common conclusion of such studies is that measures have to be com- bined in order to achieve their stated purpose. However, policy tools are often not comple- mentary. Actually, in many cases policy tools geared toward achieving one meta-goal may contradict another meta-goal. The most widely discussed case of such a contradiction is the construction of bypass roads which facilitate movement and contribute to economic growth but may have detrimental environmental and equity implications. Therefore, the combination of policy measures into policy packages is not a trivial task.
However, to date there are no systematic studies of how can (and should) such policy pack- ages be designed. Most literature on the effectiveness of various policy measures analyse a single measure or a group of similar measures (such as travel demand management tools or economic incentives, usually with in a single setting. But, as Button (1994) noted, there are fundamental differences between places in both the type and relative severity of the various environmental effects of transport and the policy options available. Thus it is not clear that the experience gained in one place is directly transferable to another. Jones et al. (1993) pointed to the fact that in Europe similar problems are often addressed by very different policy meas- ures.
A second lacuna that can be seen from the literature is the relative dearth of studies analysing the actual effects of the different policy tools. Thus, while there is much anecdotal evidence regarding may possible tools, there is often only little critical analysis of the actual potential of each tool. This is evident, for example, in the case of railways (Feitelson, 1994) and in the case of land use planning (Wegener and Fürst, 1999). In the latter case Newman and Ken- worthy (1989) have argued that higher densities reduce energy use of the transport system and the consequent emissions. However, Wegener (1996) has shown that energy prices may ex- plain the differences they found between countries. Both Wegener (1996) and Watterson (1993) in separate studies in very different circumstances found that land use controls may have only limited effect on energy use. Similar disagreement can be found regarding the ef- fects of other policy instruments. Thus, there is a need for comprehensive critical analysis of the situations and conditions under which each type of instrument may be effective.
3.3 Microsimulation
The sustainability issue, together with new technological developments and new planning policies, presents new challenges to travel demand modelling. New intermodal travel alterna- tives such as park-and-ride and kiss-and-ride, new forms of paratransit such as car-sharing, shared taxis or busses on demand and new lifestyles and work patterns such as part-time work, telework and teleshopping cannot be modelled by traditional aggregate four-step travel models. New activity-based travel models addressing these issues require more detailed infor- mation on household demographics and employment characteristics. New neighbourhood- scale travel demand management policies to promote the use of public transport, walking and cycling require more detailed information on the precise location of activities. In addition the models need to be able to predict not only the traditional transport effects, such as travel flows and congestion, but also environmental and equity impacts of transport policies, and this re- quires small area forecasts of emissions from stationary and mobile sources as well as of im- missions in terms of exposed population.
Existing travel demand models are too aggregate to respond to these challenges. The typical travel demand model with its four steps trip generation, trip distribution, modal split and ca- pacity restraint model trips but not the activities that give rise to these trips and so are unable to respond to changes in life styles, such as new living, working and leisure patterns. Moreo- ver, most travel demand models get their spatial dimension through a zonal system in which it is assumed that all origins and destinations, such as residences and work places are uniformly distributed throughout a zone. Spatial interaction between zones is established via networks linked only to the centroids of the zones. Zone-based travel demand models do not take ac- count of topological relationships and ignore that socio-economic activities and their environ- mental impacts are continuous in space.
In particular, zone-based travel demand models lack the spatial resolution necessary to repre- sent environmental phenomena other than energy consumption or CO2 emissions. To forecast air dispersion, noise propagation and surface and ground water flows requires a much higher spatial resolution. Air distribution models work with raster data of emission sources and topo- graphic features such as elevation and surface characteristics such as green space, built-up area and high-rise buildings. Noise propagation models require spatially disaggregate data on emission sources, topography and sound barriers such as dams, walls or buildings as well as the three-dimensional location of population. This implies that not only the attributes of the components of the modelled system are of interest but also their physical micro location.
These considerations suggest a fundamentally new organisation of travel demand models based on a microscopic view of human activities. The method for this new type of model is microsimulation.
Activity-based transport modelling based on principles of time-space geography (Häger- strand, 1970) originated in the 1980s but has yet failed to replace the mainstream tradition of aggregate transport modelling as represented by conventional four-step transport model para- digm. However, several concurrent developments have contributed to a significant revival of disaggregate activity-based modelling approaches in the 1990s. One development is the avail- ability of larger and more powerful computers that has overcome former barriers to handling large disaggregate data bases. A second, and more important, development is the increased attention paid to environmental aspects of transport due to the growing urgency of the envi- ronmental debate and associated legislation in many countries such as the Intermodal Surface Transportation Efficiency Act and the Clean Air Act Amendments in the United States. Envir- onment-oriented transport planning attracts attention to more complex forms of spatial be- haviour such as trip-chains, car-sharing and intermodal trips, all of which cannot be repre- sented in traditional trip-based models, and requires the analysis of environmental impacts of transport that cannot be captured by aggregate, zone-based, approaches. Finally, the rise of geographic information systems (GIS) has made more spatially disaggregate transport models at the sub-zone level possible.
Microsimulation was first used in social-science applications by Orcutt et al. (1962), yet ap- plications in a spatial context remained occasional experiments without deeper impact, though covering a wide range of phenomena such as spatial diffusion (Hägerstrand, 1968), urban de- velopment (Chapin, 1974; Chapin and Weiss, 1968), transport behaviour (Kreibich, 1979), demographic and household dynamics (Clarke et al., 1980; Clarke 1981; Clarke and Holm 1987; Holm et al., 2000) and housing choice (Kain and Apgar, 1985; Wegener, 1985; Mack- ett, 1990a; 1990b). In recent years microsimulation has found new interest because of its flexibility to model processes that cannot be modelled in the aggregate (Clarke, 1996).
State of the Art 13
3.4 Activity-Based Travel Modelling
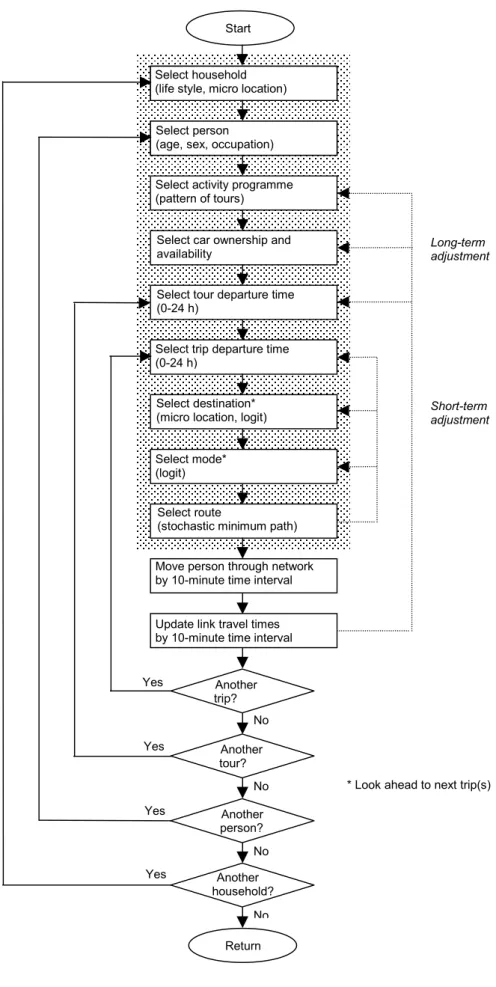
Probably the most advanced area of application of microsimulation in urban models is travel demand modelling. Disaggregate travel demand models aim at a one-to-one reproduction of spatial behaviour by which individuals choose between mobility options in their pursuit of activities during a day (Axhausen and Gärling, 1992; Ben Akiva et al., 1996, Ettema and Timmermans, 1997). Activity-based travel models start from interdependent 'activity pro- grammes' of household members and translate these into home-based 'tours' consisting of one or more trips. This way interdependencies between the mobility of household members and between the trips of a tour can be modelled as well as intermodal trips that cannot be handled in aggregate multimodal travel models. Activity-based travel models do not model peak-hour or all-day travel but disaggregate travel by time of day, which permits the modelling of choice of departure time. There are also disaggregate traffic assignment models based on queuing or cellular automata, e.g. in the TRANSIMS project (Nagel et al., 1998; Barrett et al., 1999), which reproduce the movement of vehicles in the road network with a level of detail not known before.
Disaggregate travel modelling dates back to the 1970s. Kutter (1972) defined identified 38 'behaviourally homogenous groups' defined by age, sex, socio-economic group, car owner- ship, occupation, number of children, for practical reasons aggregated to nine groups:
- children under 5 years of age - children 5-15 years of age - workers with car, male - workers without car, male - workers with car, female - workers without car, female - house wives with car - house wives without car - pensioners
Individuals from these groups were associated with activity programmes derived from travel diaries. The travel model consisted of reproducing the activity programmes of all individuals using microsimulation based on probabilities derived from the travel diaries. A typical micro- simulation of an activity programme proceeded as follows (the example is taken form the ORIENT model by Sparmann, 1980):
- Select origin zone - Select population group - Select activity programme
- Select trip (from previous destination?) - Select destination (or return to home?) - Select mode (same mode as previous trip?) - Store trip
- Another trip?
- Another person?
Similar models were developed by Kreibich (1972) and Poeck and Zumkeller (1976), Jones et al. (1980), Lenntorp (1976), Root and Recker (1983), Kitamura (1984) and Antonisse et al.
(1986) and Gunn et al. (1987). Herz (1984) derived activity programmes and time budgets from the 1982 KONTIV travel survey of Germany (see Table 3-1):
Table 3-1. Daily activity programmes and time budgets (Herz, 1984)
Persons without car Persons with car
Activity
chain Young person
Male worker
Female worker
House wife
Retired Male worker
Female worker
House wife
Retired
h 12.4 11.1 10.9 30.4 33.3 8.2 10.7 19.1 24.4
hwh hwhwh hwhsh hwhshlh hwhlh hwbwh hwsh hwswh hwlh
1.6 - - - - - - - -
54.6 1.3 5.6 - 3.3 - 1.3 - 1.5
35.2 4.4 6.5 1.5 3.6 - 5.0 1.5 -
1.4 - - - - - - - -
- - - - - - - - 1.0
31.3 4.8 3.2 - 7.5 1.4 1.2 - 1.6
25.5 4.1 5.4 1.7 6.0 - 3.7 1.7 -
2.2 - - - - - - - -
1.8 - - - - - - - - heh
heheh hehsh hehshlh hehlh hehlhlh
30.5 4.3 3,8 1,4 16,8 2,2
- - - - - -
- - - - - -
- - - - - -
- - - - - -
- - - - - -
- - - - - -
- - - - - -
- - - - - - hsh
hshwh hshsh hshshlh hshlh hshlhlh hshllh hssh
2.0 - - - - - - -
- - - - - - - -
3.9 2.9 - - - - - -
23.5 - 3.7 1.4 4.4 - - 2.3
19.8 - 1.9 - 6.1 - 2.2 -
1.3 - - - - - - -
4.4 - - - - - - -
21.8 - 3.8 - 8.0 1.8 - 2.7
14.2 - 2.1 - 6.5 - 1.2 1.4 hlh
hlhsh hlhlh hlsh
3.6 - 1.3 -
2.0 - - -
2.1 - 1.5 -
12.5 1.4 1.7 -
12.2 1.4 - -
1.6 - - -
1.7 - - -
7.8 2.4 1.9 1.5
12.2 2.0 4.1 1.4
Other 20.2 20.8 19.5 17.3 23.1 38.5 33.5 27.0 28.7
Total (%) 100 100 100 100 100 100 100 100 100
h Home w Work b Business e Education s Shop l Leisure Travel
1,038 11 - 237 12 68 74
882 436 8 3 10 27 74
959 356 10 3 25 23 64
1,299 8 - 1 43 37 52
1,277 6 1 - 37 57 62
868 375 48 1 12 51 85
980 311 11 3 22 46 67
1,260 18 3 2 47 55 55
1,194 18 29 - 39 75 85 Total (min) 1,440 1,440 1,440 1,440 1,440 1,440 1,440 1,440 1,440
State of the Art 15
Axhausen (1989) simulated activity chains for modelling the choice of parking distinguishing between primary (mandatory) and secondary activities and mode choice during trip chains constrained by the previous mode (Table 3-2).
Table 3-2. Mode choice constrained be last mode (Axhausen, 1989) Next mode
Walk Bicycle Car
driver
Car passenger
Public transport
Walk yes no no yes yes
Bicycle no (yes) yes no no (yes) no (yes)
Car driver no (yes) no yes no (yes) no (yes)
Car passenger yes no no yes yes
Last mode
Public transport yes no no yes yes
Entries in brackets indicate mode changes leaving car/bicycle at intermediate stop.
Recent approaches (Stopher et al., 1996; Kitamura et al., 1996; Ben-Akiva et al, 1996, Ben Akiva and Bowman, 1997; Shiftan 1998; Bowman et al., 1998, Gärling et al., 1998, Arentze and Timmermans, 2000) have enriched the concept of activity-based travel modelling by a multitude of concepts and refinements. State-of-the-art activity-based travel models today take account of micro location (raster cell or address), time of day, time and money budgets, intra-household interdependency of mobility decisions, habitual behaviour and learning. The TRANSIMS model (Nagel et al., 1998; Barrett et al., 1999) predicts movements of individual cars and freight vehicles. A regional cellular automata microsimulation (time-based, time in- terval one second) executes the generated trips on the transport network. Most recent models move from daily to weekly activity patterns (Doherty et al., 2000).
In other developments also longer-term non-travel decisions such as residential or workplace choice are considered in a microscopic perspective. The idea is that by modelling not only transport but all kinds of spatial behaviour in a city it becomes possible to capture the interac- tion between long-term and short term mobility decisions, i.e. between land use and transport (Salomon et al., 2002). There is a long tradition of simulation models of urban land use and transport, but these have in the past in general been aggregate zone-based models (Wegener, 1994; 1998). Today there are several microsimulation models of urban land use and transport under development in North America: the California Urban Futures (CUF) Model at the Uni- versity of California at Berkeley (Landis, 1994; Landis and Zhang, 1998a; 1988b; 2000), the Integrated Land Use, Transport and Environment (ILUTE) model at Canadian universities (Miller et al., 1998), the Urban Simulation (UrbanSim) model at the University of Washing- ton, Seattle (Waddell, 2000a; 2000b) and the 'second-generation' model of the Transport and Land Use Model Integration Program (TLUMIP) of the Department of Transportation of the State of Oregon, USA. There are only few similar projects underway in Europe, such as the AMADEUS project in the Netherlands (le Clercq et al., 2000) and the ILUMASS (Integrated Land-Use Modelling and Transportation System Simulation) project in Germany.
3.5 Spatial Disaggregation
Activity-based microsimulation transportation models require the exact spatial location of the modelled activities, i.e. point addresses as input. However, most available data are spatially ag- gregate. Micro data of households and workplaces, residences and businesses are rarely avail- able, and where they are, their use is restricted for privacy reasons.
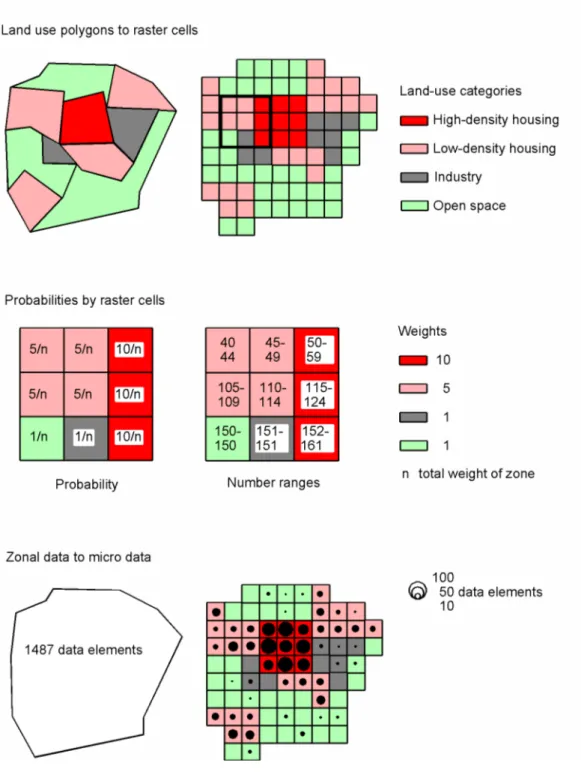
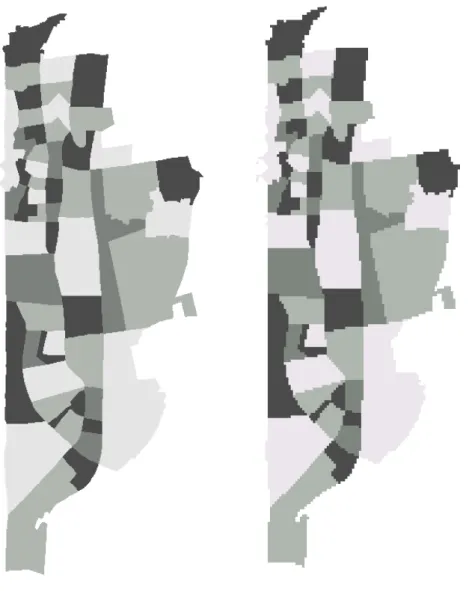
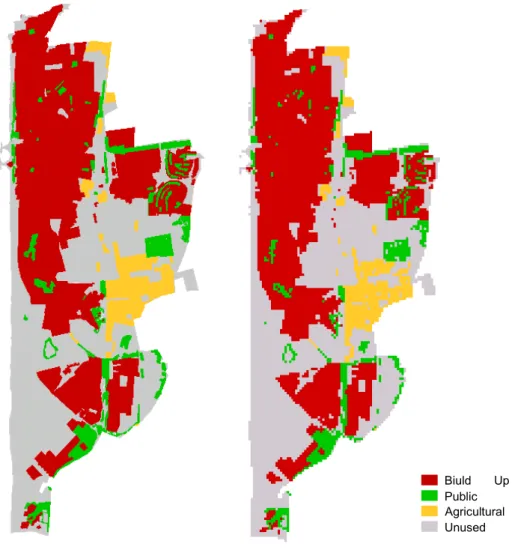
However, even where no micro data are available, GIS can be used to generate a synthetic disaggregate spatial micro database which corresponds to all known statistical distributions (Bracken and Martin, 1989, 1995; Martin and Bracken, 1991). To achieve this, raster cells or pixels are used as addresses for the microsimulation (Wegener and Spiekermann, 1996). To spatially disaggregate spatially aggregate data within a spatial unit such as an urban district or a census tract, the land use distribution within that zone is taken into consideration, i.e. it is as- sumed that there are areas of different density within the zone. The spatial disaggregation of zonal data therefore consists of two steps, the generation of a raster representation of land use and the allocation of the data to raster cells. Figure 3-1 illustrates the two steps for a simple ex- ample (Spiekermann and Wegener, 2000). The following steps are performed:
- First, the land use coverage and the coverage containing the zone borders are overlaid to get land use polygons for each zone. Then the polygons are converted to a raster representation by using a point-in-polygon algorithm for the centroids of the raster cells. As a result each cell has two attributes, the land use category and the zone number of its centroid. These cells represent the addresses for the disaggregation of zonal data and the subsequent micro- simulation. The cell size to be selected depends on the required spatial resolution of the mi- crosimulation and is limited by the memory and speed of the available computer.
- The next step merges the land use data and zonal activity data such as population or em- ployment. First for each activity to be disaggregated specific weights are assigned to each land use category. Then all cells are attributed with the weights of their land use category.
Dividing the weight of a cell by the total of the weights of all cells of the zone gives the probability that this cell will be the address of one element of the zonal activity. Cumulating the weights over the cells of a zone one gets a range of numbers associated with each cell.
Using a random number generator for each element of the zonal activity one cell is selected as its address.
The result of this procedure is a raster representation of the distribution of the activity within the zone (see Section 7).
State of the Art 17
Figure 3-1. Raster disaggregation of zonal data
4. Life Styles
Life style is an empirical concept which attempts to capture the totality of human behaviour.
It can be viewed as the sum of activities, distributed in time, space, inter-personal and intra- personal dimensions. It is a physical expression of the pattern of activities which the individu- als aspire to engage in, subject to constraints (Salomon, 1980; 1983). Life style may to some extent be correlated with socio-demographic and economic (SDE) attributes, but within a population segment identified by SDE multiple life styles may be exercised.
4.1 Life Styles in Israel
A number of prevailing life styles which are observed in Israel (and in other Western socie- ties) are described below along with the implications for the microsimulation modelling.
- Workaholics are people who are committed and devoted to work. Work constitutes for them the main life interest and little time and attention is devoted to other realms of life such as family and leisure. Workaholics are career driven, which implies that they spend a large number of hours doing work. However, this is not necessarily done at the work place. Many workaholics have facilities at home which allow them to work at home in the evening or on weekends. The strong motivation of career advancement also implies that workaholics are willing to have long journeys to work, if their households are located further away from work opportunities. Workaholics are typically upper middle class, white-collar and the phe- nomenon is independent of age, within the range of working ages. Family status also varies widely. Workaholics generate few, if any, leisure trips, and these are more likely to be on weekends. Their journey to work is likely to be early in the morning, so as to avoid peak pe- riod travel. Workaholics can be identified, in principle, either by means of attitudinal attrib- utes (not available in the current study) or by inference from behavioural patterns. This may introduce errors as some people may seem to be work oriented in a given sample day, while there conventional behaviour is different. In the Netanya case, it is suggested to make some general assumption about their share in the population.
- Yuppies (Young Urban Professionals) are a breed of people in the upper middle class who's life style can better be exercised in the central city of metropolitan areas and who are less likely to reside in suburban communities. They may be single, cohabitating or married, and in most cases without children. The reason for living in the central city is that it allows much time for leisure activities on a daily basis, immediately after work. Thus cafes, bars, discos etc. are on high demand for these. The trip making behaviour is likely to include sig- nificantly less home-bound trips than most other groups, with long days out of home. They are also likely to use private cars, but that is as much related to their income as it is to there life style 'requirements'. Not too many Yuppies are expected to be found in Netanya. There is no simple identification tag.
- Dinks (Dual Income No Kids) are households which prefer to delay the expansion of the family, usually until after some career or life style aspirations have been fulfilled. If career objectives are the cause, then these households may be similar to the above-mentioned workaholics, except that here both adult members are work-oriented. Individuals in such households typically have long working days, with one late return trip home. They may be greater consumers of services like restaurants. Dinks who have life style aspirations are
Life Styles 19
likely to be similar in activity patterns to Yuppies, except that they act as a couple rather than singles. Dinks can, in part be identified by demographic factors, but these would dis- guise such couples who are not Dinks but do not have children yet. It is suggested to make some assumption on the share of all young two-person households.
- Students is a status which may include a number of life styles in terms of the observed ac- tivity patterns. Students are likely to have diverse activity patterns, as their schedule tends to be irregular, they tend to have longer days which combine studies and leisure, and it will not be atypical for students to leave home in the morning and return home very late at night or even after midnight. Students are easily identifiable by socio-economic data in which occu- pation is listed.
- Ideologists-activists are individuals who contribute time to social or communal activities, usually on a voluntary basis. The main motivation is ideological but it may also be moti- vated by a desire for out-of-home activities for unemployed individuals. Very often women or pensioners engage in such activities. Communal voluntary activities are mostly done in the afternoon or late morning. Hence such trips are generated off-peak, and are mostly within the neighbourhood. Political activism, on the other hand, generates evening trips, probably not more than once a week and within the city. Identification can only be made by some crude assumption, applied to middle-age households.
- Family orientation. Individuals who put the family high on their agenda are likely to spend more time at home and have the home as a base for many of their trips. This means that they return from work as early as possible, and engage in family activities, both within and out- side the home. It can be assumed that when very young children are present even the out-of- home trips are likely to be non-motorised and within the neighbourhood, whereas with older children (6-12) trips are likely to be within the city and motorised. One particular point about such households (but not limited to this type) is the growing concern for safety and security of the children. This results in Israel in a growing desire by parents to drive children to their destinations (schools in the morning, other activities in the afternoon or evening).
Thus, driving parents (mothers!) are increasingly observed in family oriented households.
- SYA (Single Young Adults) include the age group 18-22, when a driver licence is obtained, and mobility is at once enhanced. This sense of independence allows SYA to explore new grounds, not only in the city but also within the whole metropolitan area. SYA are usually still residing at home, and the majority of this group serves in the military, hence its activi- ties are limited to evenings and weekends. Using the household's car, they generate many evening vehicular trips, as in most cases the marginal costs of driving is zero and there seems to be some excitement about it. Identification can be made by age alone.
4.1.1 Ethnic Religious Groups
The population of Netanya is composed of Israeli Jews of various ethnic backgrounds. The major dichotomy is between people of European descent and people of Middle Eastern de- scent. In the past, this division was well correlated with differences in socio-economic and demographic characteristics. However, as a growing part of the population is Israeli born and a number of additional trends are taking place, this distinction is becoming of lesser rele- vance, and certainly so for purposes of activity and travel analysis.
A relevant distinction may be made between religious and secular population groups. Netanya has a sizeable group of ultra-orthodox people and many other orthodox people. This parame- ter indicates some dichotomous differences and some which may be continuous. Religious people who observe all rules, do not travel by motorised transport on the Sabbath, which be- gins at sunset Friday and ends an hour after sunset on Saturday. On the Sabbath, only walk trips are made, and for relatively short distances. The distinct activity patterns of the Sabbath imply that the weekly activity pattern of orthodox people differs from that of non-orthodox people. Specifically, some activities such as long-distance travel for leisure and social activity is absent. Also, the newly emerging possibility of Saturday shopping in out-of-town shopping facilities is not observed in theses groups. Among the ultra-orthodox, three characteristics are typical: large families, low income and no or low automobile availability.
4.1.2 Demographic Trends
Two major processes of relevance to travel and activity behaviour are taking place. First, the downsizing of households and the growth in their number, and second, the growth in the share of elderly people. As households are units of production, and more importantly, consumption, the growth in the number of households implies more private vehicle ownership and more trips generated. The detailed processes and their implications for microsimulation are de- scribed below.
Demographic trends in Israel seem to follow those evident in most western cultures:
- More and smaller households. The average household size is declining as a result of a num- ber of independent processes: (i) Decline in the number of children per family. In compari- son with the 1960's, when average household size (excluding single-person households) was 4.1 persons, since 1985 the size has stabilised at about 3.85. Most households have fewer children than in earlier periods, but the mean value probably hides the fact that in some groups (particularly the ultra-orthodox), the number of children continues to be high. The implications of the decline in the number of children are that fewer trips for accompanying children are made. (ii) Increase in the number of single person households. Three types of single person households seem to be growing, but their travel impacts may be different. The three sources are: Single by choice, representing a sector of primarily young people who choose to delay the formation of a family or to remain in this status, a growing number of divorcees and a growing number of widows. (iii) Increase in the number of single parent households, as a result of child bearing outside marriage (limited number), divorce and wid- owhood. The first of these types will typically be a single mother with one child. The latter two types would have any number of children typical for the particular socio-demographic segments, but with one parent missing.
- Co-Habitation. Young adults are increasing engaged in co-habitation. Such households usu- ally consist of two persons in their twenties. In terms of household behaviour as a produc- tion-consumption system, this type of household is the most diverse. It may be just a sharing of a dwelling unit where the behaviour of the individuals is totally independent of one an- other, or, at the other extreme, it may be a family type relationship, with full dependence which is not formalised into marriage. However, co-habitation in Israel would usually not include households with children.
Life Styles 21
4.2 Life Styles in Netanya
In the Netanya model the variation in human spatial behaviour is represented by modelling different life styles. As it was shown, there is a vast and increasing diversity of life styles in the real world. For modelling life styles, concentration on a limited number of dominant life styles is desirable. The identification of dominant, transport-relevant life styles in a concrete spatial and temporal context, e.g. a city, is a complex theoretical and empirical task (including a large-scale empirical survey) that greatly exceeds the resources of the current project.
Therefore fictitious life styles based on theoretical considerations and aggregate socio- economic statistics served as substitutes for empirical derived life styles in the project. An- other problem to be solved was how to represent life styles in the simulation model. In the social sciences life styles usually are represented in the form of free-form narratives or 'sto- ries'. The story format, though open and potentially rich in content, is not suitable for mathe- matical modelling. Therefore life styles need to be translated from the open narrative format to some kind of quantitative representation which, however, should preserve as much of the variation in life styles found in reality. Such a representation is the representation of life styles as fuzzy objects.
A 'life style' in the Netanya model is a fuzzy object defined by a set of probabilistic member- ship functions. A probabilistic membership function is a vector of probabilities specifying the likelihood that individuals with a particular life style belong to a particular category of a set of classified attributes.
The probabilities of the membership functions can be found as observed frequencies in em- pirical investigations, e.g. household surveys. In the absence of such surveys (as in this proj- ect) they are determined by expert judgement and are calibrated, as far as possible, against observed aggregate distributions. The calibration is performed by microsimulation by which a fictitious spatially disaggregated population of individuals and households is generated which, as far as possible, conforms to:
- the membership functions defining each life style,
- aggregate observed distributions such as population by age and sex, - the observed spatial distribution of land use and activities by zone.
The microsimulation process is able to correct minor mismatches between the membership functions and the observed macro distributions but can be designed to issue warnings where it detects major mismatches.
Netanya was founded in 1928 as an independent resort town, which over the years, with the sprawl of the metro region, has become part of it. Given this biography, Netanya is clearly not the typical suburban community. It consists of a mix of life styles, which to a great extent represents the Israeli urban scene.
To identify the life-style based market segments in Netanya and the proxy variables which indicate membership, a small survey was conducted in which individuals had to identify four life style groups in Netanya, and to provide a short narrative description of the group. Then they were requested to provide a quantitative assessment for one of the life style groups. This pilot study was performed with the co-operation of Israeli students of geography at the He- brew University.
Some 24 students filled out the questionnaire. In total they provided 58 responses to the ques- tion requesting four life-style labels, but these referred to 41 different life styles. This large number indicates that either the respondents had not internalised the concept of life style and actually provided simple SDE variables as the relevant classification basis, or that there are many diverse life style segments in the Israeli (or Netanya) population.
An analysis of the responses suggests, based on an acquaintance with the Israeli society, that in some cases, a single variable is sufficiently powerful to discriminate a group out of the population as a life style segment. For example, being labelled as an ultra-orthodox person provides sufficient information to reveal the life style of that person. This group was men- tioned in eight out of 58 responses. However, being labelled as a member of the middle class conveys very little information about the person's or household's life style. Further analysis of the classification provided in this experiment is underway.
Figure 4-1 contains the membership functions needed to define a life style. The membership functions are displayed as empty forms to be completed by experts. To assist experts in com- pleting the forms, background information such as observed age or income distributions should be provided where possible.
The Microsimulation Model 23
Attribute 18-29 30-45 45-60 60+ Total
Age 100
Attribute None High school Training University Total
Level of education 100
Attribute Unemployed Work Household Retired Total
Labour force participation 100
Attribute Blue-collar White-collar Manager Self-employed Total
Occupation (if any) 100
Attribute 1 2 3 4 5 6+ Total
Household size 100
Attribute 1 2 3 4+ Total
Number of workers in household 100
Attribute Secular Orthodox Ultra-orthodox Total
Religious orientation 100
Attribute <5K 5-10K 10-15K >15K Total
Net household income (NIS) 100
Attribute Central area Inner suburbs Outer suburbs ... ... Total
Residential location 100
Attribute Central area Inner suburbs Outer suburbs Total
Workplace location 100
Attribute Housing Transport Other Total
Use of income 100
Attribute Work Education Leisure Total
Use of time 100
Attribute Fixed Flexible Irregular Total
Flexibility of time 100
Attribute High-rise Apartment Terrace Detached Total
Housing type 100
Attribute 0 1 2 3+ Total
Number of cars in household 100
Attribute Culture Social Sports Outdoor Total
Type of leisure 100
Attribute City Mall Local Total
Type of shopping 100
Figure 4-1. Definition of life styles
5. Policy Packages
In parallel to the development of the microsimulation model (see Section 6), it was considered which land-use and transport policies should be assessed with a model of this kind. It was clear that because of the potential synergies between policies not only single measures but comprehensive programmes of policies or policy packages should be studied.
The first stage in formulating a policy package is to identify the primary goals that it should address. These goals are a function of the way the main problems to be solved are perceived and framed (Dery, 1984).
The problems and goals are stated in general terms, such as to reduce automobile fatalities or to reduce air pollution from traffic. To address these goals they have to be defined in opera- tional terms. To this end targets defined as transport variables have to be specified. In many cases several options for addressing the goals are available. For example, CO2 emissions can be reduced by reducing the total vehicle-km driven, or by reducing the total energy use per vehicle-km or by reducing the energy use per trip (mainly by shift to a less energy-intensive mode). If the goal is specified quantitatively, such as to reduce CO2 emissions by a certain percentage, it is necessary to specify the targets in quantitative terms too, and usually to spec- ify the relative contribution to each target chosen.
Table 1 details the possible target variables that can help achieve several general goals. Yet, as it is also shown in Table 5-1, in most cases there are many measures that possibly can as- sist in achieving the specified target. The question then boils down to which instruments should actually be used under certain circumstances.
The answer to this question is a function of two main considerations: the measures' effective- ness in achieving the targets and their political acceptability. These should therefore be as- sessed as an input to any further policy packaging step. As in most cases experience within a specific location is limited, this assessment has to rely on experience from elsewhere. To this end a literature review of the actual experience with a wide variety of actions has been un- dertaken but is not reported here.
One issue not seen in Table 5-1 is the variance in the spatial and temporal scope of the differ- ent measures. As discussed elsewhere (Feitelson et al, 2001), measures can be differentiated according to their temporal and spatial dimensions. That is, for each measure the time scale necessary for it to achieve results can be assessed, as well as the spatial scale at which it can be best applied. Thus, a comprehensive policy geared to achieve a specified target should fo- cus on the spatial scale at which the problem is most manifest and be explicit about the time frame in which it is to be addressed.
In a sustainable development framework it is obvious that any policy package should assure that the response is not limited to a temporary relief. Therefore, it is necessary to specify a policy package that addresses the problem in different time frames. Table 5-1 specifies some of the policy measure options as a function of time and spatial level of implementation. Yet, even after such a spatially and temporally differentiated package has been identified, the is- sues of effectiveness and political feasibility have to be addressed. This is the focus of the framework presented here.
The Microsimulation Model 25
Table 5-1. Goals, targets and possible measures
Goals Target variables Possible measures
Reduce noise
and vibrations Reduce noise emissions at source
Reduce exposure of residences
Electric vehicles Vehicle standards Vehicle testing Quiet pavements Mufflers Noise barriers Traffic calming Prevent through traffic Land use planning Bypass roads
Divert heavy traffic away from sensitive areas Reduce CO2
emissions Reduce total km travelled
Reduce energy use per km-vehicle travelled
Reduce energy use per trip (shift modal split)
Land use planning Gasoline tax Vehicle standards Vehicle testing Gasoline tax Electric vehicles Vehicle taxes
Improve public transport service level (special lanes, better buses, improved rail services) Public transport subsidies
Land use planning
Bicycle and pedestrian lanes New public transport modes Reduce air pollu-
tion of CO
Reduce air pollu- tion of NOx
Reduce air pollu- tion of PM10
Reduce emission at source
Reduce emission per vehicle-km Reduce emission per trip
Reduce exposure
Reduce emission at source
Reduce emissions per trip
Reduce emissions at source Reduce emissions per trip
Catalytic converters Vehicle standards
Vehicle maintenance (testing) Electric vehicles
Gasoline taxes Vehicle standards
Vehicle maintenance (testing) Improved traffic flows Improved public transport Public transport subsidies Land use planning Bypass roads Electric vehicles
Better maintenance (more stringent tests)
Induce faster vehicle turnover (through changes in vehicle taxes and registration fees)
Improve public transport Improve rail services
Improve cycling (cycling lanes, parking etc.) Land use planning
Discourage use of diesel (via taxes) Land use planning
Shift public transport to electric vehicles Improve rail services
Protect open
spaces Reduce transport's footprint on land resources
Reduce visual blight Increase road efficiency
Reduce road and parking standards Encourage rail transport
Land use planning
Landscaping along transportation routes Lower road standards
Traffic management measures Reduce effects on
water resources Reduce discharge induced by transport infrastructure
Reduce effects on water quality
Reduce parking requirements Use porous asphalt
Require runoff retention and detention elements for all infrastructure projects
5.1 The Scope of Measures
In order to identify the measures' effectiveness and assess their political acceptability it is first necessary to identify their effects. This may seem straightforward. However, in many cases policy failures can be traced to a failure in assessing the full set of possible effects a measure may have.
The effects a measure may have can be analysed at different levels. The most obvious discus- sion is of their direct effects. These are often the stated goals of the policy they belong to.
However, in order to understand the full scope of effects it is also necessary to consider their distributional, behavioural and economic effects. This is especially important in the context of sustainability, as here the tradeoffs between the three meta-goals have to be addressed.
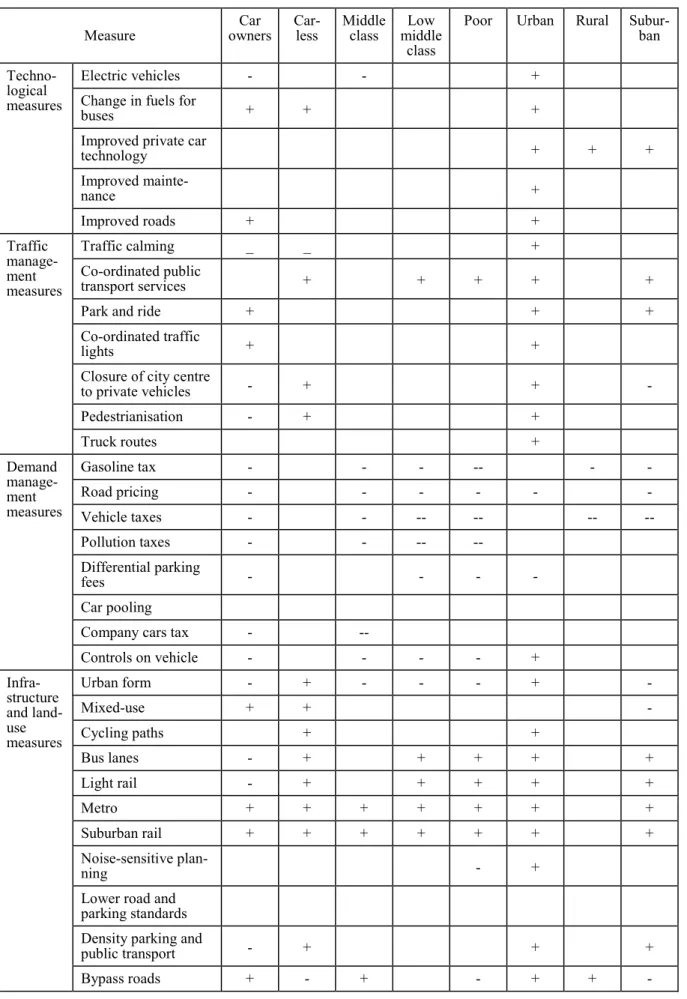
Table 5-2 specifies the general direct, distributional and economic implications of a number of measures, differentiating between technological, traffic management, demand manage- ment, and planning measures. The table does not describe the actual effects of the different measures; that has to be done by models and behavioural analyses. In the modelling part of this study such a modelling framework is developed.
However, Table 5-2 shows the range of issues raised by each measure. These are the issues that have to be discussed before the measure is accepted. Yet the acceptability of a measure is not only a function of its effects but also of the context within which it is presented. This context is often considered by transportation professionals as an exogenous variable over which they have little control. However, this is nor entirely true.
While it is undoubted that transportation professionals have only little say over the overall discourse sanctioned by mainstream society, they can effect the way in which a certain policy is presented. In particular, they can present a policy within a wider policy context, e.g. as a part of a more comprehensive policy package.
5.2 A Generic Algorithm for Policy Packaging
The development of policy packages is conceptually shown in Figure 5-1. The first part of the policy packaging algorithm follows the steps described so far. That is, after the initial goals and the subsequent set of targets are specified, the measures that can help to achieve those targets are assessed.
In the first stage these measures are combined into a package that has the potential to address the goals at all relevant time scales. This initial analysis also identifies the spatial level at which the measures can be enacted.
The importance of the spatial discussion is not only academic. Rather, it is one of the factors that determine the authority needed to enact each measure. The implications of the spatial level on the authorisation process needed are a function of the legal and institutional struc- tures.