https://doi.org/10.5194/os-13-623-2017
© Author(s) 2017. This work is distributed under the Creative Commons Attribution 3.0 License.
Determination of dissolved nitric oxide in coastal waters of the Yellow Sea off Qingdao
Chun-Ying Liu1,2,3, Wei-Hua Feng1,4, Ye Tian1, Gui-Peng Yang1,2,3, Pei-Feng Li1, and Hermann W. Bange5
1College of Chemistry and Chemical Engineering, Ocean University of China, Qingdao, 266100, China
2Laboratory for Marine Ecology and Environmental Science, Qingdao National Laboratory for Marine Science and Technology, Qingdao, 266071, China
3Key Laboratory of Marine Chemistry Theory and Technology, Ministry of Education, Qingdao, 266100, China
4Key Laboratory of Engineering Oceanography, Second Institute of Oceanography, SOA, Hangzhou, 310012, China
5GEOMAR Helmholtz-Zentrum für Ozeanforschung Kiel, 24105 Kiel, Germany Correspondence to:Gui-Peng Yang (gpyang@ouc.edu.cn)
Received: 5 March 2017 – Discussion started: 3 April 2017
Revised: 15 July 2017 – Accepted: 27 July 2017 – Published: 29 August 2017
Abstract.We developed a new method for the determination of dissolved nitric oxide (NO) in discrete seawater samples based on the combination of a purge-and-trap setup and a flu- orometric detection of NO. 2,3-diaminonaphthalene (DAN) reacts with NO in seawater to form the highly fluorescent 2,3- naphthotriazole (NAT). The fluorescence intensity was linear for NO concentrations in the range from 0.14 to 19 nmol L−1. We determined a detection limit of 0.068 nmol L−1, an av- erage recovery coefficient of 83.8 % (80.2–90.0 %), and a relative standard deviation of±7.2 %. With our method we determined for the first time the temporal and spatial distri- butions of NO surface concentrations in coastal waters of the Yellow Sea off Qingdao and in Jiaozhou Bay during a cruise in November 2009. The concentrations of NO var- ied from below the detection limit to 0.50 nmol L−1with an average of 0.26±0.14 nmol L−1. NO surface concentrations were generally enhanced significantly during daytime, im- plying that NO formation processes such as NO−2 photoly- sis are much higher during daytime than chemical NO con- sumption, which, in turn, lead to a significant decrease in NO concentrations during nighttime. In general, NO surface con- centrations and measured NO production rates were higher compared to previously reported measurements. This might be caused by the high NO−2 surface concentrations encoun- tered during the cruise. Moreover, additional measurements of NO production rates implied that the occurrence of par- ticles and a temperature increase can enhance NO produc- tion rates. With the method introduced here, we have a reli-
able and comparably easy to use method at hand to measure oceanic NO surface concentrations, which can be used to de- cipher both its temporal and spatial distributions as well as its biogeochemical pathways in the oceans.
1 Introduction
As a reactive atmospheric trace gas, nitric oxide (NO) plays important roles in tropospheric chemistry: it is a key player in the formation of acid rain and ozone (Williams et al., 1992;
Lee et al., 1997; Mazzeo et al., 2005). NO is an intermedi- ate of both the terrestrial and marine nitrogen cycle (Ward and Zafiriou, 1988; Canfield et al., 2010; Chen et al., 2010;
Thamdrup, 2012; Voss et al., 2013). It has a variety of sources in seawater, including nitrite photolysis and various micro- bial processes such as denitrification, anammox and dissim- ilatory nitrate reduction to ammonia (Law, 2001; Schreiber et al., 2012; Martens-Habbena et al., 2015). Because of its chemical reactivity, NO usually does not accumulate in large amounts in seawater and the ocean as a source of atmospheric NO is, therefore, negligible in a global context (Zehr and Ward, 2002; Bange, 2008). Moreover, NO was found to have significant effects on the growth of marine algae (Zhang et al., 2005; Liu et al., 2004, 2005, 2006, 2014). To this end, the determination of the spatial and temporal distributions of NO in the ocean, and deciphering its oceanic production processes and their major influencing factors is essential to
improve our understanding of the biogeochemical cycling of NO in the ocean.
Because of its low concentrations in seawater caused by its fast diffusion and high chemical reactivity, measurements of NO in seawater are very difficult. Therefore, there are only a few methods available to determine NO (Hetrick and Schoenfisch, 2009) (see Table 1). The electrochemi- cal method using sensors in seawater medium achieved a detection limit of 42 nmol L−1 (Xing et al., 2005; Zhang et al., 2005). Olasehinde et al. (2009) developed a method for the determination of photochemically generated NO in natural waters adopting 4,5-diaminofluorescein as a probe compound and a measurement using reversed-phase high- performance liquid chromatography (HPLC) with a fluores- cence detector. The NO concentrations and signal intensi- ties exhibited a good linearity correlation over the range of 0.025–10 nmol L−1triazolofluorescein. Zafiriou and McFar- land (1980) determined the NO concentration of seawater by using a flow system to equilibrate the seawater samples with a gas stream coupled to a chemiluminescence detector.
They report an analytical precision of±3 % and an accuracy of ±20 %. More recently, Lutterbeck and Bange (2015) de- veloped an improved method of a chemiluminescence NO analyzer connected to a stripping unit, and the limit of de- tection was 0.25 nmol L−1 using a 20 mL seawater sample volume. Until now only these two chemiluminescence meth- ods have been applied successfully to determine NO con- centrations in seawater samples. The N-nitrosation of 2,3- diaminonaphthalene (DAN) results in the highly fluores- cent 2,3-naphthotriazole (NAT), which could be used to de- tect NO concentrations as low as 10 nmol L−1(Miles et al., 1995). We adopted this method for seawater medium instead of NaOH medium and the calibration curve exhibited linear- ity over the concentration range of 1.4–1400 nmol L−1NO (Liu et al., 2009). However, this assay cannot be used to de- tect trace levels of NO in seawater samples directly.
In this paper, we describe a modified spectrofluorometric method using a purge-and-trap technique, which can be used to quantify NO in seawater samples. This method was ap- plied in a first field study on the distribution and production rates of dissolved NO in coastal waters of the Yellow Sea off Qingdao and Jiaozhou Bay.
2 Materials and methods 2.1 Instrumental setup
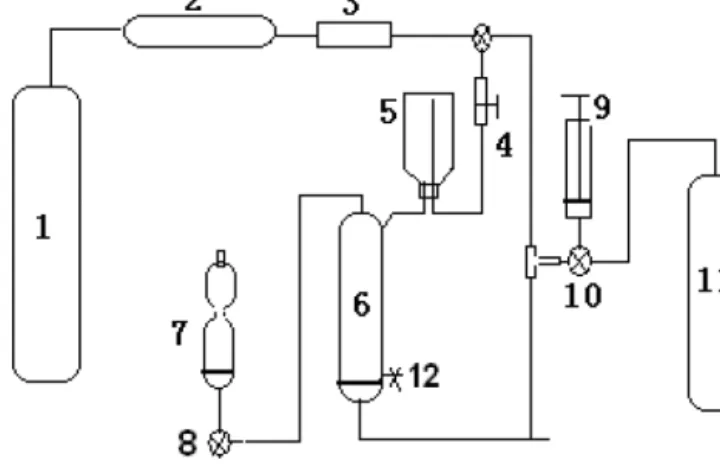
The analytical system (Fig. 1) consists of a degassing col- umn to purge NO from seawater samples, a reaction chamber where NO reacts to form a fluorescent compound, and a flu- orescence spectrophotometer (F-4500, Hitachi Co., Japan).
The 800 mL degassing column (6) has a sodium silicate bonded sand core at the bottom to disperse the nitrogen (N2) purge gas stream. There are four ports on the column: (a) a
Figure 1.The purge-and-trap system for the determination of dis- solved nitric oxide in seawater. The components include N2 gas (1), deoxygenation tube (2), glass rotameter (3), 2-port valve (4), sam- ple vial (5), degassing column (6), reaction chamber (7), 3-port valves (8 and 10), gas-tight syringe (9), NO standard gas (11), and drain port (12).
gas port at the bottom of the degassing column where the high-purity N2 purge gas (1) (99.999 %, Qingdao Heli In- dustry Gas Center, China) or a NO standard gas mixture (11) (5.4 ppmv, NO/N2)(Beijing Sida Standard Substance Co., China) is introduced, (b) a drain port (12) as outlet for water samples, (c) an inlet port where water samples (5) are pushed into the degassing column with N2via a two-port valve (4), and (d) an outlet port on the top of the degassing column con- nected with the reaction chamber (7) via a three-port valve (8).
The NO standard gas cylinder is linked to the degassing column via a gas-tight syringe (9) (Shanghai Anting Injec- tor Co., China). The N2gas cylinder is connected to the de- gassing column via a deoxygen tube (2) (Agilent Technolo- gies, USA) to remove traces of O2and a glass rotameter (3) to monitor the gas flow (0.1–1 L min−1, Jiangyin, China).
These two gas streams enter the degassing column via the port at the bottom of the flask, controlled by a three-port valve (10). The tubing used is made of polytetrafluoroethy- lene (PTFE, tubing 1/8 in. outer diameter). Moreover, an ultraviolet–visible spectrophotometer (UV-2550, Shimadzu Co., Japan) and an automatic analytical balance (Beijing Sar- torius Co., China) were used in this work.
The degassing column, reaction chamber, and the syringe were degreased with organic solvents and rinsed several times with methanol and distilled water in order to mini- mize potential contamination and adsorption effects. The de- gassing column was initially cleaned with detergent, rinsed with water, acetone, methanol, and distilled water and then treated for 30 min with 10 % (v/v) HCl in an ultrasonic bath, followed by rinsing with distilled water. Subsequently, those parts of the setup which come into contact with the sam- ple solutions were rinsed with methanol, water, HCl solu-
tion, and dilute NaOH solution. No significant difference was found from the test of the setup loaded with a water sample and without a water sample (dry run).
2.2 Preparation of DAN and NO solutions
A 2,3-diaminonaphthalene (DAN, ≥95 %, GC, Sigma- Aldrich Chemical Co., USA) stock solution was prepared fresh with a concentration of 10 mmol L−1 in dimethylfor- mamide (Sigma-Aldrich Chemical Co., USA) and kept in the dark at −21◦C until used. DAN solutions of 40 µmol L−1 were prepared from the stock solution in Milli-Q water, 10 mmol L−1 NaOH aqueous solution, and filtered natural seawater. Natural seawater was sampled from the coastal wa- ters off Qingdao and was filtered through a 0.45 µm acetate cellulose membrane (Millipore, USA). The DAN solutions were purged with N2gas for 30 min to remove oxygen (O2), then stored on ice and transferred to a refrigerator at 4◦C before use.
An aliquot of 10 mL Milli-Q water was bubbled with N2
gas at a flow of 10 mL min−1 for 1 h to remove O2 after 10 min of ultrasonic degassing. The solution was then bub- bled with high-purity NO gas (99.9 %, Dalian Date Gas Ltd., China) for 30 min. The concentration of the saturated NO stock solution was 1.4 mmol L−1, which could be used within 3 h (Lantoine et al., 1995). A series of diluted NO so- lutions were prepared in N2-purged water from the NO stock solution using a syringe (Xing et al., 2005).
2.3 Fluorometric detection of NO
DAN reacts with NOx (NO+NO2) in an al- kaline medium and thus forms the highly flu- orescent 2,3-naphthotriazole (NAT) as follows:
6
A 2,3-diaminonaphthalene (DAN, ≥ 95%, GC, Sigma-Aldrich Chemical Co., USA) stock solution 125
was prepared fresh with a concentration of 10 mmol L-1 in dimethylformamide (Sigma-Aldrich Chemical 126
Co., USA) and kept in the dark at -21°C until used. DAN solutions of 40 μmol L-1 were prepared from 127
the stock solution in Milli-Q water, 10 mmol L-1 NaOH aqueous solution and filtered natural seawater, 128
respectively. Natural seawater was sampled from the coastal waters off Qingdao and was filtered through 129
a 0.45 μm acetate cellulose membrane (Millipore, USA). The DAN solutions were purged with N2 gas 130
for 30 min to remove oxygen (O2), then stored on ice and transferred to a refrigerator at 4°C before use.
131
An aliquot of 10 mL Milli-Q water was bubbled with N2 gas at a flow of 10 mL min-1 for 1h to 132
remove O2 after 10 min of ultrasonic degassing. The solution was then bubbled with high purity NO gas 133
(99.9%, Dalian Date Gas Ltd, China) for 30 min. The concentration of the saturated NO stock solution 134
was 1.4 mmol L-1, which could be used within 3h (Lantoine et al., 1995). A series of diluted NO 135
solutions were prepared in N2-purged water from the NO stock solution using a syringe (Xing et al., 136
2005).
137 138
2.3 Fluorometric detection of NO 139
DAN reacts with NOx (= NO + NO2) in alkaline medium, thus forms the highly fluorescent 140
2,3-naphthotriazole (NAT) as follows:
141
142
The reaction of NO and O2 with 2,3 diaminonaphthalene (DAN) produced a fluorescent triazole.
143
Although the mechanism of this fluorescence has not yet been established in detail, the fluorescence was 144
reported to increase dose-dependently by NO addition (Nakatsubo et al., 1998). In seawater samples, the 145
NH2 NO OH-
N-NO
| H
N=N—OH
NH2
NH N N -H2O 2,3-Diaminonaphthalene (DAN)
2,3-Naphthotriazole (NAT)
NH2 NH2
The reaction of NO and O2with 2,3-diaminonaphthalene (DAN) produced a fluorescent triazole. Although the mech- anism of this fluorescence has not yet been established in detail, the fluorescence was reported to increase dose- dependently by NO addition (Nakatsubo et al., 1998). In sea- water samples, the concentration of O2 (10−4 M order of magnitude) was far higher than that of NO (10−10 Morder of magnitude). Both of them were stripped out and reached the DAN solution finally; thus, the NO in samples could al- most quantitatively transform into NAT. Based on this reac- tion, a fluorometric method was originally developed for the
detection of NO in oxygenated media (Misko et al., 1993;
Miles et al., 1995) and has been adapted to detect NO in sea- water medium instead of aqueous NaOH medium. Our ex- periments showed that the DAN solution was stable for 12 h and the NAT solution did not change within 4 h. The wave- length for NAT excitement is 383 nm and the NAT emission is monitored at a wavelength of 410 nm (Liu et al., 2009).
2.4 The influence of nitrite in seawater on the reaction of DAN and NO
NO can be formed from nitrite (NO−2)in seawater (Zafiriou and McFarland, 1981). Therefore, we tested a potential inter- ference of dissolved NO−2 by adding different concentrations of NO−2 to seawater samples. The tests were conducted in the dark or with ultraviolet B (UV-B) radiation (HR 1×18w, Xinghui Electric Instrument Factory, China). The final con- centrations of NO−2 in the seawater samples were set to 40, 80, 120, 160, and 200 µmol L−1, and the reaction time was 1 or 12 h.
2.5 Sampling and analysis
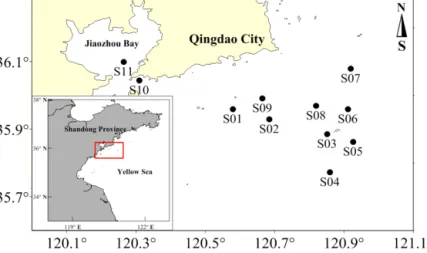
Sampling was conducted aboard the R/VDong Fang Hong 2on a cruise to the coastal waters off Qingdao and Jiaozhou Bay from 4 to 6 November 2009. The locations of sampling stations are shown in Fig. 2. The surface seawater samples were collected from a depth of 1 m at 11 stations using 8 L Niskin bottles mounted on a Sea-Bird CTD rosette (Sea-Bird Electronics, Inc., USA). A time-course observation of 24 h was carried out at station S10 near the mouth of Jiaozhou Bay (see Fig. 2).
A 500 mL Wheaton glass serum bottle was rinsed with the seawater three times before it was filled with seawa- ter quickly through a siphon. When the overflowed sample reached the half volume of the bottle, the siphon was with- drawn rapidly and 0.5 mL of saturated HgCl2 solution was added to stop biological activities and the bottle was sealed quickly. All glass bottles were covered with aluminum foil to prevent NO−2 photolysis during sampling.
Because NO reacts with O2 both in the gas phase and in aqueous solution, we purged our setup for 1 h with N2gas and sealed it before the measurements. In a first step, a cer- tain amount of standard NO gas was transferred to the reac- tion chamber via the degassing column by injecting it from a gas-tight syringe into the N2carrier gas stream. In the reac- tion chamber NO reacts with the DAN solution. After the measurement of the NO gas standard, a 500 mL seawater sample was injected into the degassing column and purged with N2 gas and immediately transferred into the reaction chamber where it reacts with 10 mL of DAN solution. The gas flow was controlled to ensure that the reaction of NO with the DAN solution was completed. Finally, the fluores- cence intensity of the resulting NAT solution was measured with the F-4500 fluorescence spectrophotometer.
Figure 2.Locations of the sampling stations in the coastal waters off Qingdao and Jiaozhou Bay.
Table 1.The methods for NO detection in seawater.
Method Linearity range Detection limit Analytical Reference
(nmol L−1) (nmol L−1) precision
Microelectrode 140–9900 140 0.24 % Zhang et al. (2003)
Microelectrode 1.4–1400 0.42 6.30 ‰ Xing et al. (2005)
Microelectrode 0.4–4000 30 – Schreiber et al. (2008)
Fluorescence 1.4–1400 1.4 1.63 % Liu et al. (2009)
HPLC with fluorescence 0.025–10 0.025 3–5 % Olasehinde et al. (2009)
Purge-and-trap with chemiluminescence – 0.0015 3 % Zafiriou and McFarland (1980) Purge-and-trap with chemiluminescence – 0.25 3–25 % Lutterbeck and Bange (2015)
Purge-and-trap with fluorescence 0.14–19 0.068 7.2 % This study
In order to prevent NO photochemical generation, the en- tire glass parts were wrapped with aluminum foil. The purge- and-trap procedure was conducted at a room temperature of 20◦C.
2.6 O2, nutrients, DOC, and chlorophylla measurements
Dissolved O2(DO) concentrations were determined accord- ing to the Winkler method. The concentrations of dissolved nitrate, nitrite, and ammonia were measured by using an Au- toAnalyzer 3 (SEAL Analytical, USA). The detection lim- its of the method were 0.003, 0.015, and 0.040 µmol L−1 for nitrate, nitrite, and ammonia, respectively, with the pre- cision less than 1 %. The intensity of sunlight was moni- tored by the use of a TES-1322A actinometer (Taishi Co., Taiwan). Dissolved organic carbon (DOC) was determined by a high-temperature combustion method using a Shimadzu TOC-5000 analyzer with an Al–Pt catalyst (Shimadzu Co., Japan). The precision of the DOC measurements was less than 2 %. Concentrations of chlorophyll a were measured with a bbe cuvette fluorometer (bbe-Moldaenke GmbH, Kiel, Germany).
2.7 NO production rates
Experiments for NO production by NO−2 photolysis were conducted at station 10 as follows: aliquots of 10 mL un- treated seawater samples from a depth of 0.2 m or Milli- pore membrane (0.45 µm) filtered samples were distributed into three 14 mL glass vials. The initial concentrations of NO−2 and DOC in seawater were 0.75 µmol L−1 and 439 µmol L−1C, respectively. Then 200 µL of 20 % NaN3so- lutions (instead of saturated HgCl2solution to avoid contam- ination by the photosensitive Hg) and 20 µL of 1 mmol L−1 DAN solutions were added. The vials were sealed with rub- ber septa and aluminum crimp tops, and were exposed to sunlight on the deck at ambient temperature (17◦C) or at 13±2◦C in a water bath supplied with the ambient seawater.
For “dark” controls, vials were wrapped in aluminum foil.
The intensity of sunlight ranged from 67 565 to 71 500/,lx (average: 69 430 lx). After irradiation by sunlight for 30 min, the NO concentrations were measured with the method de- scribed above. The NO photolysis production rates were computed based on the time-dependent difference between the NO concentrations before and after irradiation.
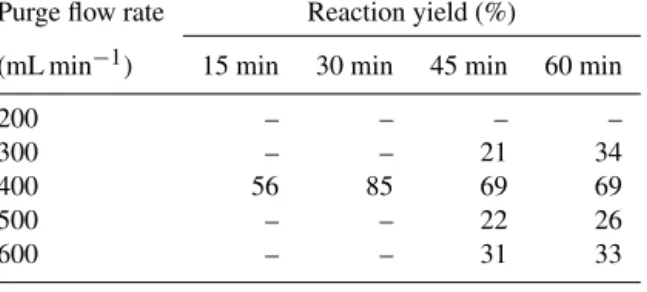
Table 2.Reaction yields of the reaction of DAN with NO at differ- ent flow rates and purge times.
Purge flow rate Reaction yield (%)
(mL min−1) 15 min 30 min 45 min 60 min
200 – – – –
300 – – 21 34
400 56 85 69 69
500 – – 22 26
600 – – 31 33
We also measured NO production rates in natural seawater at station 10. Three transparent polyethylene buckets (3.5 L) were filled with the surface seawater from a depth of 0.2 m.
The buckets were exposed to sunlight in the water bath on deck. The experiment began at 08:30 LT (local time) and the NO production rates and chlorophylla concentrations were concurrently measured at 2 h intervals. An aliquot of 10 mL of sample was collected from each bucket using a glass sy- ringe, distributed and sealed in a 14 mL glass vial, and then incubated under the same conditions as the bucket samples.
Three vials per sample were used in the experiments. After 30 min of incubation, solutions of 20 µL DAN (1 mmol L−1) were injected into the vials. Finally, concentrations of NO were detected and NO production rates were calculated.
3 Results and discussion 3.1 Method evaluation
NO is a conceptually important intermediate in N-cycle bio- geochemistry, a product of ocean photochemistry, and a puta- tive intercellular signal molecule. Unfortunately, our knowl- edge of oceanic NO distribution and the major pathways of NO is very poor. There are only a few published NO concen- tration measurements available because a reliable and easy to use method to determine dissolved NO at in situ concen- trations in seawater samples is missing. We tried to find a promising method that is both convenient for laboratory and in situ observations with high sensitivity.
Both the purge time and flow of the purge gas (N2)signif- icantly influence the yield of the NO+DAN reaction and thus, the overall purge efficiency (see Table 2). The opti- mal (i.e., maximum) reaction yield was 85 % after 30 min of purging at a flow of 400 mL min−1. The error of these mea- surements (in triplicate) was in the range of 8–25 %. As the measuring scheme is possibly not optimal yet, we may repeat the measurements with purge flow rates between 350 and 450 mL min−1, especially around 400 mL min−1. It might be possible to obtain even better results with fine tuning.
The setup was tested for internal NO production or loss by comparing the fluorescence intensity from NO-free gas or NO calibration gas passing through the degassing column
with the fluorescence intensity from the same gas bypass- ing the degassing column. This procedure was repeated with both a dry degassing column and a moistening degassing col- umn (by a minimum amount of filtered seawater). Neither NO production nor NO loss by adsorption was observed in the setup in all test runs.
Seawater samples from coastal waters off Qingdao were analyzed in the lab up to seven times and gave a relative stan- dard deviation of±7.2 %. The detection limit of our method was determined to be 0.068 nmol L−1(S/N=3), which is lower than most of the reported detection limits for NO mea- surements in seawater (see Table 1)
The NO recovery coefficient of our purge-and-trap system was estimated by the addition of the same volume of a NO standard solution to (i) 500 mL of NO-free seawater in the degassing column and (ii) 10 mL of DAN solution (with a DAN concentration of 40 µmol L−1)in the reaction chamber.
The recovery coefficient (RC) of NO was calculated accord- ing to the following:
RC(%)=NO(sw)/NO(DAN)×100 %,
where NO(DAN) stands for the NO directly injected to the DAN solution and NO(sw) stands for the NO measured from the sample in degassing column according to the method de- scribed above. The rate law obtained from the oxidation of NO is
−d[NO]/dt=4k[NO]2[O2],
withk=2×10⁶M−2s−1. The reaction of NO with O2could consume NO in the stripping period. The NO recovery co- efficients of the purge-and-trap system were evaluated and ranged from 80.2 to 90.0 %, with an average of 83.8 %. Fur- thermore, three replicates of in situ seawater were measured using our system and method; the aqueous NO solution did not change within 1 h, which was also demonstrated by Lut- terbeck and Bange (2015).
In order to check the linearity of our method, a 10 mL so- lution of 40 µmol L−1 DAN was injected into the reaction chamber and purged with N2 gas at a rate of 10 mL min−1 for 5 min prior to the actual measurements. A series of NO- free seawater samples placed in the degassing column were spiked with different volumes of the NO standard gas (mix- ing ratio 5.4 ppmv NO/N2)and analyzed according to the procedure described above. The resulting fluorescence inten- sity was linear with the NO concentrations in the range from 0.14 to 19.0 nmol L−1 (y=7.4286x+0.6188,R=0.9976, P <0.0001) (Fig. 3).
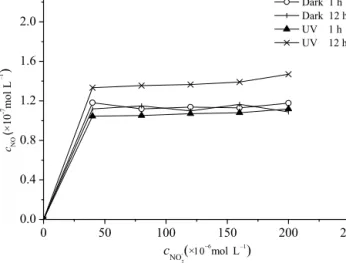
The results of the samples spiked with varying concen- trations of dissolved NO−2 are given in Fig. 4. The blank had no signal when measured with the fluorescence spec- trophotometer after UV-B irradiation or after being left in the dark; that is, the NO concentrations were zero. Nitrite did not cause significant problems with natural samples dur- ing the measurement process. In general, samples with the
0 5 10 15 20 0
20 40 60 80 100 120 140
NO (nmol L-1)
Relative fluorescence intensity
Figure 3.Relationship between nitric oxide concentrations and flu- orescence intensities.
same NO−2 concentration showed higher fluorescence when UV irradiated or kept in the dark for 12 h compared to sam- ples under short-term (i.e., 1 h) UV irradiation or kept in the dark. This points to a significant NO production under UV irradiation (n=5, F =76.13,p=2.32×10⁻⁵)and (albeit weaker) NO dark production from NO−2. Higher NO−2 con- centrations resulted in a slight increase in fluorescence when irradiated. Therefore, we conclude that the measurements of NO should be done in the dark as soon as possible after sam- pling when high NO−2 concentrations occur. Here, these high NO−2 concentrations were used to demonstrate no obvious ef- fect caused by NO−2 on the detection method; thus, low con- centrations of NO−2 also do not affect this method. On the other hand, the fluorescence intensity could not be detected with low concentrations of NO−2.
To assess the influence of the interferences of dissolved or- ganic matter, trace metals, nutrients, and other substances in seawater, the NO–fluorescence intensity relationship should be determined when the method is applied in different oceanic regions.
With our method, we are able to detect > 0.068 nmol L−1 NO in discrete seawater samples with a volume of 500 mL.
With a larger degassing column, even lower concentrations of NO might be determined.
A U-shaped tube and cold bath (i.e., a water trap) was ini- tially placed between the degassing column and the reaction chamber in order to eliminate small amounts of water carried by the N2 gas stream. However, we found that the fluores- cence intensities did not show significant differences when the water trap was removed.
0 50 100 150 200 250
0.0 0.4 0.8 1.2 1.6 2.0
cNO-
2
(×mol L )
cNO(×10-7 molL
Dark 1 h Dark 12 h UV 1 h UV 12 h
–1
)–1
Figure 4.The fluorescence variations of NAT in seawater with dif- ferent concentrations of nitrite in the dark or under UV-B radiation.
S01 S02 S03 S04 S05 S06 S07 S08 S09 S10 S11 0.0
0.1 0.2 0.3 0.4 0.5
0.6 22:5001:0207:16 08:5811:2612:5715:3817:06 21:0015:00
D.L.
NO (nmol L-1 )
Station D.L.
20:55
Sampling time
Figure 5.The concentrations of NO in the surface water off Qing- dao and Jiaozhou Bay.
3.2 Distribution of dissolved NO in coastal waters of Qingdao
Figure 5 shows the NO concentrations of surface seawater in coastal waters off Qingdao (stations S01–S09) and in the Jiaozhou Bay (stations S10 and S11). The concentrations of NO ranged from below the detection limit (D.L., stat. 02 and 03) up to 0.50±0.01 nmol L−1(stat. S08), with an over- all mean of 0.26±0.14 nmol L−1. It is noteworthy that the higher NO concentrations seem to be related to the time point of sampling (given in local time, LT): samples of stations S02 and S03 were collected at nighttime at 22:30 and 00:50 LT, respectively, while samples for stations S05, S06, S07, and S08 were collected during the daytime (08:58–15:38 LT).
(Stations S09 and S10 have been measured in Jiaozhou Bay and, thus, their NO concentrations are not directly compara-
5.28 5.32 5.36
4 6 8
06:00 09:00 12:00 15:00 18:00 21:00 00:00 03:00 06:00
0.0 0.4 0.8 0.4 0.8 1.2 0.0 1.5 3.0
0 4 8 DONO3-NONO2-NH4+I.I.
Time
Figure 6.The diurnal variations in NO concentrations and related parameters in the surface seawater at station 10.
1.3 1.35 1.4 1.45 1.5 1.55 1.6
1 2 3
NO production rate/10-12 mol L-1s-1
Different treatments
Figure 7.The production rates of NO by seawater irradiation under natural light after different treatments. Treatment 1 is seawater irra- diation at an ambient temperature of 17◦C, treatment 2 is 0.45 µm Millipore filtered samples, and treatment 3 is the incubation of non- filtered samples in a water bath at 13◦C.
ble with the stations off Qingdao.) Our results are generally consistent with the findings in the aquatic ecosystem of Daya Bay in China (Zhang et al., 2006) and the nitrite-rich surface waters of the central equatorial Pacific Ocean (Zafiriou et al., 1980), indicating that sunlight could be a main factor affect- ing NO formation in seawater. The concentrations of NO in coastal surface waters off Qingdao were found to be an order of magnitude higher than those in surface waters during day- time in the central equatorial Pacific Ocean (0.05 nmol L−1) (Zafiriou et al., 1980; Zafiriou and McFarland, 1981). This
0.00 0.50 1.00 1.50 2.00 2.50 3.00
8:30 10:30 12:30 14:30 16:30 18:30
NO production rate/10-12 molL1s-1
Time
1 1.1 1.2 1.3 1.4 1.5 1.6 1.7 1.8
8:30 10:30 12:30 14:30 16:30 18:30
Chlorophyll a (µ g L-1)
Time
0 20 000 40 000 60 000 80 000 100 000 120 000
8:30 10:30 12:30 14:30 16:30 18:30
Illumination intensity/lux
Time
-
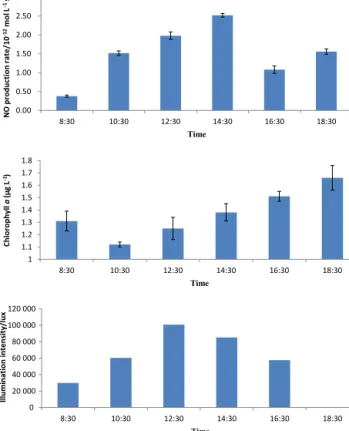
Figure 8.The variation in NO production rates, chlorophyllacon- centrations, and sunlight intensities in the incubation experiments using Qingdao coastal water.
difference is probably related to the concentrations of NO−2 in seawater. Zafiriou et al. (1980) proposed that sunlight pho- tolyzes NO−2 in surface water by the following reaction:
NO−2 +H2O−→hv NO+ qOH+OH−.
According to the reaction above, high concentrations of NO−2 together with strong solar irradiation could cause enhanced concentrations of NO in seawater. The sun- light intensity of the central equatorial Pacific is generally higher than that of coastal waters off Qingdao (located at 36◦050N); however, the coastal waters off Qingdao at the time of our measurements exhibited an average NO−2 con- centration of 0.49±0.25 µmol L−1, which was much higher than that observed in the central equatorial Pacific Ocean (∼0.1 µmol L−1).
NO is a short-lived intermediate of various microbial pro- cesses of the nitrogen cycle, which is involved in denitrifi- cation (Kampschreur et al., 2007), anammox (Kartal et al., 2011), and archaea ammonia-oxidizing processes (Martens- Habbena et al., 2015). Zafiriou and McFarland (1981) ana- lyzed NO in seawater samples at the sea surface of the cen- tral equatorial Pacific by stripping NO into an air and N2 stream by passing it through the chemiluminescence-type detector. Thus, the NO concentrations were underestimated
to some extent because seawater samples were suboxic or anoxic. However, time-dependent losses from microbial pro- cesses were minimized. Lutterbeck and Bange (2015) im- proved the method above to determine dissolved NO in dis- crete seawater samples of the eastern tropical South Pacific Ocean. The contamination by O2diffusion into the continu- ous samples could be further minimized. This work was also designed to detect dissolved NO in discrete seawater samples with a combination of a purge-and-trap setup and a fluoro- metric NO analyzer. The HgCl2solution was added to stop biological activities during the stripping. However, the dis- posal of these Hg-contaminated solutions is a tough proposi- tion. To improve the method, the purge-and-trap setup could be modified and the stripping time could be reduced, then the addition of HgCl2solution may be removed in the future.
The diurnal variation in NO concentrations and other pa- rameters in surface seawater for station 10 are shown in Fig. 6. Concentrations of NO presented a significant diurnal variation within 24 h. The peak value appeared at 15:00 LT with a concentration of 0.81 nmol L−1. After that, the con- centration of NO decreased with time gradually until a min- imum value occurred at 03:00. Obviously, the concentration of dissolved NO at this station was influenced by the in situ sunlight intensity. However, the maximum NO concentration appeared not at 12:00 but at 15:00 LT, which suggested that there were other influencing factors besides sunlight irradia- tion.
3.3 NO production rates in coastal waters
The results of the NO irradiation experiments are given in Fig. 7. The production rate of NO through seawater ir- radiation was 1.52×10⁻¹²mol L−1s−1, which is slightly higher than the NO production rate of the 0.45 µm Milli- pore filtered samples (1.46×10⁻¹²mol L−1s−1). The dif- ference may indicate that particles in seawater could in- crease the NO production rate. The non-filtered samples incubated in the water bath had a lower NO production rate (1.44×10⁻¹²mol L−1s−1)compared to the other non- filtered treatment, which could be ascribed to the difference of the temperature. The ambient temperature and water bath were 17 and 13◦C, respectively; thus, the higher tempera- ture may have resulted in a higher photolysis rate. The pho- tochemical production rates of NO in Qingdao coastal wa- ters during the daytime were generally higher than those reported from the central equatorial Pacific Ocean (0.4–
1.2×10⁻¹²mol L−1s−1)(Zafiriou and McFarland, 1981).
Previous experiments about NO−2 photolysis were also carried out in our laboratory (Li et al., 2011): the pro- duction of NO was observed after 3 h illumination of 10–
100 µmol L−1NO−2 solutions in Milli-Q water. There was an increasing trend of NO concentrations with the NO−2 con- centrations. For natural seawater, it was observed to have an increasing trend of NO concentration with the illumination time (Li et al., 2011). The process of sunlight photolysis of
NO−2 in surface water was demonstrated, which was consis- tent with the results of Zafiriou et al. (1980) and Olasehinde et al. (2009).
The production and consumption of NO occur syn- chronously when sunlight photolyzes natural seawater. Dur- ing the photolysis of NO−2, mainly NO and OH are pro- duced. On the other hand, the loss of NO happens by forming NO-reactive radicals from coloured dissolved organic matter (CDOM) (Zafiriou et al., 1990; Zafiriou and Dister, 1991;
Olasehinde et al., 2009). The concentration of NO after ex- posure to sunlight is a balancing of this production against consumption by radical recombination. The study area has high concentrations of DOC and is rich in CDOM (Liu et al., 2010; Yang et al., 2011). Light might also induce NO losses by forming NO-reactive radicals from CDOM in irradiated waters during the irradiation experiments. Thus, the authen- tic NO resulting from NO−2 photolysis was underestimated.
The photochemical production rates of NO were only a total value of production and consumption in this study.
The on-deck incubation experiments for the produc- tion rates of NO in Qingdao coastal waters, together with chlorophyll a concentrations and sunlight intensities, are shown in Fig. 8. The production rates of NO exhibited a clear variation during the course of the day with a max- imum value appearing at 14:30 LT. The maximum value of 2.52×10⁻¹²mol L−1s−1 was about 7-fold higher than the minimum value at 08:30 LT. The production rates of NO kept an increasing trend from 08:30 to 14:30 LT.
The mean production rate in Qingdao coastal waters was 1.51×10⁻¹²mol L−1s−1 during the day. The variation in the production rates of NO did not follow the trends in chlorophylla concentrations and solar radiation. Therefore, the production pattern of NO in marine environments de- serves further research.
4 Summary
For the determination of NO concentrations in discrete sea- water samples we developed a new method by combining a purge-and-trap setup with fluorometric detection of NO. The method showed a linear fluorescence intensity for NO con- centrations ranging from 0.14 to 19 nmol L−1. The detection limit is 0.068 nmol L−1(S/N=3), the average recovery co- efficient is 83.8 % (80.2–90.0 %), and the relative standard deviation is ±7.2 %. Our method was applied to measure concentrations of NO in the surface layer of the coastal wa- ters off Qingdao and Jiaozhou Bay. NO concentrations var- ied from below the detection limit to 0.50 nmol L−1, with an average of 0.26±0.14 nmol L−1. The concentrations of NO in coastal waters off Qingdao were an order of magnitude higher than those in surface waters of the central equato- rial Pacific. NO surface concentrations were generally en- hanced significantly during daytime, implying that NO for- mation processes such as NO−2 photolysis are much higher
during daytime than chemical NO consumption, which, in turn, leads to the observed significant decrease in the NO concentrations during nighttime. The measurements of NO production rates showed that the occurrence of particles and an increase in temperature can enhance NO production.
We conclude that our method can be applied to measure (i) NO concentrations in the ocean surface, (ii) NO pro- duction and consumption pathways in oceanic waters, and (iii) NO production rates in biological culture experiments.
Data availability. No data sets were used in this article.
Competing interests. The authors declare that they have no conflict of interest.
Acknowledgements. We thank Li Tie and Zhu Chenjian for their assistance during sample collection. This research was supported by the National Natural Science Foundation of China (no. 41676065), the National Key Research and Development Program of China (grant no. 2016YFA0601301), the Fundamental Research Funds for the Central Universities (no. 201564015), and Aoshan Talents Program supported by Qingdao National Laboratory for Marine Science and Technology (no. 2015ASTP). We also thank two anonymous reviewers for their constructive comments, which greatly improved the manuscript.
Edited by: Mario Hoppema
Reviewed by: two anonymous referees
References
Bange, H. W.: Chapter 2 – Gaseous Nitrogen Compounds (NO, N2O, N2, NH3)in the Ocean in: Nitrogen in the Marine En- vironment, Second Edn., Elsevier, Amsterdam, the Netherlands, 51–94, 2008.
Canfield, D. E., Glazer, A. N., and Falkowski, P. G.: The evolution and future of the Earth’s nitrogen cycle, Science, 330, 192–196, 2010.
Chen, J., Wu, F. H., Xiao, Q., Yang, Z. H., Huang, S. K., Wang, J., Wu, Y. G., Dong, X. J., Pei, Z. M., and Zhen, H. L.: Diurnal variation of nitric oxide emission flux from a mangrove wetland in Zhangjiang River Estuary, China, Estuar. Coast. Shelf S., 90, 212–220, 2010.
Hetrick, E. M. and Schoenfisch, M. H.: Analytical chemistry of ni- tric oxide, Annu. Rev. Anal. Chem., 2, 409–433, 2009.
Kampschreur, M. J., Picioreanu, C., Tan, N., Kleerebezem, R., Jet- ten, M. S. M., and van Loosdrecht, M. C. M.: Unraveling the source of nitric oxide emission during nitrification, Water Envi- ron. Res., 79, 2499–2509, 2007.
Kartal, B., Maalcke, W. J., de Almeida, N. M., Cirpus, I., Gloerich, J., Geert, S. W., den Camp, H., Harhangi, H. R., Janssen-Megens, E. M., Francoijs, K. J., Stunnenberg, H. G., Keltjens, J. T., Jetten, M. S. M., and Strous, M.: Molecular mechanism of anaerobic ammonium oxidation, Nature, 479, 127–130, 2011.
Lantoine, F., Trevin, S., Bedioui, F., and Devynck. J.: Selective and sensitive electrochemical measurement of nitric oxide in aqueous solution: discussion and new results, J. Electroanal. Chem., 392, 85–89, 1995.
Law, C. S.: Air-Sea Transfer: N2O, NO, CH4, CO, edited by: Steele, J. H., Thorpe, S. A., and Turekian, K. K., Encyclopedia of Ocean Sciences, Academic Press, San Diego, USA, 137–143, 2001.
Lee, D. S., Köhler, I., Grobler, E., Rohrer, F., Sausen, R., Gallardo- Klenner, L., Olivier, J. G. J., Dentener, F. J., and Bouwman. A.
F.: Estimations of global no, emissions and their uncertainties, Atmos. Environ., 31, 1735–1749, 1997.
Li, P. F., Li, W. S., Liu, C. Y., Zhu, X. C., and Zhang, Q.: The Pho- todecomposition of Nitrite in Water, Environ. Chem., 30, 1883–
1888, 2011 (in Chinese with English abstract).
Liu, C. Y., Zhang, Z. B., Xing, L., Lin, C., and Wu, Z. Z.: The ocean biogeochemistry of nitric oxide, Periodical of Ocean Uni- versity of China, 34(sup), 16–22, 2004 (in Chinese with English abstract).
Liu, C. Y., Zhang, Z. B., and Chen, X. R.: The mutual effects of ni- tric oxide and iron on the growth of marine algae, Acta Oceanol.
Sin., 24, 100–109, 2005.
Liu, C. Y., Zhang, Z. B., Li, P. F., and Huang, H. W.: Growth ef- fect of exogenous nitric oxide onPlatymonas subcordiformsand spectrum study, Chinese J. Environ. Sci., 27, 1062–1067, 2006 (in Chinese with English abstract).
Liu, C. Y., Zhao, M., Ren, C. Y., Yang, G. P., Li, P. F., and Han, Y.: Direct measurement of nitric oxide in seawater medium by fluorometric method. Chinese J. Anal. Chem., 37, 1463–1467, 2009.
Liu, C. Y., Yang, X. M., Yang, G. P., Zhou, L. M., and Li, P. F.:
Composition and characterization of colloidal organic matter in the coastal surface waters of Qingdao, China, Mar. Chem., 121, 123–131, 2010.
Liu, C. Y., Kieber, D. J., Yang, G. P., Xue, C., Wang, L. L., and Liu, H. H.: Evidence for the mutual effects of dimethylsulfoniopropi- onate and nitric oxide during the growth of marine microalgae, Nitric Oxide, 42, 54–61, 2014.
Lutterbeck, H. E. and Bange, H. W.: An improved method for the determination of dissolved nitric oxide (NO) in seawater samples, Ocean Sci., 11, 937–946, https://doi.org/10.5194/os-11- 937-2015, 2015.
Martens-Habbena, W., Qin, W., Horak, R. E., Urakawa, H., Schauer, A. J., Moffett, J. W., Armbrust, E. V., Ingalls, A. E., Devol, A.
H., and Stahl, D. A.: The production of nitric oxide by marine ammonia-oxidizing archaea and inhibition of archaeal ammonia oxidation by a nitric oxide scavenger, Environ. Microbiol., 17, 2261–1274, https://doi.org/10.1111/1462-2920.12677, 2015.
Mazzeo, N. A., Venegas, L. E., and Choren, H.: Analysis of NO, NO2, O3 and NOX concentrations measured at a green area of Buenos Aires City during wintertime, Atmos. Environ., 39, 3055–3068, 2005.
Miles, A. M., Chen, Y., Owens, M. W., and Grisham, M. B.: Fluoro- metric determination of nitric oxide, in: Methods: A Companion to Methods in Enzymology, 7, 40–47, 1995.
Misko, T. P., Schilling, R. J., Salvemini, D., Moore, W. M., and Cur- rie, M. G.: A fluorometric assay for the measurement of nitrite in biological samples, Anal. Biochem., 214, 11–16, 1993.
Nakatsubo, N., Kojima, H., Sakurai, K., Kikuchi, K., Nagoshi, H., Hirata, Y., Akaike, T., Maeda, H., Urano, Y., Higuchi,
T., and Nagano, T.: Improved nitric oxide detection using 2,3- diaminonaphthalene and its application to the evaluation of novel nitric oxide synthase inhibitors, Biol. Pharm. Bull., 21, 1247–
1250, 1998.
Olasehinde, E. F., Takeda, K., and Sakugawa, H.: Development of an analytical method for nitric oxide radical determination in nat- ural waters, Anal. Chem., 81, 6843–6850, 2009.
Schreiber, F., Polerecky, L., and de Beer, D.: Nitric ox- ide microsensor for high spatial resolution measurements in biofilms and sediments, Anal. Chem., 80, 1152–1158, https://doi.org/10.1021/ac071563x, 2008.
Schreiber, F., Wunderlich, P., Udert, K. M., and Wells, G.F.:
Nitric oxide and nitrous oxide turnover in natural and engi- neered microbial communities: biological pathways, chemical reactions, and novel technologies, Front. Microbiol., 3, 372, https://doi.org/10.3389/fmicb.2012.00372, 2012.
Thamdrup, B.: New pathways and processes in the global nitrogen cycle, Annu. Rev. Ecol. Evol. S., 43, 407–428, 2012.
Voss, M., Bange, H. W., Joachim, W. D., Middelburg, J. J., Mon- toya, J. P., and Ward, B.: The marine nitrogen cycle: re- cent discoveries, uncertainties and the potential relevance of climate change, Philos. T. R. Soc. B, 368, 20130121, https://doi.org/10.1098/rstb.2013.0121, 2013.
Ward, B. B. and Zafiriou, O. C.: Nitrification and nitric oxide in the oxygen minimum of the eastern tropical North Pacific, Deep-Sea Res., 35, 1127–1142, 1988.
Williams, E. J., Hutchinson, G. L., and Fehsenfeld, F. C.: NOxand N2O emissions from soil, Global Biogeochem. Cy., 6, 351–388, 1992.
Xing, L., Zhang, Z. B., Liu, C. Y., Wu, Z. Z., and Lin, C.: Ampero- metric detection of nitric oxide with microsensor in the medium of seawater and its applications, Sensors, 5, 537–545, 2005.
Yang, G. P., Ren, C. Y., Lu, X. L., Liu, C. Y., and Ding, H. B.:
Distribution, flux and photoproduction of carbon monoxide in the East China Sea and the Yellow Sea in spring, J. Geophys. Res., 116, C02001, https://doi.org/10.1029/2010JC006300, 2011.
Zafiriou, O. C. and Dister, B.: Photochemical free radical produc- tion rates: Gulf of Maine and Woods Hole-Miami transect, J.
Geophys. Res., 96, 4939–4945, 1991.
Zafiriou, O. C. and McFarland, M.: Determination of trace levels of nitric oxide in aqueous solution, Anal. Chem., 52, 1662–1667, 1980.
Zafiriou, O. C. and McFarland, M.: Nitric oxide from nitrite photol- ysis in the central equatorial Pacific, J. Geophys. Res., 86, 3173–
3182, 1981.
Zafiriou, O. C., McFarland, M., and Bromund, R. H.: Nitric oxide in seawater, Science, 207, 637–639, 1980.
Zafiriou, O. C., Blough, N. V., Dister, B., Kieber, D., and Moffett, J.:
Molecular probe systems for reactive transients in natural waters, Mar. Chem., 30, 45–71, 1990.
Zehr, J. P. and Ward, B. B.: Nitrogen cycling in the ocean: New per- spectives on processes and paradigms, Appl. Environ. Microb., 68, 1015–1024, 2002.
Zhang, Z. B., Lin, C., Liu, C. Y., Xing, L., Wu, Z. Z., and Sun, F.:
Study on patterns and chemical features of NO effect on marine phytoplankton growth, Sci. China Ser. B, 48, 376–384, 2005.
Zhang, Z. B., Liu, C. Y., Wu, Z. Z., Xing, L., and Li, P. F.: Detec- tion of nitric oxide in culture media and studies on nitric oxide formation by marine microalgae, Med. Sci. Monitor., 12, 75–85, 2006.
Zhang, Z. B., Xing, L., Wu, Z. Z., Liu, C. Y., Lin, C., and Liu, L.
S.: Discovery of nitric oxide in marine ecological system and the chemical characteristics of nitric oxide, Sci. China Ser. B, 49, 475–480, 2006.