Contents lists available atScienceDirect
Harmful Algae
journal homepage:www.elsevier.com/locate/hal
Occurrence and distribution of Amphidomataceae (Dinophyceae) in Danish coastal waters of the North Sea, the Limfjord and the Kattegat/Belt area
Stephan Wietkamp
a, Bernd Krock
a, Haifeng Gu
b, Daniela Voß
c, Kerstin Klemm
a, Urban Tillmann
a,⁎aAlfred-Wegener-Institute, Helmholtz Centre for Polar and Marine Research, Am Handelshafen 12, D-27570 Bremerhaven, Germany
bThird Institute of Oceanography, Ministry of Natural Resources, Xiamen 361005, China
cInstitute for Chemistry and Biology of the Marine Environment (ICBM), Carl von Ossietzky Universität Oldenburg, Schleusenstraße 1, D-26382 Wilhelmshaven, Germany
A R T I C L E I N F O Keywords:
Azadinium Amphidoma Azaspiracids Denmark Limfjord Quantitative PCR
A B S T R A C T
Some species of the dinophytesAzadiniumandAmphidoma(Amphidomataceae) produce azaspiracids (AZA), lipophilic polyether compounds responsible for Azaspiracid Shellfish Poisoning (AZP) in humans after con- sumption of contaminated seafood. Toxigenic Amphidomataceae are known to occur in the North Atlantic and the North Sea area, but little is known about their importance in Danish coastal waters. In 2016, 44 Stations were sampled on a survey along the Danish coastline, covering the German Bight, Limfjord, the Kattegat area, Great Belt and Kiel Bight. Samples were analysed by live microscopy, liquid chromatography-tandem mass spectro- metry (LC–MS/MS) and quantitative polymerase-chain-reaction (qPCR) on the presence of Amphidomataceae and AZA. Amphidomataceae were widely distributed in the area, but were below detection limit on most of the inner Limfjord stations. Cell abundances of the three toxigenic species, determined with species-specific qPCR assays onAzadinium spinosum,Az. poporumandAmphidoma languida,were generally low and restricted to the North Sea and the northern Kattegat, which was in agreement with the distribution of the generally low AZA abundances in plankton samples. Among the toxigenic species,Amphidoma languidawas dominant with highest cell densities up to 3 × 10³cells L−1on North Sea stations and at the western entrance of the Limfjord.
Azaspiracids detected in plankton samples include low levels of AZA-1 at one station of the North Sea, and higher levels of AZA-38 and -39 (up to 1.5 ng L−1) in the North Sea and the Limfjord entrance. Furthermore, one new AZA (named AZA-63) was discovered in plankton of two North Sea stations. Morphological, molecular, and toxinological characterisation of 26 newly established strains from the area confirmed the presence of four amphidomatacean species (Az. obesum,Az. dalianense, Az. poporumandAm. languida). The single new strain of Az. poporumturned out as a member of Ribotype A2, which was previously only known from the Mediterranean.
Consistent with some of these Mediterranean A2 strains, but different to the previously established AZA-37 producingAz. poporumRibotype A1 strains from Denmark, the new strain did not contain any AZA. Azaspiracids were also absent in allAz. obesumandAz. dalianensestrains, but AZA-38 and -39 were found in allAm. languida strains with total AZA cell quotas ranging from 0.08 up to 94 fg cell−1. In conclusion, AZA-producing microalgae and their respective toxins were low in abundance but widely present in the area, and thus might be considered in local monitoring programs to preserve seafood safety in Danish coastal waters.
1. Introduction
Denmark is almost entirely bordered by the Sea, from the North Sea in the west, Skagerrak in the north, and by the Kattegat and the Belt area to the Baltic Sea on the east side. With a long coastline and many fjords and islands, fishing industry and aquaculture play an important role in the Danish economy. One major natural threat to aquaculture and shellfish industries, however, are harmful microalgal blooms and
the respective biotoxins, which can cause large fish kills or potential health problems in human seafood consumers. Most threatening for Danish waters currently are fish killing species of Pseudochattonella, which since about 20 years has become well established in Scandinavian waters and form recurrent massive blooms in the North Sea and Skagerrak (Jakobsen et al., 2012). Another fish killing algae of concern isPseudopfiesteria, which caused serious fish kills in land-based fish farms in northern Jutland, Denmark (Moestrup et al., 2014).
https://doi.org/10.1016/j.hal.2019.101637
Received 13 March 2019; Received in revised form 12 June 2019; Accepted 25 June 2019
⁎Corresponding author.
E-mail address:urban.tillmann@awi.de(U. Tillmann).
Available online 26 July 2019
1568-9883/ © 2019 Elsevier B.V. All rights reserved.
T
Microalgal toxins accumulating in shellfish are of concern as well.
The Danish shellfish industry is continuously growing and of increasing importance, especially since shellfish farming has been suggested as an effective counteract to reduce particle and nutrient loads of large scale offshore fish farming in Danish coastal waters (Maar et al., 2018).
Currently, the most problematic microalgal toxins for the Danish shellfish industry are okadaic acid and related compounds produced by Dinophysisspp. (Jørgensen and Andersen, 2007). In 1990, there was a major European incident of diarrhetic shellfish poisoning (DSP) caused by Danish blue mussels harvested in Limfjord, which is the main Danish production area of shellfish. Another long-lasting closure of shellfish harvest due to elevated concentrations of DSP toxins also occurred in 2006 (Jørgensen and Andersen, 2007).
A more recently discovered group of shellfish-contaminating phy- cotoxins are azaspiracids (AZA), which can lead to Azaspiracid Shellfish Poisoning (AZP) in humans after consumption of contaminated mussels (Twiner et al., 2014). Elevated levels of AZA in shellfish let recurrently to closures of shellfish harvests in Ireland (Salas et al., 2011), and AZA levels above the EU regulatory limit were observed recently in shellfish species harvested at the Spanish Atlantic coast (Tillmann et al., 2017a).
Azaspiracids are known to be produced by four (out of ca. 20) dino- phyte species of Amphidomataceae, i.e. by Azadinium spinosum, Az.
poporum,Az. dexteroporumandAmphidoma languida(Krock et al., 2012;
Percopo et al., 2013; Tillmann et al., 2009, 2017a). Among those, toxigenicAz. dexteroporumis up to now only recorded from the Medi- terranean, whereas Az. poporum, Az. spinosum andAm. languida are widely distributed in the North Sea and North Atlantic (Tillmann, 2018;
Tillmann et al., 2018).
To date, azaspiracids are known from various European coastal areas, including Irish, Dutch, French, Swedish, Spanish, English and Norwegian coasts (Amzil et al., 2008; Braña Magdalena et al., 2003;
James et al., 2002;Mc Mahon and Silke, 1996;Vale et al., 2008). In Denmark, AZA have been reported in shellfish (Furey et al., 2010) and in plankton (Krock et al., 2009,2013). Moreover, microscopy and strain establishment revealed the occurrence of toxigenicAz. spinosumandAz.
poporumand their toxic metabolites on the Danish North Sea coastal area (Krock et al., 2013). In fact,Az. poporumwas originally described from a strain collected in the southern North Sea off the Danish coast (Tillmann et al., 2011). Nevertheless, still little is known about the diversity, distribution, and abundance of Amphidomataceae in the area, and especially about the potential importance of Amphidomataceae in inner waters such as the Limfjord, as well as for low salinity areas on the Danish east coast.
Toxigenic and non-toxigenic amphidomatacean species are very si- milar in size and shape, and it is hardly possible to identify and dif- ferentiate them by light microscopy. In recent years, molecular tools have contributed significantly to the knowledge about the biogeo- graphical distribution and abundance of various toxic algae (Eckford- Soper and Daugbjerg, 2015;Edvardsen et al., 2013;Penna and Galluzzi, 2013), and molecular assays are also available for Amphidomataceae.
In 2013,Toebe et al. (2013)designed a qPCR assay with species-specific primers and probes for the molecular detection ofAz. spinosumandAz.
poporum, and recently,Wietkamp et al. (2019)published an assay for the third known AZA producer in the North Sea,Am. languida.
To increase the knowledge about the biogeography of Amphidomataceae and in particular about the azaspiracid-producing species in the south-eastern part of the North Sea, an expedition on board theRVUthörn took place in 2016. One aim of this survey was to investigate diversity, distribution and abundance of Amphidomataceae in Danish coastal waters along the salinity gradient, from high saline waters of the North Sea, through the semi-enclosed Danish Limfjord and the low-saline Kattegat/Belt area down to Kiel Bight/Baltic Sea. In this Fig. 1.Location of sampling stations during the UTH-16 expedition.
study, the molecular qPCR method was used together with field sample AZA analysis and microscopy/strain establishment to specifically detect and quantify the known North Atlantic AZA-producers,Az. spinosum, Az. poporumandAm. languida.
2. Material & methods 2.1. Field campaign 2.1.1. Sampling
Samples were taken along the Danish coast during the survey onRV Uthörn (UTH-16) in 2016 from June, 13th till June, 28th. In total, 44 stations were sampled, starting in the German Bight (Fig. 1). Between June, 19th and June, 23rd, several subareas of the Limfjord were sampled in daily excursions from Løgstør. The expedition continued from Løgstør to Kattegat, Great Belt, down to Kiel Bight. At each sta- tion, CTD profiles were conducted using a Seabird 'sbe19plus V2' CTD (Sea-Bird Electronics Inc., Seattle, USA) with an attached sampling rosette (6 × 4 L Niskin bottles). The CTD was equipped with an addi- tional fluorescence sensor (SCUFA Fluorometer, Turner Designs, San Jose, USA). Data acquisition was carried out via CTD-client onboard (Seasave V 7.22.2, Sea-Bird Scientific, Bellevue, USA). Post-processing was done with SBE data processing 7.22.5. Temperature was corrected to ITS-90 (Preston-Thomas, 1990). CTD data are available at Pangaea database (Krock et al., 2017). A composite water sample was prepared from two depths (3, 10 m) taken from the Niskin bottles. 5 L of each depth was pre-screened through a 20 μm mesh-size Nitex sieve and pooled.
2.1.2. Live plankton observations of field samples
At selected stations, one liter of the pooled water sample was gently concentrated by gravity filtration using a 3 μm Whatman Nuclepore polycarbonate filter (Ø = 47 mm, GE Healthcare, Little Chalfont, UK).
The concentrate was examined using an inverted microscope (Axiovert 200 M, Zeiss, Göttingen, Germany). Samples were screened for cells of Azadiniumand/orAmphidomaat high magnification (640 x) based on general cell size and shape, on the presence of a theca, and on the presence of a distinctly pointed apex. Cells of interest were photo- graphed with a digital camera (Axiocam MRc5, Zeiss).
On stations, where cells of Amphidomataceae were detected during live sample observations, cells were subsequently isolated by micro- capillary into wells of 96-well plates filled with 0.2 mL filtered sea- water. By the transfer technique, the inclusion of non-target cells was unavoidable. Therefore, the amphidomatacean cells were re-isolated a few times using a stereomicroscope (SZH-ILLD, Olympus, Hamburg, Germany) equipped with dark field illumination into new wells of a 96- well plate. Plates were incubated at 15 °C under a photon flux density of approx. 50 μmol m−2 s-1on a 16:8 h light:dark photocycle in a con- trolled environment growth chamber (Model MIR 252, Sanyo Electric Biomedical Co., Osaka, Japan).
2.1.3. Azaspiracid analysis of field samples
An amount of 1.5–4 L (depending on particle content) of the pooled and pre-screened water sample was filtered under gentle vacuum (< 200 mbar) through 5 μm pore-size polycarbonate filters (Merck KGaA, Darmstadt, Germany). The filter was placed with its back to the inner wall of a 50 mL centrifuge tube (Sarstedt, Nümbrecht, Germany) and was repeatedly rinsed with 500–1,000 μL methanol until complete decolouration of the filter. The methanolic extract was transferred to a 0.45 μm pore-size spin-filter (Millipore Ultrafree, Eschborn, Germany) and centrifuged for 30 s at 800×g (5415R, Eppendorf, Hamburg, Germany), followed by transfer to an auto-sampler vial and kept at -20 °C until analysis. Mass spectral experiments were performed to survey for a wide array of AZA with an analytical system consisting of a API 4000 Q-Trap, triple quadrupole mass spectrometer (Sciex, Darmstadt, Germany) equipped with a TurboSpray interface coupled to
an Agilent model 1100 LC (Agilent, Waldbronn, Germany). The LC equipment included a solvent reservoir, in-line degasser (G1379A), binary pump (G1311A), refrigerated autosampler (G1329A/G1330B), and temperature-controlled column oven (G1316A). Separation of AZA (5 μL sample injection volume) was performed by reverse-phase chro- matography on a C8 phase. The analytical column (50 × 2 mm) was packed with 3 μm Hypersil BDS 120 Å (Phenomenex, Aschaffenburg, Germany) and maintained at 20 °C. The flow rate was 0.2 mL min−1, and gradient elution was performed with two eluents, where eluent A was water and B was acetonitrile/water (95:5 v/v), both containing 2.0 mM ammonium formate and 50 mM formic acid. Initial conditions were 8 min column equilibration with 30% B, followed by a linear gradient to 100% B in 8 min and isocratic elution until 18 min with 100% B then returning to initial conditions until 21 min (total run time:
29 min). Azaspiracid profiles were determined in one period (0–18) min with curtain gas: 10 psi, CAD: medium, ion spray voltage: 5,500 V, temperature: ambient, nebulizer gas: 10 psi, auxiliary gas: off, interface heater: on, declustering potential: 100 V, entrance potential: 10 V, exit potential: 30 V. Single-reaction-monitoring experiments were carried out in positive ion mode by selecting the transitions shown in Supplementary Table S1. A product ion spectrum of them/zvalue 844 was recorded in the Enhanced Product Ion (EPI) mode in the mass range fromm/z150 to 850. Positive ionization and unit resolution mode were used. The following parameters were applied: curtain gas: 10 psi, CAD:
medium, ion spray voltage: 5,500 V, temperature: ambient, nebulizer gas: 10 psi, auxiliary gas: off, interface heater: on, declustering poten- tial: 100 V, collision energy spread: 0, 10 V, collision energy: 70 V. The limit of detection (LOD, signal-to-noise ratio = 3) was calculated as 0.24 pg μl−1sample extract.
2.1.4. Real-time PCR analysis of field samples
Filter concentrates of the pooled water samples were obtained as described in2.1.3. The filters were attached to the inner wall of a 50 mL plastic centrifuge tube, and repeatedly rinsed with 1 mL pre-heated (60 °C) PL1 DNA lysis buffer of the NucleoSpin Plant II DNA extraction kit (Macherey & Nagel, Düren, Germany). The lysis buffer was subse- quently transferred to a 5 mL cryovial prefilled with 200 μL glass beads (acid-washed, 212–300 μm, Sigma-Aldrich, St. Louis, USA) and stored at -20 °C. DNA of the field samples was extracted using the NucleoSpin Plant II kit according to the manufacturer instructions, with an addi- tional cell disruption step within beat tubes. Therefore, the samples were shaken for 45 s and another 30 s at a speed of 4.0 m s−1 in a FastPrep FP120 cell disrupter (Qbiogene, Carlsbad, USA). Afterwards, 30 μL of the provided elution buffer were spinned through the spin column to elute the DNA according to the manufacturer instructions, and subsequently repeated with another 30 μL to increase the DNA yield, leading to a total elution volume of 60 μL.
To pre-scan the field samples for the general occurrence of Amphidomataceae, a SYBR Green real-time PCR assay was performed as described inSmith et al. (2016) with slight variations. The 10 μL SYBR Green assay contained 5 μL of Fast SYBR Green Master Mix (Applied Biosystems by Thermo Fisher Scientific, Waltham, USA), 0.25 μL of both primers (each as a final concentration of 200 nmol), 3.5 μL of high-grade PCR H2O and 1 μL of template DNA (1 ng μL−1).
The assays were run in a StepOne Plus real-time PCR cycler (Applied Biosystems by Thermo Fisher Scientific) with the following conditions:
Stage 1: hold 95 °C for 20 s, followed by 40 cycles of Stage 2, Step 1:
hold 95 °C for 3 s, Step 2: hold 60 °C for 30 s, followed by a Melt Curve Stage: Step 1: hold 95 °C for 15 s, Step 2: hold 60 °C for 60 s, Step 3: hold 95 °C for 15 s. All measurements were carried out in triplicates and samples were considered as being positive if at least two of the three replicates showed a fluorescence signal above the threshold before cycle 37. No-template controls (NTC), containing high-grade PCR H2O, as well as positive controls, containing target DNA with known con- centrations from exponentially growing amphidomatacean cultures, were present during all PCR runs. A melt curve analysis was always
performed to check the amplification specificity. Samples with ampli- fication above the threshold before cycle 37 were subsequently ana- lysed with the species-specific TaqMan assays for Az. spinosum, Az.
poporum and Am. languida as described in Toebe et al. (2013) and Wietkamp et al. (2019). For the species-specific assays, all reactions were carried out in triplicates within 0.1 mL MicroAmp Fast 96-Well Reaction Plates (Applied Biosystems by Thermo Fisher Scientific) and no-template controls (NTC), containing high-grade PCR H2O, were present during each qPCR run. For determination of the CT value (threshold cycle), baselines and thresholds were set manually before each qPCR analysis according to the guidelines from Applied Biosys- tems (Livak, 1997;Ruijter et al., 2009). DNA-based standard curves (10-fold dilution series of target DNA with 10 ng μL−1to 0.01 pg μL−1) were present forAz. spinosum,Az. poporumandAm. languidaduring all qPCR runs to calculate cell numbers of the target species. The DNA for the standard curves was gained from known cell numbers of ex- ponentially growing cultures ofAz. spinosum(3D9),Az. poporum(UTH- D4) and Am. languida (LF-09-C09). To estimate cell densities of the cultures, cells were settled in counting chambers (0.5 mL subsamples) and counted by light microscopy (Axiovert 200 M, Zeiss) at a magnifi- cation of 400 x . DNA extraction for the standard curves was carried out using the NucleoSpin Soil DNA extraction kit (Macherey & Nagel), the amount of dsDNA of these extracts was measured using a Quantus Fluorometer (Promega, Fitchburg, USA) and DNA cell quota was cal- culated. The limit of detection and of quantification (LOD and LOQ) were defined here followingForootan et al. (2017)as the lowest stan- dard curve DNA concentration, for which all three replicates are within the 95% confidence limits of the curve (LOQ), and for which all three replicates show amplification but values scattered outside the 95%
confidence limit of the curve (LOD). For standard curves of all three qPCR assays, the limited resolution of dilutions applied here did not allow to differentiate between LOD and LOQ, which was 0.1 pg μL-1 sample extract.
2.2. Characterisation of Amphidomataceae strains
2.2.1. Culture growth, sampling and extraction of cultured strains After several weeks of growth, primary isolation plates from the cruise were inspected in the laboratory using a stereomicroscope (SZH- ILLD, Olympus) for the presence ofAzadinium-like cells as inferred from the typical size, shape, and swimming behavior. From each positively identified well, a clonal strain was established by isolation of single cells with a micro-capillary. Established cultures were thus clonal but not axenic, and were routinely held in 65 mL plastic culture flasks at 15 °C and a photon flux density of 50 μmol m−2s-1on a 16:8 h light:- dark photocycle. The medium was natural, sterile-filtered (0.2 μm VacuCap filters, Pall GmbH, Dreieich, Germany) Antarctic seawater (salinity: 34, pH adjusted to 8.0) and enriched with 1/10 strength K- medium (Keller et al., 1987), slightly modified by omitting the addition of ammonium ions.
For toxin analysis, strains were grown at the standard culture con- ditions described above. For each harvest, cell density was determined by settling lugol fixed samples and counting > 800 cells under an in- verted microscope. Densely grown strains (ranging from 0.5 to 5 × 10⁴ cells mL−1) were harvested by centrifugation (5810 R, Eppendorf) at 3,220 × g for 10 min from 50 mL subsamples. The cell pellet was re- suspended, transferred to a microtube, centrifuged again (5415R, Eppendorf; 16,000 × g, 5 min) and stored at –20 °C until use. For a number of selected strains, growth and harvest procedures were re- peated several times to yield a high biomass and to increase the sen- sitivity of the toxin detection method. Total numbers of harvested cells for all strains are listed in Supplementary Tables S2 and S3. Several cell harvests of each strain were combined in 100 μL acetone. The extrac- tion of cell pellets was repeated four times with 100 μL each and combined cell suspensions were shortly vortexed every 10 min at room temperature five times. Homogenates were centrifuged (5810 R,
Eppendorf) at 15 °C and 3,220 × g for 15 min. Filtrates were then ad- justed with acetone to a final volume of 0.5 mL. The extracts were transferred to a 0.45 μm pore-size spin-filter (Millipore Ultrafree, Eschborn, Germany) and centrifuged (5810 R, Eppendorf) at 800 × g for 30 s. The filtrate was transferred into a liquid chromatography (LC) autosampler vial for LC–MS/MS analysis.
For DNA analysis, each strain was grown in 65 mL plastic culture flasks under the standard culture conditions described above. 50 mL of healthy and growing culture (based on stereomicroscopic inspection of the live culture) were harvested by centrifugation (5810 R, Eppendorf;
3,220 × g, 10 min). Each pellet was transferred to a 1.5 mL tube, centrifuged (5415, Eppendorf; 16,000 × g, 5 min) and stored at –20 °C until DNA extraction.
2.2.2. Microscopy observation of cultured strains
2.2.2.1. Light microscopy (LM). Observation of living or fixed cells was carried out with a stereomicroscope (SZH-ILLD, Olympus) and an inverted microscope (Axiovert 200 M, Zeiss). Observation and documentation of live cells at high magnification (1,000 x) was performed using a Zeiss Axioskop 2 (Zeiss) and by recording videos using a digital camera (Gryphax, Jenoptik, Jena, Germany) at full-HD resolution. Single frame micrographs were extracted using Corel Video Studio software (Version X8 pro). Photographs of formalin-fixed cells (1% final concentration) were taken with a digital camera (Axiocam MRc5, Zeiss). Cell length and width of freshly fixed cells (formalin, final concentration 1%) of strains grown at 15 °C were measured at 1,000 x microscopic magnification using Zeiss Axiovision software (Zeiss).
2.2.2.2. Scanning electron microscopy (SEM). For SEM, cells were collected by centrifugation (5810 R, Eppendorf; 3,220 × g, 10 min.) of 15 mL of culture. The supernatant was removed and the cell pellet re- suspended in 60% ethanol in a 2 mL microtube for 1 h at 4 °C to strip off the outer cell membrane. Subsequently, cells were pelleted by centrifugation (5810 R, Eppendorf; 16,000 × g, 5 min) and re- suspended in a 60:40 mixture of deionized water and seawater for 30 min at 4 °C. After centrifugation and removal of the diluted seawater supernatant, cells were fixed with formalin (2% final concentration in a 60:40 mixture of deionized water and seawater) and stored at 4 °C for 3 h. Cells were then collected on polycarbonate filters (Ø = 25 mm, 3 μm pore-size, Merck) in a filter funnel, where all subsequent washing and dehydration steps were carried out. A total of eight washings (2 mL MilliQ-deionized water each) were followed by a dehydration series in ethanol (30, 50, 70, 80, 95, 100%; 10 min each). Filters were dehydrated with hexamethyldisilazane (HMDS), first in 1:1 HMDS:EtOH followed by two times 100% HMDS, and then stored under gentle vacuum in a desiccator. Finally, filters were mounted on stubs, sputter coated (SC500, Emscope, Ashford, UK) with gold- palladium and viewed under a scanning electron microscope (Quanta FEG 200, FEI, Eindhoven, Netherlands). Some SEM micrographs were presented on a black background using Adobe Photoshop 6.0 (Adobe Systems, San Jose, USA).
2.2.3. Chemical analysis of azaspiracids from cultured strains
Extracts of the strains were screened for known AZA in the SRM mode as described above (2.1.3). In addition, precursor ion experiments were performed. Precursors of the characteristic AZA fragmentsm/z 348,m/z360 andm/z362 were scanned in the positive ion mode from m/z 400 to 900 under the following conditions: curtain gas: 10 psi, CAD: medium, ion spray voltage: 5,500 V, temperature: ambient, nebulizer gas: 10 psi, auxiliary gas: off, interface heater: on, declus- tering potential: 100 V, entrance potential: 10 V, collision energy: 70 V, exit potential: 12 V. Product ion spectra of them/zvalues 830, 842 and 858 were recorded in the Enhanced Product Ion (EPI) mode in the mass range fromm/z 150 to 930. Positive ionization and unit resolution mode were used. The following parameters were applied: curtain gas:
10 psi, CAD: medium, ion spray voltage: 5,500 V, temperature: ambient,
nebulizer gas: 10 psi, auxiliary gas: off, interface heater: on, declus- tering potential: 100 V, collision energy spread: 0, 10 V, collision en- ergy: 70 V.
2.2.4. Molecular phylogeny
2.2.4.1. DNA extraction and sequencing of cultured strains. DNA of the cultured strains was extracted as described above (2.1.4) and stored at -20 °C until further processing. For the Sanger-Sequencing, the DNA of each sample was quantified with a spectrophotometer (NanoDrop ND- 1000, PeqLab Biotechnology GmbH, Erlangen, Germany) and diluted to a final concentration of 10 ng μL−1. The DNA was subjected a polymerase-chain-reaction (PCR) for the following genes: D1/D2 region of 28S/large subunit (LSU) and the Internal Transcribed Spacer region including ITS1, 5.8S rRNA, ITS2, with respective primer sequences summarized in Tillmann et al. (2017a). The reaction mixes were prepared as follows: 16.3 μL of high-grade PCR H2O, 2.0 μL of Hotmaster Taq PCR Buffer (10X) (Quantabio, Beverly, USA), 0.2 μL of each primer (10 μM), 0.2 μL of dNTP (10 μM) (Quantabio), 0.1 μL of Taq Polymerase (Quantabio) and 1 μL of DNA template (10 ng μL-1) to a final volume of 20 μL. Subsequently, the PCR for the LSU and ITS region was performed according the conditions described inTillmann et al. (2017c). The PCR amplicons were run on a 1% agarose gel in TE buffer at 70 mV for 30 min to verify that the PCR amplicons were of the expected length. The PCR amplicon was purified using the NucleoSpin Gel and PCR clean-up kit (Macherey-Nagel) and sequenced directly in both directions on an ABI PRISM 3730XL (Applied Biosystems by Thermofisher Scientific) as described in Tillmann et al. (2017c).
2.2.4.2. Phylogenetic analysis. Newly obtained LSU and ITS rDNA sequences were incorporated into availableAmphidomaandAzadinium sequences in GenBank (https://www.ncbi.nlm.nih.gov/genbank/).
Genbank Accession numbers are listed in Supplementary Table S4. All new 17 strains ofAm. languidawith sequence data shared the same LSU rDNA sequences, and thus only eight randomly selected strains were included in the phylogenetic analysis. Sequences were aligned using MAFFT v7.110 (Katoh and Standley, 2013) online program (http://
mafft.cbrc.jp/alignment/server/) with default settings. Alignments were manually checked with BioEdit v. 7.0.5 (Hall, 1999). For Bayesian inference (BI), the program jModelTest (Posada, 2008) was used to select the most appropriate model of molecular evolution with Akaike Information Criterion (AIC). Bayesian reconstruction of the data matrix was performed using MrBayes 3.2 (Ronquist and Huelsenbeck, 2003) with the best-fitting substitution model (GTR + G). Four Markov chain Monte Carlo (MCMC) chains ran for 6,000,000 generations, sampling every 100 generations. The first 10% of burn-in trees were discarded. A majority rule consensus tree was created in order to examine the posterior probabilities of each clade. Maximum likelihood (ML) analysis were conducted with RaxML v7.2.6 (Stamatakis, 2006) on the T-REX web server (Boc et al., 2012) using the model GTR + G. Node support was assessed with 1,000 bootstrap replicates.
3. Results 3.1. Field data
3.1.1. Hydrography and chemistry
In the three investigated areas, the North Sea coast, the inner Limfjord and the Kattegat/Belt area, different environmental conditions were observed (Fig. 2). CTD data of the North Sea stations (station 1–13) revealed low mean temperatures (13.86 ± 0.61 °C) and a con- stantly high salinity (32.84 ± 0.69). This was in contrast to the Limf- jord stations (station 14–28), where a higher mean temperature (17.50 ± 0.53 °C) and a broader salinity range (25.92 ± 2.50) was found. The Kattegat/Belt area (station 29–44) showed a clear stratifi- cation with higher temperatures in the upper 12 m (16–18 °C) and
lower temperatures in the deeper water layer (6–12 °C). In contrast, the salinity in the upper layer was relatively low (14–20) compared to the lower layer (26–32). The mean fluorescence was found to be sig- nificantly higher within Limfjord (0.1 to 0.5 AU) compared to the North Sea and Kattegat/Belt area (≤ 0.2 AU) with particularly high values at station 18.
3.1.2. Live sample records of Amphidomataceae in field samples
Light microscopy analysis of selected live samples revealed presence of Amphidomataceae in the study area, especially in the North Sea off the Limfjord entry (station 9, 10, 11, 12), at the first inner Limfjord stations (station 14, 15), and also from the last station (station 44) in the Baltic Sea close to Kiel Bight (Fig. 3). Amphidomatacean cells in field samples were not identified to species level.
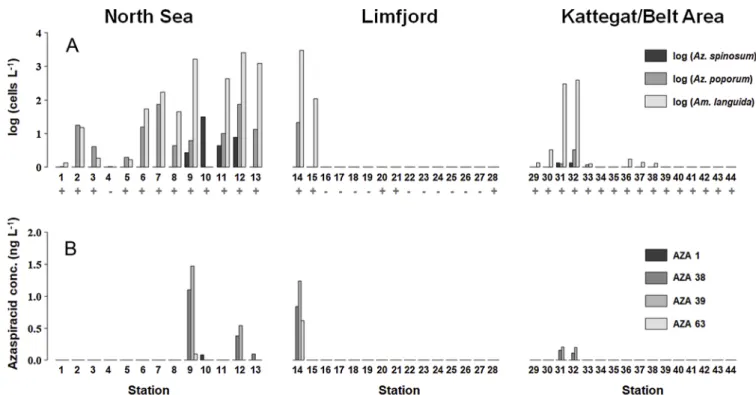
3.1.3. AZA in field samples
In plankton field samples, AZA-1, -38 and -39 were detected (Fig. 4).
Depending on the filtered water volume and filter extraction volume, the limits of detection of the field sample measurements ranged be- tween 24 and 80 pg AZA L−1. Azaspiracids were mainly recorded in the North Sea, the western Limfjord stations, and at two stations of the northern East coast. Highest AZA abundances were recorded in the North Sea on station 9 (AZA-38: 1.10 ng L−1; AZA-39: 1.47 ng L−1).
AZA-1 was detected only at station 10 in low amounts (0.08 ng L−1).
3.1.3.1. Description of AZA-63. In addition to the known AZA described above, in the samples of two stations (9 and 14) a peak with the transition m/z 844 > 826 was detected (data not shown). The abundance of this compound was estimated as 0.62 ng L−1at station 9 and 0.10 ng L−1 at station 14 (both values expressed as AZA-1 equivalents). The collision induced dissociation spectrum (CID) of m/z 844, hereafter named AZA-63 (Fig. 5A), was almost identical with the CID spectrum of AZA-37, except for a 2 Da downshifted and a less complex pseudo-molecular ion cluster, whereas all other typical AZA fragments were identical with AZA-37 (Fig. 5B). The proposed chemical structure of AZA-63 is presented inFig. 5C.
3.1.4. Real-time PCR results of field samples
The pre-scanning PCR assay targeting the group of Amphidomataceae revealed positive amplifications at almost all sta- tions outside Limfjord. Positive signals inside Limfjord were recorded at station 14 and 15 located at the entrance of the fjord, as well as at station 20, 21 and 28 in the inner fjord (Fig. 4). The species-specific qPCR assays revealed the occurrence of all three targeted speciesAz.
spinosum,Az. poporumandAm. languida. The limit of detection of 0.1 pg target DNA μL−1 - considering the DNA extraction volume and the filtered water volume - here corresponded to 1–3 cells L−1.Azadinium spinosumwas rather low in abundance and mainly present in the North Sea with the highest cell density (31 cells L−1) on station 10. This species was not detected inside Limfjord, and very low cell densities of around 1 cell L-1were found at the Kattegat stations 31 and 32. The species Azadinium poporumwas also low in abundance with highest densities at station 7 and 12 (approx. 75 cells L−1). It was also present in the western entrance of the Limfjord (station 14, with approx.
20 cells L−1). LikeAz. spinosum,Az. poporumoccurred also in the upper Kattegat stations in relatively low amounts (station 31 and 32, approx.
1–3 cells L−1). The species Amphidoma languidawas found at all sta- tions in the North Sea, except for station 4 and 10. In general,Am.
languida showed considerably higher cell densities compared to the other two species, with a maximum density of 3 × 10³cells L−1at the entrance of Limfjord (station 14), but it was not found in the inner fjord.
In the Kattegat area,Am. languidawas also present (station 31 and 32), again in significantly higher amounts (approx. 350 cells L−1) compared toAz. spinosumandAz. poporum. Furthermore, low levels ofAm. lan- guida(approx. 1 cell L−1) were also found further south at stations 36, 37 and 38.
3.2. New strains of Amphidomataceae
Single cell isolation yielded 26 clonal amphidomatacean strains. All strains displayed a similar and conspicuous swimming behavior consisting of a slow movement interrupted by short “jumps” in various directions.
Identification of all strains was based on morphology as examined by LM and was confirmed for almost all strains by rDNA sequence comparison (Table 1). For a number of selected strains the morphology was also ex- amined by SEM (Table 1). The newly available 26 strains comprised four species includingAz. dalianense(2 strains),Az. obesum(3 strains),Az. po- porum(1 strain), andAm. languida(20 strains).
3.2.1. Morphology
3.2.1.1. Azadinium obesum. Three strains ofAz. obesumwere obtained, two from the North Sea (station 12) and one from the last Baltic Sea station (station 44) close to Kiel Bight. All three strains were indistinguishable in LM and SEM and all shared the morphological features described as distinctive forAz. obesum(Fig. 6, Suppl. Figs S1, S2). No pyrenoid was visible using light microscopy (Fig. 6A–C). A detailed SEM examination (Fig. 6D–G) revealed the commonAzadinium Kofoidian plate pattern (Po, cp, X, 4′, 3a, 6′′, 6C, 5S, 6′′′, 2′′′′) and the ventral pore location at the margin of plate 1′ and 1′′ (Fig. 6D, E).
Epithecal intercalary plates were relatively small and the first of them Fig. 2.CTD depth profile of (A) temperature, (B) salinity and (C) chlorophyll fluorescence along the coastal stations 1-44. For the location of the stations seeFig. 1.
Fig. 3.Amphidomataceae records in live samples of the survey (station 9, 12, 14, 44). Scale bars =5 μm.
(1a) was not in contact with plate 1′′ (Fig. 6E). The small central anterior intercalary plate 2a occurred in two arrangements, either being tetragonal and only contacting plate 3′′ of the postcingular series (most common), or being pentagonal and in contact to two plates of the precingular series (3′′ and 4′′) (Suppl. Fig. S1E).
3.2.1.2. Azadinium dalianense. Two of the strains were identified asAz.
dalianense, one originating from station 9 (North Sea) and one from the Limfjord (station 14). Both strains shared the same morphological features described as distinctive for Az. dalianense with an asymmetrically pointed hyposome ending with a small bulb (Fig. 7). At Fig. 4.A: qPCR-based cell densities (cells L−1, log-scale) ofAz. spinosum,Az. poporumandAm. languida. Positive (+) or negative (-) amplification in the general amphidomatacean PCR assay is marked below the station number. B: Azaspiracid concentration (ng L−1, linear-scale).
Fig. 5.Collision induced dissociation (CID) spectrum of AZA-63 (A), AZA-37 (B) and the proposed structure of AZA-63 (C).
the end of this bulb there occasionally was a small spine visible in LM (Fig. 7A). One pyrenoid was consistently located posterior in the hyposome (Fig. 7A, B). SEM revealed the presence of only three apical plates and two large anterior intercalary plates (Fig. 7E). Consistent with the species description plate 2′′ and 4′′ of the precingular series were distinctly smaller compared to the other precingular plates (Fig. 7E). The ventral pore was located on the left side of the pre plate at the junction of the plates Po, 1′ and 2′ (Fig. 7G). Cells of both strains examined by SEM had an antapical spine and a small group of pores located on the large antapical plate 2′′′′ (Fig. 7F). A quantification of the frequency of spine presence (three independent measurements for each strain) revealed a proportion of cells without spine of 68% (n = 90), 69% (n = 16), and 84% (n = 50) for strain LF-09-B02, and 6% (n = 50), 14% (n = 50), and 26% (n = 50) for strain LF-14-F07, respectively.
3.2.1.3. Azadinium poporum. One strain from the Limfjord (station 14) was identified asAz. poporum(Fig. 8). There was no antapical spine, and pyrenoid(s) were always present in the cell and were located in the episome and/or the hyposome (Fig. 8A, B). SEM (Fig. 8D–G) revealed that all morphological features of strain LF-14-E12 conformed to the
originalA. poporumdescription, e.g. the ventral pore was located at the junction of the pore plate and the first two apical plates (Fig. 8E, G).
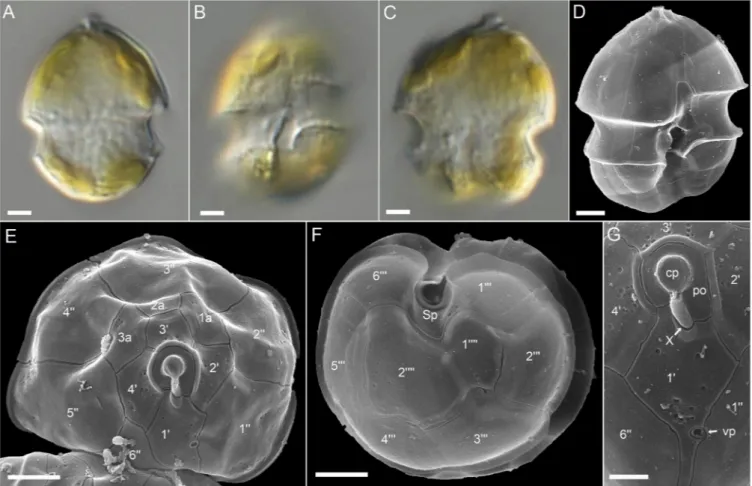
3.2.1.4. Amphidoma languida. With 20 strains, most cell cultures from the survey were obtained from the speciesAm. languidaisolated from the North Sea (station 9, 12) and Limfjord (station 14). All strains of Am. languida shared an identical morphology as observed in LM (Fig. 9A–C). In accordance with the species description, cells consistently had one large pyrenoid with a starch sheath (visible as a ring-like structure) located in the episome (Fig. 9B). Detailed SEM (Fig. 9D–G) performed for a selected number of strains (Table 1) revealed the Kofoidian plate pattern for the species (Po, cp, X, 6′, 0a, 6′′, 6C, 5S, 6′′′, 2′′′′) and the location of the ventral pore at the right side of plate 1′ close to the pore plate (Fig. 9E–G). On the hypotheca a large antapical pore was located on the second antapical plate (Fig. 9F). A number of, but not all, cells in the clonal cultures had a round ventral depression located at the anterior tip of the anterior sulcal plate (Fig. 9D).
Table 1
Amphidomatacean strain information (LM = light microscopy, SEM = scanning electron microscopy, LSU = large subunit, ITS = internal transcribed spacer, ND = not detected, – = not analysed).
Species Strain Origin
Station Length (μm) Width (μm) l/w ratio N Morphological analysis Sequence data AZA Mean ± SD
Min-max Mean ± SD
Min-max Mean ± SD
Az. dalianense LF-09-B02 09 16.6± 0.9
14.9–18.7 11.9± 0.8
10.5–13.9 1.39± 0.05 51 LM SEM LSU, ITS ND
Az. dalianense LF-14-F07 14 15.1± 1.0
13.2-18.0 10.6± 0.8
9.0-12.3 1.43± 0.07 50 LM SEM LSU, ITS ND
Az. obesum LF-12-A09 12 15.8± 1.1
13.7-18.5 11.6± 1.0
9.4-14.2 1.37± 0.06 58 LM SEM LSU, ITS ND
Az. obesum LF-12-A12 12 16.2± 1.0
14.6-18.6 12.1± 0.9
10.2-13.9 1.34± 0.07 56 LM SEM LSU, ITS ND
Az. obesum LF-44-C03 44 16.3± 1.2
12.5-18.5 12.5± 1.2
10.7-17.2 1.31± 0.11 58 LM SEM LSU, ITS ND
Az. poporum LF-14-E12 14 14.5± 0.9
12.8-16.0 10.1± 0.6
9.0-11.4 1.44± 0.07 51 LM SEM LSU, ITS ND
Am. languida LF-09-A02 09 – – – – LM LSU AZA-38, -39
Am. languida LF-09-A03 09 13.7± 1.0
10.4-16.4 10.6± 0.9
7.5-14.3 1.30± 0.09 81 LM LSU AZA-38, -39
Am. languida LF-09-A07 09 13.7± 0.8
12.1–15.3 11.1± 0.7
9.6–12.6 1.23± 0.07 52 LM LSU AZA-38, -39
Am. languida LF-09-B11 09 14.1± 0.8
12.4-16.9 11.5± 0.8
10.0-13.6 1.23± 0.05 54 LM SEM LSU AZA-38, -39
Am. languida LF-09-C02 09 – – – – LM – AZA-38, -39
Am. languida LF-09-C04 09 13.0± 0.9
10.7-14.9 10.1± 0.9
8.1-11.7 1.29± 0.06 50 LM LSU AZA-38, -39
Am. languida LF-09-C09 09 14.2± 0.9
12.6–15.8 11.9± 1.0
10.3–14.0 1.19± 0.07 21 LM LSU AZA-38, -39
Am. languida LF-09-C10 09 14.5± 0.9
11.7-16.3 11.5± 0.9
8.8-13.1 1.26± 0.08 62 LM SEM LSU AZA-38, -39
Am. languida LF-12-A04 12 – – – – LM – AZA-38, -39
Am. languida LF-14-E01 14 – – – – LM LSU AZA-38, -39
Am. languida LF-14-E07 14 13.8± 0.7
12.4-15.3 10.9± 0.7
9.9-13.3 1.27± 0.07 39 LM LSU AZA-38, -39
Am. languida LF-14-F02 14 14.4± 0.9
12.4-16.2 12.1± 1.1
9.9-14.6 1.19± 0.08 54 LM SEM LSU AZA-38, -39
Am. languida LF-14-F04 14 13.6± 0.9
11.6-15.8 11.0± 0.9
9.6-13.1 1.24± 0.07 71 LM – AZA-38, -39
Am. languida LF-14-F06 14 – – – – LM LSU AZA-38, -39
Am. languida LF-14-F08 14 – – – – LM LSU AZA-38, -39
Am. languida LF-14-F11 14 – – – – LM LSU AZA-38, -39
Am. languida LF-14-G01 14 13.9± 0.7
13.0-15.0 10.9± 1.0
10.0-12.8 1.28± 0.06 6 LM LSU AZA-38, -39
Am. languida LF-14-G06 14 – – – – LM LSU AZA-38, -39
Am. languida LF-14-G07 14 14.6± 1.1
12.0-17.1 11.6± 0.9
9.2-13.8 1.26± 0.05 52 LM LSU AZA-38, -39
Am. languida LF-14-G10 14 – – – – LM LSU AZA-38, -39
3.2.2. AZA profile of strains
No AZA were detected in both SRM and precursor mode in both strains ofAz. dalianense,in all three strains ofAz. obesum, and in the new strain ofAz. poporum(Table 1, for the respective limits of detection see Suppl. Table S2). All 20Am. languidastrains had identical AZA profiles consisting mainly of AZA-38 and AZA-39 (Table 1). Cell quotas of both compounds, however, were quite variable among strains ranging from 0.21 to 33.13 fg cell−1and 0.05 to 61.41 fg cell−1for AZA-38 and -39, respectively (Suppl. Table S3). A few selected strains were independently analysed twice with different biomass and revealed significant intra- strain variability of AZA cell quota as well (Suppl. Table S3). The ratio of AZA-38/39 for most strains was in the range of 0.38 to 0.69. One of the strains (LF-09-C09), however, exceptionally had a higher AZA-38 than AZA-39 cell quota. Two of the strains (LF-12-A04 and LF-14-F11) had an higher AZA-39 cell quota than AZA-38. As an exception, only traces of both AZA-38 and -39 were found in one strain (LF-14-F02), which was confirmed by a second independent analysis (Suppl. Table S3). For al- most allAm. languidastrains the respective phosphate forms of AZA-38 and AZA-39 were found. The peak areas of the phosphates were quite variable among strains and ranged from 0.4% to 28.6% of the respective non-phosphorylated AZA. Interestingly, for two of the strains which only showed traces of AZA-38 (LF-12-A04 and LF-14-F11), AZA-38-phosphate was present in about the same amount as AZA-38. No phosphorylated AZA were found in the strain, which only showed traces of AZA-38 and- 39 (LF-14-F02, Suppl. Table S3).
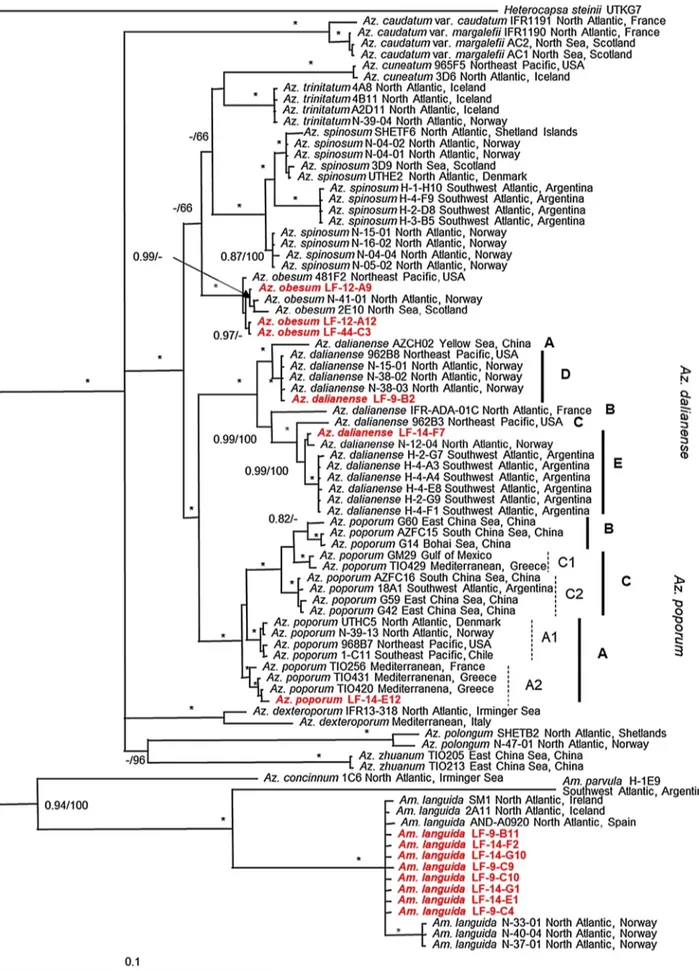
3.2.3. Phylogenetic analysis
In total, LSU sequences of 23 strains and ITS sequences of six strains of Amphidomataceae were gained in this study. ITS amplification and sequencing ofAm. languidastrains failed and was not further analysed here. Sequence data and phylogenetic placement by Bayesian inference analysis (Fig. 10) for all strains confirmed their morphological species determination. All three newAz. obesumstrains clustered within a well- supported clade with otherAz. obesumstrains from the North Sea, the North Atlantic and the Northeast Pacific. The two newAz. dalianense strains fell in two different clades: One strain (LF-09-B02) clustered together withAz. dalianensestrains from the Northeast Pacific (USA) and the Norwegian coast, referred to as Ribotype D. The second new strain (LF-14-F07) clustered together withAz. dalianensestrains of Ri- botype E from the Southwest Atlantic (Argentina) and the Norwegian coast. Strains from Yellow Sea, China, the North Atlantic (France), and the Northeast Pacific (USA) were classified as Ribotypes A, B and C, respectively. The newAz. poporumstrain (LF-14-E12) clustered within Ribotype A2, together with strains from the Mediterranean. All 17 new Am. languidastrains shared identical LSU sequences and fell into the same well-supported clade with strains of Ireland, Iceland and Spain, but were slightly separated from strains isolated from the Norwegian coast.
Fig. 6.Light and scanning electron micrographs ofAzadinium obesum(strain LF-44-C03). (A–C) LM, living cells to illustrate general size and shape. Note the lack of a pyrenoid. (C) Presumably early stage of cell division. (D–G) SEM. (D) Whole cell in ventral lateral view. (E) Epithecal plates in apical view. (F) Hypothecal plates in antapical view. (G) Detailed view of the apical pore complex and the first apical plate. Plate labels according to the Kofoidian system. Sp = posterior sulcal plate, cp = cover plate, X = X-plate, vp = ventral pore, po = pore plate. Scale bars =2 μm (A–F) or 1 μm (G).
4. Discussion
4.1. Distribution, diversity and abundances of Amphidomataceae The pre-scanning real-time PCR assay targeting all amphidomata- cean species (Smith et al., 2016) and live microscopy of selected sam- ples revealed that this group of microalgae is present all along the Danish coast. This includes all but one station of the North Sea, the western entrance of Limfjord, and all stations of the Danish east coast from Kattegat through the Belt area down to Kiel Bight. Amphidoma- taceae were not detected at many of the inner Limfjord stations, in- cluding the high chlorophyll central stations 18 and 25. The reasons for this absence remain unclear; higher temperatures of Limfjord compared to the outer coastal area may play a role, but higher temperature was also recorded at the fjord entrance whereAm. languidawas present.
Different to the qualitative PCR assay, qPCR positive hits for the three toxigenic speciesAz. spinosum,Az. poporumandAm. languidawere more restricted. These species were mainly recorded from the North Sea and from the western Limfjord stations, where highest abundances were observed. At the eastern Danish stations, positive hits (and low back- ground abundance) only for the upper Kattegat stations indicate that here these species probably are introduced from the North Sea/
Skagerrak, but are not spreading largely into the lower salinity Belt area. It is not clear if decreasing salinities along the Kattegat north- south gradient might represent a physiological barrier for the toxigenic amphidomatacean species. For Az. spinosum, culture experiments showing positive growth over a wide range of different salinities (Jauffrais et al., 2013) and positive qPCR signals forAz. spinosumfor inner, low saline areas of two deep Norwegian Fjords (Tillmann et al., 2018) indicate that this species can cope with or can adapt to lower
salinities. In contrast,Az. poporumprobably has preferences for higher saline areas as this species was present in Norwegian offshore waters but not in the inner lower saline area of the fjords (Tillmann et al., 2018). In any case, more detailed physiological data related to salinity for different strains of Amphidomataceae are needed to fully evaluate the potential of AZA contamination in the lower saline Baltic areas.
Extended positive pre-scanning PCR signals of Amphidomataceae for the lower saline Belt area down to Kiel Bight clearly indicate that species other than the three toxigenic species are present. This was confirmed by a strain ofAz. obesum,which was isolated at station 44 in Kiel Bight at a salinity of 13. This strain was grown at a salinity of 15 but was easily adapted to and grown at a salinity of 34 (unpublished).
This finding, together with almost identical sequence data of the Baltic strain and otherAz. obesumstrains from other areas indicate that there is not a distinct and separated low salinity population ofAz. obesum present. No AZA were found in the newAz. obesumstrains from the North Sea and from Kiel Bight, which confirms previous findings (Kim et al., 2017;Tillmann et al., 2010,2018) that this species is not toxi- genic.
Azadinium dalianense is reported here for the first time in the southern North Sea, which further indicates that this species has a ra- ther widespread global distribution. Besides to the type locality in China, the species is recorded from the French Atlantic coast, in the north-east Pacific (Kim et al., 2017;Luo et al., 2017), along the Nor- wegian coast (Tillmann et al., 2018), and in the south Atlantic off Ar- gentina (Tillmann et al., 2019). All available strains of the species share the same morphology, but exhibit significant sequence differences. Two different ribotypes were initially distinguished (Kim et al., 2017), but with all sequence information actually available a much broader di- versity withinAz. dalianensewith 5 different clusters is evident, but Fig. 7.Light and scanning electron micrographs ofAzadinium dalianense(strain LF-14-F07). (A–C) LM, living cells to illustrate general size and shape. Note the presence of a small antapical spine (arrow in A) and one pyrenoid located in the hyposome (arrow in B). (D–G) SEM. (D) Whole cell in ventral view. (E) Epithecal plates in apical view. (F) Hypothecal plates in antapical view. (G) Detailed view of the apical pore complex with the ventral pore. Plate labels according to the Kofoidian system. Sp = posterior sulcal plate, cp = cover plate, X = X-plate, vp = ventral pore, po = pore plate. Scale bars =2 μm (A–F) or 0.5 μm (G).
consistent and significant morphological differences between ribotypes have not been observed so far. Both new strains from Denmark cluster differently, strain LF-09-B02 isolated from the North Sea within Ribo- type D and the strain LF-14-F07 isolated from Limfjord within Ribotype E (Fig. 10). Such a sympatric occurrence of different ribotypes in one area has been noted before for Puget Sound, North West Pacific (Kim et al., 2017), and the North Atlantic along the Norwegian coast (Tillmann et al., 2018). All new strains ofAz. dalianensefrom Denmark do not produce any known AZA, which supports evidence from other geographical regions that this species is a non-AZA producer.
Generally, the qPCR determined abundances of toxigenic amphi- domatacean species were low ranging from 101to 103cells L−1. The speciesAmphidoma languida,with a peak abundance of 3 × 10³cells L−1, was the by far most abundant of the three toxigenic species, which is supported by the relatively large number of Am. languidastrains obtained from the North Sea and western Limfjord stations. However, maximum abundance in the range of 3 × 10³ cells L−1are still low compared to bloom concentrations of Amphidomataceae that may be as high as 106 cells L−1(Az. polongumbloom in Peru, (Tillmann et al., 2017b) or 107cells L−1(Az. luciferelloidesin Argentina, (Akselman and Negri, 2012)).
In agreement with the relative high abundance ofAm. languidain the field samples, the majority of strains obtained in this study were Am. languida. Without exception all these strains produce AZA-38 and -39 (albeit one of the strains has only trace amounts of both com- pounds) indicating that this AZA profile is predominant for North Sea and North Atlantic strains of that species (Krock et al., 2012;Tillmann et al., 2018). The large number of strains furthermore allows evaluating the intraspecific range of AZA cell quota for Am. languida, and with
almost 1,000-fold differences, this is remarkably high. The multiple strain analysis further reveal that the ratio of AZA-38 and -39 can be variable, indicating that there are no biosynthetic constraints de- termining and limiting the ratio of both compounds present in the cells.
4.2. Distribution and abundances of azaspiracids
The distribution and abundance of AZA-producing species de- termined by qPCR reflects the chemically determined presence of AZA.
Generally, an AZA-based “cell detection limit” (based on the LOD of the AZA measurements of ca. 40 pg L−1and an assumed cell quota of 10 fg cell−1) of 4 × 10³cells L−1is three orders of magnitude higher than the LOD of the qPCR analysis, which is about 2 cells L−1, and this ex- plain a lack of AZA signals in areas where qPCR signals were low (Fig. 4). AZA-1, which is yet known only fromAz. spinosum(Tillmann et al., 2009,2018) was present in low amounts only at station 10, the only station where the qPCR-determined abundance ofAz. spinosum was > 10 cells L−1. Likewise, the detection of the two congeners AZA- 38 and -39, which are up to now only known fromAm. languida(Krock et al., 2019), corresponds to the highest abundances ofAm. languidain the field. In the present study, amphidomatacean species-specific PCR assays are used for the first time in a quantitative way. Therefore, cell densities of AZA-producing species can be compared quantitatively to the concurrent AZA quantities. The corresponding AZA cell quota of Am. languida based on the cell abundance determined by qPCR and toxin amount determined by LC–MS/MS at station 14 was estimated as ca. 900 fg cell−1. This is relatively high compared to laboratory studies on the AZA content of this species. AZA cell quotas estimated for var- ious Am. languida strains range between 2.4 and 38.1 fg cell−1 Fig. 8.Light and scanning electron micrographs ofAzadinium poporum(strain LF-14-E12). (A–C) LM, living cells in ventral (A, B) or lateral (C) view. Note the pyrenoids (arrows in A, B). (D–G) SEM. (D) Whole cell in ventral view. (E) Epithecal plates in apical view. (F) Hypothecal plates in antapical view. (G) Detailed view of the apical pore complex with the ventral pore. Plate labels according to the Kofoidian system. Sp = posterior sulcal plate, cp = cover plate, X = X-plate, vp = ventral pore, po = pore plate. Scale bars =2 μm (A–F) or 0.5 μm (G).
(Tillmann et al., 2015,2017a,2018), but among the new strains may be as high as ca. 100 fg cell−1(this study). For AZA-1 andAz. spinosumat station 9, a respective cell quota calculation revealed a quota of 2,700 fg AZA cell−1. This is also substantially higher compared to published lab study based AZA cell quotas for this species. These nor- mally are in the range of 10–20 fg cell−1, and only exceptionally can reach ca. 200 fg cell−1at low temperatures (Jauffrais et al., 2013).
There are multiple factors potentially contributing to such a mis- match between field sample based and laboratory based toxin cell quota estimates. Toxin analysis of field samples may not only include toxins of intact Amphidomataceae cells but also toxins associated with small protistan grazers and/or detritus. Moreover, toxin production of field populations might generally be higher compared to strains grown under artificial conditions in the laboratory. Nutrient concentrations, which often are unrealistically high in cultures or chemical cues of grazers are two examples of factors that are discussed to affect microalgal toxin production (Anderson et al., 1990;Lundholm et al., 2018). And last, but not least, qPCR quantification, which generally is challenging for low target concentrations, can be biased by differences in copy numbers between the strain used to prepare standard curves and the field po- pulation (Galluzzi et al., 2010). In the present study, however, the local Limfjord strain LF-09-C09 ofAm. languidawas used for quantification.
Adding known numbers of cells of this strain to field samples of a previous study revealed a recovery of almost 100% (Wietkamp et al., 2019). In conclusion, for a clarification of the high calculated cell quota further detailed studies are needed.
In case ofAz. spinosum, the discrepancy might also be related to specificity of the qPCR assay. The specific primer/probe set for Az.
spinosumwas published byToebe et al. (2013)based on the DNA of strains that were available at that time. Now, with many more available
strains ofAz. spinosum,significant genetic variability with at least three different ribotypes within Az. spinosum is evident (Tillmann et al., 2019), and that differentAz. spinosumribotypes co-occur in the North Sea (southern Norway,Tillmann et al., 2018). It thus has to be kept in mind that sequence differences between the primers/probes and the LSU of the local field sample population may have affected efficiency and therefore quantification (underestimation) of the qPCR assay.
4.3. Azadinium poporum
The most interesting finding based on the new Danish strains is that there is a non-AZA producing ribotype ofAz. poporumpresent in the area. The species is described based on three strains from the southern Danish North Sea coast (Tillmann et al., 2011). These strains, albeit initially reported as non-AZA producers, are the source of AZA-37 (Krock et al., 2015), which was unknown at the time when the species was described. Over the last years, a significant diversity ofAz. poporum strains, both in AZA profile and sequence data has become evident (Gu et al., 2013;Krock et al., 2014;Luo et al., 2018), and strains without detectable AZA are known as well (Krock et al., 2014;Luo et al., 2018).
A significant number of non-AZA producing strains were recently re- ported from the Greek Mediterranean area, and interestingly the new Limfjord strain clusters in Ribotype A2 together with those strains (Fig. 10). However, absence of AZA is not consistently related to this ribotype, as traces of AZA are present in some of the Greek strains (Luo et al., 2018), and one Mediterranean Ribotype A2 strain from Corsica (TIO256) produce significant amounts of AZA-2 (Luo et al., 2017). For the North Sea Ribotype A2 strain LF-14-E12, even very high biomass samples did not reveal any traces of AZA indicating that in the southern North Sea a non-toxigenic ribotype ofAz. poporumco-occurs with AZA- Fig. 9.Light and scanning electron micrographs ofAmphidoma languida(strain LF-14-F02). (A–C) LM, living cells in ventral (A, B) or ventral lateral lateral (C) view.
Note the pyrenoid in the episome (arrow in B). (D–G) SEM. (D) Whole cell in ventral view. (E) Epithecal plates in apical view. (F) Hypothecal plates in antapical view.
(G) Detailed view of the apical pore complex with the ventral pore. Plate labels according to the Kofoidian system. Sp = posterior sulcal plate, cp = cover plate, X = X-plate, vp = ventral pore, po = pore plate. Scale bars =2 μm (A–F) or 1 μm (G).
Fig. 10.Phylogeny ofAzadinium obesum,Az. dalianense,Az. poporumandAmphidoma languidainferred from concatenated SSU, ITS and partial LSU rDNA sequences using Maximum likelihood (ML).Heterocapsa steiniiwas used as outgroup. New sequences are indicated in red. Ribotypes are labeled and marked with vertical lines on the right, with dashed lines indicating subribotypes. Branch lengths are drawn to scale, with the scale bar indicating the number of nucleotide substitutions per site. Numbers on branches are statistical support values to clusters on the right of them (left: Bayesian posterior probabilities; right: ML bootstrap support values). * indicate maximal support (BPP = 1.00 and ML BS = 100). (For interpretation of the references to colour in this figure legend, the reader is referred to the web version of this article).