Contents lists available atScienceDirect
Journal of Marine Systems
journal homepage:www.elsevier.com/locate/jmarsys
Factors controlling the carbon isotope composition of dissolved inorganic carbon and methane in marine porewater: An evaluation by reaction- transport modelling
Patrick Meister
a,⁎, Bo Liu
b,1, Arzhang Khalili
c,d, Michael E. Böttcher
b,e,f, Bo Barker Jørgensen
c,gaDepartment for Geodynamics and Sedimentology, University of Vienna, Althanstrasse 14, 1090 Vienna, Austria
bGeochemistry & Isotope Biogeochemistry Group, Department of Marine Geology, Leibniz Institute for Baltic Sea Research (IOW), Seestraße 15, 18119 Warnemünde, Germany
cMax Planck Institute for Marine Microbiology, Celsiusstraße 1, 28359 Bremen, Germany
dEarth & Space Sciences Program, School of Engineering and Science, Jacobs University, 28725 Bremen, Germany
eMarine Geochemistry, University of Greifswald, Friedrich-Ludwig-Jahn Str. 17a, 17489 Greifswald, Germany
fDepartment of Maritime Systems, Interdisciplinary Faculty, University of Rostock, Albert-Einstein-Straße 21, 18059 Rostock, Germany
gCenter for Geomicrobiology, Department of Bioscience, Aarhus University, Ny Munkegade 114, 8000 Aarhus, Denmark
A R T I C L E I N F O Keywords:
Carbon isotopes Methanogenesis
Anaerobic methane oxidation Reaction-transport model Methane
Marine porewater
A B S T R A C T
Carbon isotope compositions of dissolved inorganic carbon (DIC) and methane (CH4) in porewater of marine sediments at seafloor temperatures show very large variation covering a δ13C range from −100‰ to +35‰.
These extreme values are the result of isotope fractionation during microbial carbon metabolism, but the combined effect of all factors controlling the isotope distributions is still not completely understood. We used a model approach to evaluate the effects of reaction and transport on carbon isotope distributions in modern sediment porewater under steady state. Simulated δ13CDICprofiles typically show negative values in the sulphate reduction zone and more positive values in the methanogenic zone. With increasing depth in the methanogenic zone, δ13C values approach a distribution where the offset of δ13CDICfrom δ13C of total organic carbon (TOC) to more positive values is similar to the offset of δ13CCH4to more negative values (δ13CDICand δ13CCH4approach a symmetric distribution relative to δ13CTOC). The model never exceeds this symmetry of the DIC-CH4couple towards more positive values under steady-state conditions in a purely diffusive system.
Our model shows that to reach an offset in δ13C between DIC and CH4in the order of 70‰, as frequently observed in methanogenic zones, a larger fractionation than reported from culture experiments with acetoclastic or autotrophic methanogens would be required. In fact, the observed isotope offset in natural systems would be consistent with the known inorganic equilibrium fractionation factor at in-situ temperature, which may suggest isotope exchange via a microbial pathway, during methanogenesis.
Furthermore, the model reproduces strongly negative δ13CCH4values at the sulphate methane transition (SMT) as result of a reverse flux of carbon from DIC to CH4during AOM. Such a reverse AOM has no influence on the δ13CDICat the SMT as methane is almost completely consumed. Only at high sedimentation rate combined with low porosity, δ13CDICvalues significantly more negative than δ13CTOCoccur at the SMT.
1. Introduction
Some of the largest differences in stable carbon isotope composition in nature occur between dissolved inorganic carbon (DIC) and biogenic methane (CH4) (Hoefs, 2018) as found in marine sediment porewater.
Extremely 13C-depleted methane is observed with δ13C values more negative than −100‰ (e.g., Claypool and Kaplan, 1974; Galimov,
2006;Heuer et al., 2009). In turn, extremely positive values of +35‰
have been observed in DIC (e.g.,Heuer et al., 2009). The variation of carbon fluxes into and out of the seafloor is thought to have contributed to some of the largest perturbations of the carbon cycle in Earth history.
For example, the release of the greenhouse gas methane from the de- composition of gas hydrates has been suggested to have caused global warming events, such as the Palaeocene-Eocene thermal maximum,
https://doi.org/10.1016/j.jmarsys.2019.103227
Received 5 March 2019; Received in revised form 10 July 2019; Accepted 4 August 2019
⁎Corresponding author.
E-mail address:patrick.meister@alumni.ethz.ch(P. Meister).
1current address: Alfred-Wegener Institute – Helmholtz Centre for Polar and Marine Research, Am Handelshafen 12, 27570 Bremerhaven, Germany.
Available online 13 August 2019
0924-7963/ © 2019 Elsevier B.V. All rights reserved.
T
accompanied by major negative excursions in δ13C of atmospheric CO2
(Dickens, 1997, 1999). In contrast, positive excursions in δ13C in the Proterozoic carbonate record have been suggested to represent an in- creased burial rate of isotopically light organic carbon (e.g.Schidlowski et al., 1984;Knoll et al., 1986; cf. alsoPayne et al., 2004), although calculations by Hayes and Waldbauer Jr. (2006) suggest that burial rates would have to be unrealistically high to explain such large ex- cursions. Instead, they suggested an early diagenetic origin of13C-en- riched carbonates related to methanogenesis (cf.Birgel et al., 2015).
Furthermore, a part of the buried organic carbon is remineralized and may be precipitated as carbonate in the deep subsurface, thereby becoming preserved in the geological record (Schrag et al., 2013). It remains unclear how both positive and negative carbon isotope com- positions are incorporated into diagenetic carbonates, commonly showing a large range of values (Murata et al., 1967; Pisciotto and Mahoney, 1981; Kelts and McKenzie, 1984; Rodriguez et al., 2000;
Moore et al., 2004). Temporal and spatial Variations in the C-isotope composition preserved in the diagenetic carbonate record were sug- gested to indicate changes in microbial activity in a dynamic sub-sea- floor biosphere (Malone et al., 2002;Meister et al., 2007, 2008, 2019;
Contreras et al., 2013;Meister, 2015;Wehrmann et al., 2016). How- ever, further studies using reaction-transport models will be necessary to precisely interpret these carbon isotope signatures with respect to past dynamics of the deep biosphre.
While the global perturbations of carbon isotopes in ocean and at- mosphere are a matter of ongoing debate, they are largely driven by the dynamics of carbon isotopes in the subsurface, but also these processes are incompletely understood. During the early phase of the Deep Sea Drilling Project (DSDP; e.g.,Presley and Kaplan, 1971, 1972;Claypool et al., 1973; Goldhaber, 1974) C isotopes of CH4and DIC were sys- tematically measured in deep sub-seafloor porewater. WhileBottinga (1969)suggested an equilibrium fractionation between the two species, it is generally assumed that the strong isotope fractionation is a result of enzymatic processes of microorganisms, as spontaneous reactions be- tween DIC and CH4would not occur at near-surface seabed tempera- tures. Fractionation occurs during fixation of CO2by phytoplankton, resulting in the deposition of isotopically light organic carbon on the seafloor (δ13C usually between −20 and −30‰). This negative isotope signature is transferred into DIC produced by microbial organic carbon oxidation. Thus, δ13CDICvalues in marine porewater are typically ne- gative in the zone of dissimilatory sulphate reduction (Claypool and Kaplan, 1974). In contrast, higher δ13CDICvalues result from metha- nogenesis due to strong kinetic fractionation, as CH4is depleted in13C and the remaining DIC is enriched in13C.
In several studies, fractionation factors during these processes have been calculated based on the isotopic composition of C species in marine porewater (e.g., Alperin et al., 1992; Whiticar, 1999) or in culture experiments (Krzycki et al., 1987; Londry et al., 2008). The experiments showed that fractionation also occurs during methano- genesis from disproportionating acetate into CO2 and CH4 (Londry et al., 2008). The isotopically lightest DIC is produced when CH4 is transported to the sulphate-methane transition zone (SMT) and is anaerobically oxidized to DIC (anaerobic oxidation of methane; AOM).
This process is subject to smaller fractionation (Alperin et al., 1992).
Holler et al. (2009)observed a reverse flux of14C label from DIC to methane during AOM, and this flux increases if the free energy differ- ence of the forward reaction decreases at low sulphate concentration (Yoshinaga et al., 2014). This finding suggests a partial isotopic equi- libration of methane and DIC through the enzymatic pathway. This raises the question whether (as suggested byBottinga, 1969) also other pathways allow for equilibrium fractionation, including acetoclastic and autotrophic methanogenesis.
Besides the fractionation factor and mechanism, it also remains poorly understood how transport processes affect carbon isotope pro- files of CH4 and DIC in a dynamic sedimentary porewater system.
Nissenbaum and Presley (1972) suggested a closed-system Rayleigh
fractionation model, which was further developed by Claypool and Kaplan (1974), Whiticar and Faber (1986), andPaull et al. (2000).
Alperin et al. (1988) included the conversion of CO2 to CH4 during AOM in an open-system model, but they did not take into account the full stoichiometry of the overall processes of CH4generation and con- sumption. Several open-system transient reaction-transport models have been developed since then, e.g. byZeebe (2007),Chatterjee et al.
(2011),Wu et al. (2018), andChuang et al. (2019). While these studies addressed particular problems of diffusive transport, they only con- sidered sub-sets of reactions affecting carbon isotope distribution in the sediment. Hence a better understanding of the carbon isotope dis- tributions in sedimentary porewater awaits a more integrated model approach of the overall reactions and transport processes. An integrated reaction-transport model would also be fundamental to correctly in- terpret measurd carbon isotope profiles and ultimately to assess the global fluxes of carbon burial, rates of organic carbon remineralization and gas escape causing global perturbations in the carbon cycle.
In this study we developed a reaction-transport model to calculate δ13C values of CH4and DIC in sulphate reduction and methanogenic zones of marine sediments. The model calculates the diffusive transport of sulphate, DIC, and CH4 and their carbon isotope compositions.
Production and consumption of these solutes are linked via dissim- ilatory sulphate reduction and methanogenesis to the degradation rates of organic matter and via anaerobic methane oxidation to known ki- netic rate laws. Carbon isotope fractionation is also linked to these re- actions, using fractionation factors from the literature. Despite the great complexity of the carbon isotope system, this model setup provides a basic concept to calculate carbon isotope distributions in a diagenetic system. We demonstrate how a relatively small number of parameters, including the reactivity and the rate of deposition of organic matter on the seafloor, essentially control the patterns observed in measured profiles. The goal of the present study was to establish a general steady- state model for sediment carbon isotopes and test the sensitivity with respect to the magnitude of major controlling factors, in particular the isotope fractionation factors. This model allows us to understand cause and consequence relationships that are not intuitively understandable from sediment carbon isotope data. In comparison with measured iso- tope profiles, our model provides an instrument to understand how the distribution of stable carbon isotopes is controlled in natural environ- ments.
2. Modelling approach 2.1. Reaction-transport model
Sulphate, methane, and DIC concentration profiles were computed as a function of sedimentation rate, diffusion rate, organic matter de- gradation rate, and anaerobic methane oxidation rate using the tran- sient reaction transport model described inMeister et al. (2013). The following equations were used for sulphate (Eq.(1)), methane (Eq.(2)) and DIC (Eq.(3)):
= +
[SO ] t
[SO ] z
D [SO ]
z m1
2s s
42
24 SO
2
2 42
2 TOC AOM
42
(1)
= + +
+ [CH ]
t
[CH ] z
D [CH ]
z (1 m)1
2
s s v A ([CH ] [CH ] )
z
4 4 CH
2
2 4
2
TOC AOM CH 4 4 sat
4
4 (2)
= + + +
+ [DIC]
t
[DIC]
z
D [DIC]
z m s (1 m)1
2
s s
HCO 2
2
2 TOC
TOC AOM 3
(3) where [SO42−], [CH4] and [DIC] are the concentrations of sulphate, methane, and DIC, respectively, t is time, ω is the sedimentation rate, z is the depth below seafloor, and DSO42−, DCH4, and DHCO3− are the
molecular diffusion constants for sulphate, methane and bicarbonate (which is the most abundant species of DIC under circum-neutral pH).
Diffusion constants for seawater at porewater temperature are from Schulz and Zabel (2006). A constant porosity (ϕ) of 0.7 was assumed and the tortuosity (τ) in Eqs. (1)–(3) was calculated according to Boudreau (1997)asτ2= 1 - ln (ϕ2). In addition, the effect of a changing porosity with depth was tested, using the decay function,ϕ= 0.4 + 0.3
· e-z/150, in the general reaction-transport equations (Suppl. C) used previously (Arndt et al., 2009). Furthermore, sTOCand sAOMare source/
sink terms linked to metabolic turnover, whereby the Monod term m expresses the electron acceptor limitation during sulphate reduction (see below). The rise of supersaturated methane as gas phase was si- mulated by an upward advection term in Eq.(2), where vCH4is the rise velocity of methane gas bubbles and the criterion A = 1 if [CH4] > [CH4]sat and A = 0 if [CH4] ≤ [CH4]sat limits methane ad- vection to the supersaturated depth interval (Meister et al., 2013). The saturation concentration of methane [CH4]satwas calculated from the polynomial equation (Dale et al., 2008a;Duan et al., 1992):
where T is the temperature, S is the salinity, and P is the hydrostatic pressure. For the modelled cases a water depth of 200 m was assumed.
Ocean water salinity was assumed for S. All parameters with values and units are listed inTable 1.
2.2. Sources and sinks
Sources and sinks of methane, sulphate, and DIC are stoichiome- trically coupled to rates of organic carbon decay via the following simplified reactions for sulphate reduction (Eq.(5)) and methanogen- esis (Eq.(6)):
+ + + +
SO42 2 [CH O]2 HS 2 HCO3 H (5)
+
2 [CH O]2 CH4 CO2 (6)
The sink of sulphate and source of methane, respectively, are cal- culated according to the stoichiometries in Eqs.(5) and (6)from the organic matter decay rate sTOCin Eqs.(1)–(3). Thereby sTOCis calcu- lated from the derivative of organic matter decay with time (Eq.(7)):
=
s TOC (1 )
100 M / t
TOC s
C (7)
where ρsis the dry density of the sediment and MCis the molecular weight of carbon. ∂t is linked with ∂z through the sedimentation rate.
For organic matter decay, the reactive continuum (RC) model of Boudreau and Ruddick (1991)(Eq.(8)) was applied:
= +
TOC(t) TOC a (a t)
0 RC
RC (8)
where TOC(t) is the TOC remaining at sediment age t, TOC0is the initial Table 1
List of all parameters, their values and units.
Parameter Symbol Value Unit Comments
Domain and physical constraints:
Waterdepth zW 200 m mbsl
Domain size zD 200 m mbsf
Sedimentation rate ω 0.08 (0.02–0.32a) m/ka typical value for ocean margin sediments
Temperature T 283 K average temperature in marine sediment
Pressure at the sediment/water interface P 20 bar based on water depth
Salinity S 35 assumed normal seawater salinity
Diffusion parameters:
Diffusion constant for sulphate DSO42- 0.0214 m2/a at 10 °C (Schulz and Zabel (2006))
Diffusion constant for methane DCH4 0.0334 m2/a at 10 °C (Schulz and Zabel (2006))
Diffusion constant for DIC DHCO3- 0.0232 m2/a at 10 °C (Schulz and Zabel (2006))
Porosity ϕ 0.7 (0.5–0.8a) – based on data inEinsele (2000)
Concentration of SO42−in seawater [SO42−] 28 mM modern seawater
Concentration of CH4in seawater [CH4] 0 mM modern seawater
TOC degradation:
Initial TOC (during sedimentation) TOC0 1–8 wt% variable
Dry density of sediment ρs 2.6*103 kg/l from measured data
Initial age of organic matter aRC 4735–8,100,000 a Boudreau and Ruddick (1991)
RC-parameter ν 0.7 (0.2–2a) – Boudreau and Ruddick (1991)
Kinetics of metabolic reactions:
Monod constant of sulphate reduction KS 1 mM Arndt et al. (2006)
Monod constant of AOM KS, AOM 1 mM Nauhaus et al. (2002)
First order rate constant for CH4during AOM kAOM 4*10−2 a−1 based on thickness of AOM zone
Isotope fractionation:
VPDB standard RStd 0.0111802 ‰ VPDB Zhang et al. (1990)
Isotopic composition of TOC δ13CTOC −25 ‰ VPDB typical value for marine TOC
Isotopic composition of DIC in seawater δ13CDIC,SW 0 ‰ VPDB modern seawater
Fractionation factor acetoclastic methanogen. αac 0.95–1 – Whiticar et al. (1986);Londry et al. (2008)
Fractionation factor autotrophic methanogen. αaut 0.95–1 – Whiticar et al. (1986);Londry et al. (2008)
Kinetic fractionation factor for AOM αAOM 0.98–1 – variable
Equilibrium fr. factor CH4- CO2 αeq 0.93 – Richet et al. (1977),Horita (2001)at 10 °C
Rel. contribution of autotrophy r 0–1 – variable
Maximal AOM back flux rel. to net forw. flux sAOMmax 60, 75, 90 % based on Yoshinaga et al. (2004)
Fitting parameter for the back flux b 1 mM based on Yoshinaga et al. (2004)
a in the suppl. material.
= + + +
[CH ]4 sat 1.4388 10 STP7 4.412 10 TP5 406842 10 SP5 4.129 10 ST9 1.43465 10 P2 1.6027 10 T6 1.2676 10 S6 4.9581 10 4 (4)
TOC upon sedimentation, and aRCandνare fitting parameters in the reactive continuum model. TOC at any depth z is estimated from TOC at time t using the sedimentation rate, ω. The parameter aRCdescribes the average lifetime of the more reactive compounds. The parameterνis a
“nondimensional parameter solely related to the shape of the dis- tribution near k = 0”, where k is the reactivity (Boudreau and Ruddick, 1991). As described inArndt et al. (2006), electron acceptor limitation of organoclastic sulphate reduction was considered by a Monod-term m = [SO42−] / ([SO42−] + KS) with a KSof 1 mM (1.6 mM was used by Boudreau and Westrich, 1984). As it has been recently found that a high-affinity sulphate-reduction may be induced at low sulphate con- centrations (KS= 2.6 μM;Tarpgaard et al., 2011, 2017), the sensitivity of the model results for different half saturation constants was tested.
An additional sink of methane and sulphate and source of DIC in Eqs.(1), (2) and (3)is due to AOM:
+ + +
SO42 CH4 HS HCO3 H O2 (9)
During AOM, sulphate and methane are consumed (and DIC is pro- duced) in a 1:1 ratio. As this reaction is catalysed by living microbial communities, we describe the rates of AOM by a Monod type kinetic function (Treude et al., 2003;Arndt et al., 2006).
= +
s k [CH ] [SO ]
K [SO ]
AOM AOM 4 42
S,AOM 42 (10)
with a Monod constant KS,AOMof 1 mM (Arndt et al., 2006). The first order rate constant kAOMstrongly affects the thickness of the overlap zone between methane and sulphate and we found a value of 4*10−2 a−1 to fit with the overlap zone commonly observed at SMTs. Ac- cording toKnab et al. (2008), AOM is controlled by the kinetic drive while the thermodynamic drive only limits the feasibility of the AOM- SRR process.
2.3. Isotope fractionation
Isotopic compositions were calculated from the modelled ratio R = [13C]/[12C] relative to the ratio RVPDB of the Vienna Peedee Belemnite standard (VPDB) according to:
=
C R R
R 1000
13 VPDB
VPDB (11)
The δ13C value is reported in permil VPDB, which is equivalent to milli- Urey ('mU'; Brand and Coplen, 2012). Absolute concentrations of [13CH4], [12CH4], [13DIC], and [12DIC] were computed by separate reaction-transport equations (Eq.(2)for methane and Eq.(3)for DIC) for each isotope, and isotope fractionation was applied to the different source and sink terms, such that always:
= +
s s13 s12 (12)
2.3.1. Sulphate reduction
Negligible carbon isotope fractionation was observed during orga- noclastic sulphate reduction (Claypool and Kaplan, 1974), and also fractionation factors determined in culture experiments (Londry and Des Marais, 2003) were near to one. Therefore, we assumed that this source of inorganic carbon has the same isotopic composition as the organic source pool.
2.3.2. Methanogenesis
Methanogenesis may occur via two major pathways: the autotrophic pathway using CO2and H2and the acetoclastic pathway using acetate.
Although the overall stoichiometry from TOC to CH4and DIC is the same for both pathways, they may show different isotope fractionation.
Autotrophic methanogenesis yields a larger isotope fractionation than acetoclastic methanogenesis (with an apparent fractionation factor of 0.92–0.95; Whiticar et al., 1986).Whiticar et al. (1986)calculated a
fractionation factor2 from measured porewater profiles, i.e. for the overall reaction. However, during autotrophic methanogenesis also a fermentation step has to be taken into account, which produces H2as a driving force for autotrophic methanogenesis, but this fermentation also produces CO2. The overall reaction is thus:
+ +
2 [CH O]2 +2H O 2 CO 4 H CO CH
2 2 2H O
2 4
2 2
(13) The source term for autotrophic methane production shows the isotopic ratio R'CH4(the isotopic ratio of the instantaneously produced CH4):
= =
R s
s R
CH 13 CH aut
12 CH aut aut DIC
4 4
4 (14)
R'CH4 is equivalent to the ratio of the production rates of each iso- topologue, if both the denominator and the numerator is divided by time. For DIC production the situation is more complex as two moles of CO2are produced by fermentation with little or no fractionation, and one mole of CO2 is consumed by the autotrophic reaction with the fractionation factor αaut. Hence:
s =
s13 DICferm R
12 DICferm TOC
(15) s =
s13 DICaut R
12 DICaut aut DIC (16)
and
+ =
sDIC(ferm aut) sDICferm sDICaut(for each isotope) (17) However, the fractionation factors derived from the isotopic dif- ference between δ13CCH4and δ13CDICalso include the fermentation step according to Eq.(13), and hence the α-values given inWhiticar et al.
(1986)cannot be used for αaut. However, values for αautcan be mea- sured directly in culture experiments where the electron donor H2was added (cf. references inTable 2). Most separation factors are in the order of 45‰ (isotope separation factorε= 1000 ln α) for autotrophic and 20‰ for acetoclastic methanogenesis.
During acetoclastic methanogenesis, one mole of each CO2and CH4
is produced by the disproportionation of acetate:
+ + +
CH COO3 H CO2 CH4 (18)
Thereby, the carboxyl carbon is turned into CO2and the methyl carbon to CH4, and the isotopic composition of each would be pre-set by the
13C distribution in the acetate molecule. This intramolecular isotope distribution would not produce large fractionation effects between CO2
and CH4(Blair and Carter Jr., 1992;Sugimoto and Wada, 1993) but as the exact metabolic reaction pathway is unclear, exchange reactions between DIC and CH4remain optional.
Independent of the pathway, the sources of methane and DIC are in isotopic proportion with the original organic matter multiplied by the fractionation factor αacand 2-αac, respectively (Eqs.(19) and (20)).
s =
s13 CH ac R
12 CH ac4 ac TOC
4 (19)
s =
s13 DICac (2 ) R
12 DICac ac TOC
(20) The term 2-α is due to mass balance. While the abundant isotope,
12C, can be assumed to be approximately invariant:
s12 CH4ac s12 DICac (21)
the fractionation factors can be expressed as a ratio of the product over the reactant:
2The original values provided byWhiticar et al. (1986)(α′ = 1.05–1.09) have been converted to α = 1/α′ = RProduct/RReactant. Even though traditionally α′ is reported, this notation allows for simplification of the formulas provided below.
=
For CH : ( C x)/ C
C / C
4 ac(CH )
13 TOC 12
TOC 13 TOC 12
TOC
4 (22)
= +
For DIC: ( C x)/ C
C / C
ac(DIC)
13 TOC 12
TOC 13 TOC12
TOC (23)
where13CTOCand12CTOCstand for the concentrations of carbon iso- topes in TOC, and x is the amount by which13C is increased or de- creased in the product relative to13CTOC. If Eq.22is solved for x, and x is substituted in Eq.23, it results that:
=2
ac(CH )4 ac(DIC) (24)
The value of αacis generally smaller than αaut. A compilation of experimentally determined fractionation factors from pure cultures given in the literature is shown inTable 2.
The overall sources of methane and DIC from methanogenesis are then (for each isotope):
= +
sCH meth4 sCH aut4 sCH ac4 (25)
= + +
sDICmeth sDIC(ferm aut) sDICac (26)
sDICmethand sCH4methfor the entire species are equivalent to ½ sTOC in Eqs. (2) and (3). The relative contribution of each pathway is
determined by the degree of autotrophy, r:
= +
+ +
r s
s s
DIC(ferm aut)
DIC(ferm aut) DIC ac (27)
2.3.3. Anaerobic methane oxidation
Kinetic fractionation during AOM is considered smaller than for methanogenesis (Alperin et al., 1988; Whiticar, 1999). Holler et al.
(2009) found fractionation factors between 0.962 and 0.988 (α' = 1.012–1.039; which corresponds to anε-value of 12–38‰) from enrichment culture experiments with consortia of anaerobic methane- oxidizing archaea and sulfate-reducing bacteria. The pure kinetic frac- tionation of the AOM reaction can be obtained from:
s =
s13 AOM R
12 AOM AOM CH4
(28) However, in experiments with radiolabelled DIC, Holler et al.
(2011)demonstrated a reverse flux through the enzymatic pathway of AOM, i.e. some of the reaction product is channelled backwards to the substrate pool, which was interpreted to cause a partial isotopic equi- libration between the coexisting CH4and DIC pools. The true kinetic fractionation factor of the reverse reaction is not known, but it was Table 2
Compilation of kinetic carbon isotope fractionation factors by autotrophic and acetoclastic methanogenesis in pure cultures of methanogenic archaea. The δ13C values for acetate are the mean of the two carbon atoms in the acetate molecule; α is the fractionation factor;ε= 1000 ln α (‰); “initial” indicates that the measurements were made at the beginning of the incubation time; “lim.” indicates substrate limitation.
δ13C-Substrate δ13C(CH4) ε α Conditions Growth phase Organism Reference
‰ VPDB ‰ VPDB ‰ VPDB
Autotrophic methanogenesis
−10.2 −56.2 −46 0.955 Methanosarcina barkeri Krzycki et al. (1987)
−19.9 −64.5 −44.6 0.956 Methanosarcina barkeri Krzycki et al. (1987)
−31.2 −71.5 −40.3 0.961 Methanosarcina barkeri Londry et al. (2008)
−31.2 −76.6 −45.4 0.956 initial Methanosarcina barkeri Londry et al. (2008)
−28.5 −79.6 −51.1 0.950 H2-lim. Methanosarcina barkeri Londry et al. (2008)
−28.5 −108 −79.5 0.924 H2-lim., initial Methanosarcina barkeri Londry et al. (2008)
−46.7 −50.6 −3.9 0.996 Glass fermentor, 35 °C Initial Methanococcus vannielii Botz et al. (1996)
−42.8 −99.3 −56.5 0.945 Glass fermentor, 35 °C End exp. phase Methanococcus vannielii Botz et al. (1996)
−45.9 −104.7 −58.8 0.943 Glass fermentor, 35 °C End stat. phase Methanococcus vannielii Botz et al. (1996)
−45.7 −92.3 −46.6 0.954 Ti fermentor, 35 °C Initial Methanococcus vannielii Botz et al. (1996)
−45 −111.7 −66.7 0.935 Ti fermentor, 35 °C End exp. phase Methanococcus vannielii Botz et al. (1996)
−45.8 −113.4 −67.6 0.935 Ti fermentor, 35 °C End stat. phase Methanococcus vannielii Botz et al. (1996)
−23.6 −39.7 −16.1 0.984 Glass fermentor, 45 °C Initial Methanococcus thermolithotrophicus Botz et al. (1996)
−11.8 −72 −60.2 0.942 Glass fermentor, 45 °C End exp. phase Methanococcus thermolithotrophicus Botz et al. (1996)
−12.3 −70.2 −57.9 0.944 Glass fermentor, 45 °C End stat. phase Methanococcus thermolithotrophicus Botz et al. (1996)
−24.4 −42.6 −18.2 0.982 Glass fermentor, 55 °C Initial Methanococcus thermolithotrophicus Botz et al. (1996)
−15.4 −71.6 −56.2 0.945 Glass fermentor, 55 °C End exp. phase Methanococcus thermolithotrophicus Botz et al. (1996)
−19.9 −80.5 −60.6 0.941 Glass fermentor, 55 °C End stat. phase Methanococcus thermolithotrophicus Botz et al. (1996)
−47.7 −106.2 −58.5 0.943 Ti fermentor, 55 °C Initial Methanococcus thermolithotrophicus Botz et al. (1996)
−46.8 −106.8 −60 0.942 Ti fermentor, 55 °C End exp. phase Methanococcus thermolithotrophicus Botz et al. (1996)
−47.5 −106 −58.5 0.943 Ti fermentor, 55 °C End stat. phase Methanococcus thermolithotrophicus Botz et al. (1996)
−23.8 −79.7 −55.9 0.946 Glass fermentor, 65 °C End exp. phase Methanococcus thermolithotrophicus Botz et al. (1996)
−45.4 −98.5 −53.1 0.948 Glass fermentor, 65 °C End stat. phase Methanococcus thermolithotrophicus Botz et al. (1996)
−41.9 −96.2 −54.3 0.947 Glass fermentor, 85 °C Initial Methanococcus igneus Botz et al. (1996)
−38.1 −89.2 −51.1 0.950 Glass fermentor, 85 °C End exp. phase Methanococcus igneus Botz et al. (1996)
−39.2 −83 −43.8 0.957 Glass fermentor, 85 °C End stat. phase Methanococcus igneus Botz et al. (1996)
−43.1 −101.7 −58.6 0.943 Ti fermentor, 85 °C Initial Methanococcus igneus Botz et al. (1996)
−43.6 −100.2 −56.6 0.945 Ti fermentor, 85 °C End exp. phase Methanococcus igneus Botz et al. (1996)
−44.3 −97.2 −52.9 0.948 Ti fermentor, 85 °C End stat. phase Methanococcus igneus Botz et al. (1996)
Acetoclastic methanogenesis
−22.2 −43.6 −21.4 0.979 Methanosarcina barkeri Krzycki et al. (1987)
−22.2 −43.3 −21.1 0.979 Methanosarcina barkeri Krzycki et al. (1987)
−20.42 to −35.76 −51.8 to −57.02 −21.3 0.979 Methanosarcina barkeri Gelwicks et al. (1994)
−20.2 to −21.4 −40.2 to −40.8 −19.2 0.981 Lake water Gelwicks et al. (1994)
−30.9 −53.8 −22.9 0.977 Methanosarcina barkeri Londry et al. (2008)
−30.9 −65.7 −34.8 0.966 initial Methanosarcina barkeri Londry et al. (2008)
−30.9 −25.7 5.2 1.005 substr.-lim. Methanosarcina barkeri Londry et al. (2008)
AOM 0.988 to 0.961 1) Holler et al. (2009)
1) The back fluxes reached between 5% and 13% of the net AOM rate (Holler et al., 2011).
suggested byYoshinaga et al. (2014) that the difference in δ13C be- tween CH4 and DIC approaches the isotope exchange equilibrium fractionation factor as the change in free energy by the reaction ap- proaches chemical equilibrium. The theoretical equilibrium fractiona- tion factor, αeq, at reaction temperature was calculated byRichet et al.
(1977)andHorita (2001).
To calculate the reverse flux we assume a forward reaction with rate f+ and a backward reaction with rate f−, where rAOM= f−/ f+. In culture experiments, the back reaction reached 5% of the net AOM rate under fully marine sulphate concentration (Holler et al., 2011), but up to 78% under sulphate limitation in incubation experiments with se- diment from Amon Mud Volcano (Nile Deep-Sea Fan;Yoshinaga et al., 2014). We used an empirical function fitted to the experimental data in those two studies to determine the dependence of rAOM on the SO42−concentration:
= +
r r b
b [SO ]
AOM AOMmax
42 (29)
where rAOMmax(%) is the maximal reverse flux and b is a fitting para- meter. If sAOMis the net AOM rate (sAOM= f+− f−), we can find the rates of production of DIC and CH4as follows:
= +=
sDIC f 1/(1 rAOM)·sAOM (30)
= =
sCH4 f rAOM/(1 rAOM)·sAOM (31)
To calculate the equilibrium isotope fractionation it is important to note that an isotopic equilibrium can only be reached if a chemical equilibrium of reactant and product is reached in the entire pool (Urey and Greiff, 1935), i.e. in the pool of CH4and DIC in the porewater.
However, isotopic equilibration may occur within the enzymatic pathway, which can be modelled by assuming a hypothetical com- partment within the pathway (Fig. 1), in which equilibrium can be reached. Thereby, both the concentrations of species and overall con- centrations of each isotope are conserved:
+ +
CH DIC CH DIC
13 4 12 12
4 13 (32)
Although the forward and backward reaction rates sDICand sCH4are different, two assumptions can be made based on the equilibrium re- action (Eq.32): (1) The total rate of DIC production before equilibra- tion, sDIC, and after equilibration, s′DIC, remains the same (this is also true for CH4):
+ = +
s s s s
13 DIC 12 DIC 13
DIC 12
DIC (33)
(2) The turnover rate of the sum of each isotope is not changed by the equilibration (here shown for13C):
+ = +
s s s s
13 DIC 13 CH4 13
DIC 13
CH4 (34)
If we defineηas the rate of transfer of each isotope from one iso- topologue to another during equilibration it follows, from the con- servation of the molecules, CH4and DIC (Eq.(33)), and the conserva- tion of isotopes,13C and12C (Eq.(34)), that the change in concentration per time is the same value,η, for all four isotopologues:
= +
s s
13 DIC 13
DIC (35)
=
s s
12 DIC 12
DIC (36)
=
s s
13 CH4 13
CH4 (37)
= +
s s
12 CH4 12
CH4 (38)
The value ofηis determined by the thermodynamic equilibrium frac- tionation factor αeq, which can be expressed as the ratio of production rates of each isotopologue after equilibration:
= =
+ +
s / s s / s
( s )( s )
( s )( s )
eq
13 CH4 12 CH4 13 DIC 12
DIC
13 CH4 12
DIC
12 CH4 13
DIC (39)
The value ofη, thus, depends on αeqas well as on the initial isotopic compositions of the CH4and DIC fluxes into the pathway. Eq.(39)is a quadratic equation that can be solved forη(Suppl. A). The new pro- duction and consumption rates of each isotopologue are found by substitutingηin Eqs.35–38.
2.4. Initial conditions and boundary conditions
The input parameters TOC0, aRC, ν, and ω were systematically varied within a range representative for marine sediments. For each set of parameters the model was run until a steady state was reached.
Initial conditions were 0 mM sulphate, methane and DIC at all depths.
The boundary conditions were set to 28 mM sulphate and 2 mM DIC at the sediment/water interface. Both12CH4and13CH4were set to a zero gradient at the upper boundary to prevent large artefacts at low CH4
concentration. The δ13C of DIC in seawater was fixed at 0‰. The lower boundary conditions were defined as zero gradient for sulphate, me- thane, and DIC. It is important to notice that the domain size has a significant influence on the redox zones since more methane is pro- duced in a thicker sequence of sediment. In nature, the domain size is given by the thickness of the sedimentary sequence. In the model, only the organic matter decaying within the domain contributes to meta- bolism, whereas the organic matter buried below the lower domain boundary is excluded from the model reactions. Because the rate of organic matter decay decreases with time and depth according to the
CH 4
DIC Isotope equilibration
13
s
CH412
s
CH413
s
DIC12
s
DICf
+= s
DICf
-= s
CH4CH 4
DIC
13 DIC 12 DIC 13 CH4
12 CH4
f
+= s
DICf
-= s
CH413
CH
4+
12DIC
12CH
4+
13DIC
Fig. 1.Schematic drawing of the concept of equilibrium fractionation during reverse reaction of AOM. The frame represents a hypothetical compartment in which isotope exchange takes place. Please note that despite different forward and reverse fluxes, mass balance is maintained through Eqs.(33) and (34).
reactive continuum model, which is similar to a power law function, the decay below the lower domain boundary is negligible if a sufficiently large domain is considered (cf.Meister et al., 2013). To make sure this holds true for the modelled carbon isotope profiles we also tested the sensitivity of sulphate and methane profiles to changes in the domain size.
2.5. Numerical solution
The sulphate, methane and DIC profiles determined by Eqs. 1–3 were simulated using the Lattice-Boltzmann method (LBM; Wolf- Gladrow, 2000;Sukop and Thorne Jr., 2007). In the LBM, the evolution of concentration C is modelled by a single relaxation time scheme (Bhatnagar-Gross-Krook scheme; BGK;Bhatnagar et al., 1954):
+ + = +
f (z e t, t t) f (z, t) 1
t (f (z, t) f (z, t)) s
i i i
R i ieq
i (40)
where fi(z, t) is the single-particle distribution function with velocity ei
at position z and time t, and ∆t is the time increment. In the 1-di- mensional lattice with 3 velocities (D1Q3), the velocities are given by the three non-dimensional vectors: e0= 0, e1= 1, and e2= −1. The function fieq(z, t) is the equilibrium distribution function:
=
f (z, t)ieq w C(1i 3e )i (41)
The weight parameter wi (i.e. the proportion in which the con- centration C is transported along the vectors e0, e1, and e2) is given by w0= 2/3, w1= w2= 1/6. A source or sink is expressed as si= wis, where s is the source/sink term defined in Eqs.(1)–(3). Furthermore, tR
is the non-dimensional relaxation time. It can be shown that the ad- vection/diffusion reaction equation can be derived from the Lattice- Boltzmann equation (Eq.(40)) through a Chapman-Enskog expansion procedure (Wolf-Gladrow, 2000). The quantity tRcan then be adjusted to tune the transport coefficients through relation tR= 3D + 1/2 with the diffusion coefficient D. The macroscopic concentration (i.e. the concentration measureable in a volume of porewater) is obtained by C = f0+ f1+ f2.
2.6. Model parameterization
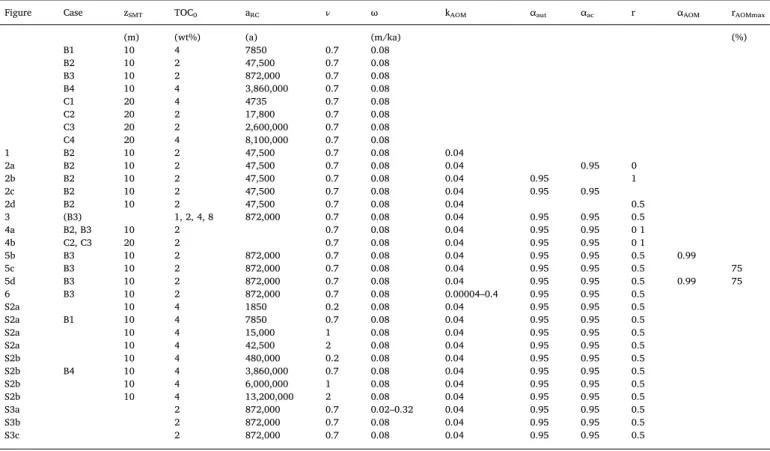
Parameter values or ranges of values used in our model are listed in Table 1. Concentration profiles of sulphate and methane computed over a large range of different organic carbon input, organic carbon de- gradation rates, and sedimentation rates are described and discussed in Meister et al. (2013). For a better overview, we list all variables used to calculate the δ13C profiles of DIC and CH4 shown in the figures in Table 3. These cases are representative for a large range of marine se- dimentary porewater profiles, i.e. differently condensed or expanded redox zonations and different reactivities of organic matter as discussed in detail inMeister et al. (2013). We discuss general features in com- parison with a few selected measured profiles.
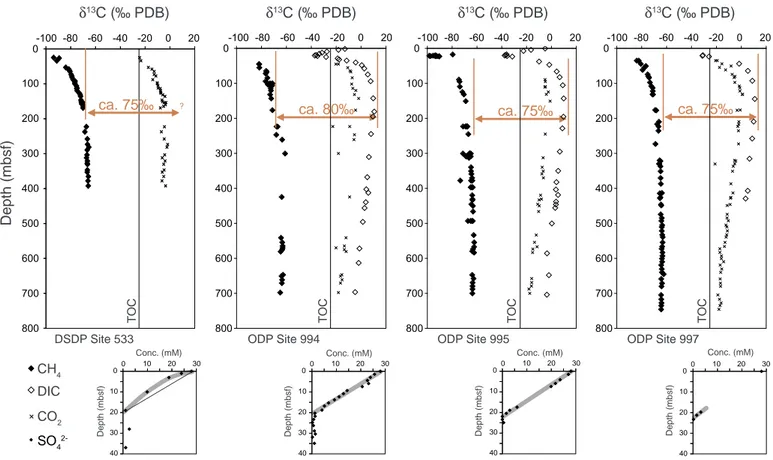
For comparison with the model results, we compiled datasets of δ13CCH4and δ13CDICof several sites from the literature: Blake Ridge (DSDP Site 533; 3191 m water depth;Galimov and Kvenvolden, 1982;
and ODP Sites 994, 995, and 997; 2798, 2779, and 2770 m water depth;
Paull et al., 2000), Cascadia Margin (IODP Site U1329; 946 m water depth;Heuer et al., 2009), Bullseye vent (Cascadia Margin, Site C-2;
1311 m water depth;Pohlman et al., 2008), and the Peru Trench (ODP Site 1230; 5086 m water depth;Meister et al., 2011).
3. Model results
Typical sulphate, methane, and DIC concentration profiles are dis- played for case B2(Table 3) inFig. 2, showing a decreasing sulphate concentration and increase of methane below the SMT at 10 mbsf. DIC concentration increases with depth with a kink at the SMT. The same
case was used to test the sensitivity of the δ13C-profiles towards dif- ferent fractionation factors (Fig. 3). The simulated δ13CCH4 profiles show values more negative than −70‰ at a fractionation factor αac= 0.95 for acetoclastic methanogenesis (Fig. 3a). The values are constant with depth, and the profiles show a regular spacing with in- cremental changes of αac. Values are less negative for autotrophic methanogenesis if the same values are used for the fractionation factor (ca. -60‰ for αaut= 0.95;Fig. 3b), and the profiles show a curvature towards more negative values at the SMT. Isotope values in DIC de- crease with depth in the sulphate zone and show invariably the value of bulk TOC at the SMT. Below the SMT, δ13CDICincreases asymptotically to a more positive value in the methanogenic zone. The values are more positive for acetoclastic methanogenesis than for autotrophic metha- nogenesis. The effect of the degree of autotrophy is also shown in Fig. 3c, wherebyFig. 3d demonstrates that atr= 0.5 the fractionation factors of the two pathways are exchangeable.
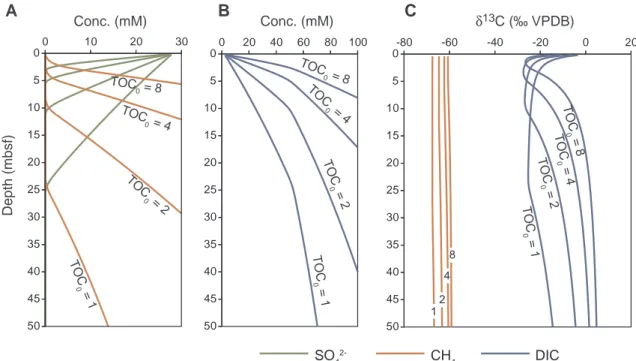
At constant fractionation factors the effect of the amount and re- activity of organic matter in the sediment is tested, using αac= αaut= 0.95 and r = 0.5 for case B3(Table 3).Fig. 4shows how δ13CDICvalues increase with increasing TOC0, while the SMT is shal- lowing. Also δ13CCH4 values slightly increase with increasing TOC0. However, the δ13CDICremains near δ13CTOCat the SMT under all con- ditions.
A significant change in both δ13CCH4and δ13CDICis observed with changing aRC, the initial age of organic matter in the reactive con- tinuum model.Fig. 5displays the effect of changing aRC at constant SMT depth. As shown inMeister et al. (2013), two values for aRCcan be found, for which the SMT is at the same depth.Fig. 5a and b show their effect for a SMT at 10 mbsf and 20 mbsf, respectively. As the two dif- ferent aRCvalues differ more in the latter case (Fig. 5b), also the dif- ference in the isotopic compositions are larger for different aRC. Gen- erally, the more refractory organic matter (larger aRC) results in a more symmetrical distribution of δ13CCH4and δ13CDICwith respect to δ13CTOC. A similar effect occurs if the parameterνin the reactive continuum model is varied (Fig. S1, Suppl. B). This value describes the distribution of reactivity in the reactive continuum. The isotope profiles are most sensitive to this parameter if aRCis small, resulting in much more ne- gative δ13CCH4 and δ13CDIC values at smallν. Also in this case, the δ13CDICremains near to δ13CTOCat the SMT.
Sedimentation rate and porosity have a different effect on the iso- tope profiles than the initial TOC content (Fig. S2; Suppl. C). At high sedimentation rate and low porosity, respectively, the δ13CDICvalues are more positive in the methanogenic zone, but distinctly more ne- gative than δ13CTOC at the SMT. These negative values are reached without the effect of fractionation due to AOM or reverse AOM flux (see below). δ13CCH4values are less negative at higher sedimentation rate and lower porosity. Isotope profiles at decreasing porosity with depth are not fundamentally different from profiles at a constant porosity. A rapid decrease of porosity also leads to a very shallow SMT.
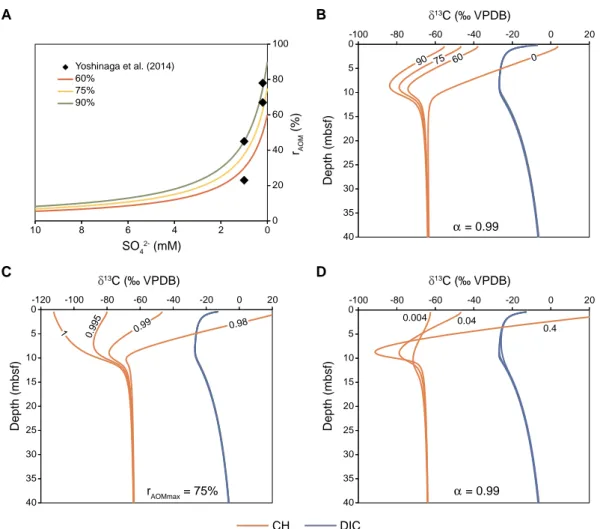
So far, no fractionation during AOM is taken into account.Fig. 6 shows the results of different AOM kinetic fractionation factors of the net forward reaction in combination with equilibrium fractionation as a result of the reverse flux. In order to determine the dependence of the reverse flux on the SO42−concentration, an empirical function (Eq.
(29)) is fitted to the SO42−-dependent rate function (Fig. 6a). Three different values for rAOMmax (60%, 75%, and 90%) are used for the isotope model as shown inFig. 6b. The δ13CCH4 profiles show a pro- nounced minimum at the SMT and an upward increase in the sulphate- reduction zone. The minimum is not present if zero reverse flux is considered. Varying the fractionation factor αAOMhas a strong effect on the δ13CCH4profile in the sulphate reduction zone, with a steep increase at αAOM= 0.98 and a strong decrease if no kinetic fractionation is taken into account (αAOM= 1; Fig. 6c). Increasing the rate of AOM (kAOM) results in both more negative δ13CCH4values at the SMT and more po- sitive values in the sulphate reduction zone (Fig. 6d). None of the
fractionation effects of AOM affect the δ13CCH4profiles below the SMT, and no changes occur throughout the entire δ13CDICprofiles.
A further effect tested is the diffusive escape of CH4at the sediment- water interface. This was achieved assuming case B3but with a TOC0of
8 wt%, such that the SMT is at a very shallow depth (Fig. 7). Changing kAOMfrom 4 · 10−1to 4 · 10−5a−1results in a lower AOM rate, such that AOM is no more capable of retaining all CH4within the sediment.
The resulting profiles show an increase in δ13CDICin the sulphate re- duction zone, while no significant effect occurs in the δ13CCH4profile.
No effect is noticed in the isotope profiles at greater depth in the me- thanogenic zone.
4. Discussion
4.1. Carbon isotope profiles and their sensitivity to fractionation factors Each fractionation factor, αaut and αacwas systematically varied between 0.95 and 1, which comprises the span of fractionation factors provided for pure cultures of methanogenic archaea in the literature (Table 2). The relative contribution of each pathway is expressed by the degree of autotrophy, r = autotrophic/total methanogenesis, which was varied between 0 and 1. According to several studies, autotrophic methanogenesis is the dominant pathway in marine sediments (e.g.
Beulig et al., 2018).Heuer et al. (2009)found that r may vary with depth, but results must in all cases lie between the end-members modelled here.
In the case of pure acetoclastic methanogenesis (Fig. 3a), CH4shows a constant δ13C with depth, whereby the offset from δ13CTOC(set to
−25‰) depends linearly on αac. Normalized production rates for each isotope relative to TOC degradation rates are also constant with depth and depend linearly on the fractionation factor (not shown). Thus, also the δ13C of the entire CH4or DIC pool at steady state depend linearly on αac. In the case of αac= 1, no fractionation occurs and δ13C of both DIC and CH4are identical to δ13CTOC, except near the sediment/water in- terface where δ13CDICshows a mixing gradient with DIC from seawater (with δ13CDIC= 0‰). In cases of αac< 1, δ13CDICremains unchanged (i.e. near to δ13CTOC) in the sulphate reduction zone (due to production Table 3
List of all variables tested in the modelled cases. The cases are shown inFigs. 1 through 6and Figs. S1 and S2.
Figure Case zSMT TOC0 aRC ν ω kAOM αaut αac r αAOM rAOMmax
(m) (wt%) (a) (m/ka) (%)
B1 10 4 7850 0.7 0.08
B2 10 2 47,500 0.7 0.08
B3 10 2 872,000 0.7 0.08
B4 10 4 3,860,000 0.7 0.08
C1 20 4 4735 0.7 0.08
C2 20 2 17,800 0.7 0.08
C3 20 2 2,600,000 0.7 0.08
C4 20 4 8,100,000 0.7 0.08
1 B2 10 2 47,500 0.7 0.08 0.04
2a B2 10 2 47,500 0.7 0.08 0.04 0.95 0
2b B2 10 2 47,500 0.7 0.08 0.04 0.95 1
2c B2 10 2 47,500 0.7 0.08 0.04 0.95 0.95
2d B2 10 2 47,500 0.7 0.08 0.04 0.5
3 (B3) 1, 2, 4, 8 872,000 0.7 0.08 0.04 0.95 0.95 0.5
4a B2, B3 10 2 0.7 0.08 0.04 0.95 0.95 0 1
4b C2, C3 20 2 0.7 0.08 0.04 0.95 0.95 0 1
5b B3 10 2 872,000 0.7 0.08 0.04 0.95 0.95 0.5 0.99
5c B3 10 2 872,000 0.7 0.08 0.04 0.95 0.95 0.5 75
5d B3 10 2 872,000 0.7 0.08 0.04 0.95 0.95 0.5 0.99 75
6 B3 10 2 872,000 0.7 0.08 0.00004–0.4 0.95 0.95 0.5
S2a 10 4 1850 0.2 0.08 0.04 0.95 0.95 0.5
S2a B1 10 4 7850 0.7 0.08 0.04 0.95 0.95 0.5
S2a 10 4 15,000 1 0.08 0.04 0.95 0.95 0.5
S2a 10 4 42,500 2 0.08 0.04 0.95 0.95 0.5
S2b 10 4 480,000 0.2 0.08 0.04 0.95 0.95 0.5
S2b B4 10 4 3,860,000 0.7 0.08 0.04 0.95 0.95 0.5
S2b 10 4 6,000,000 1 0.08 0.04 0.95 0.95 0.5
S2b 10 4 13,200,000 2 0.08 0.04 0.95 0.95 0.5
S3a 2 872,000 0.7 0.02–0.32 0.04 0.95 0.95 0.5
S3b 2 872,000 0.7 0.08 0.04 0.95 0.95 0.5
S3c 2 872,000 0.7 0.08 0.04 0.95 0.95 0.5
0 20 40 60 80 100 120
0 20 40 60 80 100 120 140 160 180 200
Conc. (mM)
De pth (mbsf)
CH
4DIC SO
42-Fig. 2.Modelled sulphate, methane, and DIC concentration profiles using the parameters for the exemplary case B2listed inTable 3. Sulphate is depleted at 10 mbsf. An abrupt change in the slope of the DIC profile at the SMT at 10 mbsf is due to production of DIC by AOM. Below the SMT, CH4and DIC increase almost in parallel.