IHS Economics Series Working Paper 257
September 2010
Optimal Asset Allocation Under Linear Loss Aversion
Ines Fortin
Jaroslava Hlouskova
Impressum Author(s):
Ines Fortin, Jaroslava Hlouskova Title:
Optimal Asset Allocation Under Linear Loss Aversion ISSN: Unspecified
2010 Institut für Höhere Studien - Institute for Advanced Studies (IHS) Josefstädter Straße 39, A-1080 Wien
E-Mail: o ce@ihs.ac.atffi Web: ww w .ihs.ac. a t
All IHS Working Papers are available online: http://irihs. ihs. ac.at/view/ihs_series/
This paper is available for download without charge at:
https://irihs.ihs.ac.at/id/eprint/2020/
Optimal Asset Allocation Under Linear Loss Aversion
Ines Fortin, Jaroslava Hlouskova
257
Reihe Ökonomie
Economics Series
257 Reihe Ökonomie Economics Series
Optimal Asset Allocation Under Linear Loss Aversion
Ines Fortin, Jaroslava Hlouskova September 2010
Institut für Höhere Studien (IHS), Wien
Contact:
Ines Fortin
Department of Economics and Finance Institute for Advanced Studies Stumpergasse 56
1060 Vienna, Austria
: +43/1/599 91-165 email: ines.fortin@ihs.ac.at Jaroslava Hlouskova
Department of Economics and Finance Institute for Advanced Studies Stumpergasse 56
1060 Vienna, Austria
: +43/1/599 91-142 email: hlouskov@ihs.ac.at and
Thompson Rivers University School of Business and Economics British Columbia, Canada
Founded in 1963 by two prominent Austrians living in exile – the sociologist Paul F. Lazarsfeld and the economist Oskar Morgenstern – with the financial support from the Ford Foundation, the Austrian Federal Ministry of Education and the City of Vienna, the Institute for Advanced Studies (IHS) is the first institution for postgraduate education and research in economics and the social sciences in Austria. The Economics Series presents research done at the Department of Economics and Finance and aims to share “work in progress” in a timely way before formal publication. As usual, authors bear full responsibility for the content of their contributions.
Das Institut für Höhere Studien (IHS) wurde im Jahr 1963 von zwei prominenten Exilösterreichern – dem Soziologen Paul F. Lazarsfeld und dem Ökonomen Oskar Morgenstern – mit Hilfe der Ford- Stiftung, des Österreichischen Bundesministeriums für Unterricht und der Stadt Wien gegründet und ist somit die erste nachuniversitäre Lehr- und Forschungsstätte für die Sozial- und Wirtschafts- wissenschaften in Österreich. Die Reihe Ökonomie bietet Einblick in die Forschungsarbeit der Abteilung für Ökonomie und Finanzwirtschaft und verfolgt das Ziel, abteilungsinterne Diskussionsbeiträge einer breiteren fachinternen Öffentlichkeit zugänglich zu machen. Die inhaltliche Verantwortung für die veröffentlichten Beiträge liegt bei den Autoren und Autorinnen.
Abstract
Growing experimental evidence suggests that loss aversion plays an important role in asset allocation decisions. We study the asset allocation of a linear loss-averse (LA) investor and compare the optimal LA portfolio to the more traditional optimal mean-variance (MV) and conditional value-at-risk (CVaR) portfolios. First we derive conditions under which the LA problem is equivalent to the MV and CVaR problems. Then we analytically solve the two- asset problem, where one asset is risk-free, assuming binomial or normal asset returns. In addition we run simulation experiments to study LA investment under more realistic assumptions. In particular, we investigate the impact of different dependence structures, which can be of symmetric (Gaussian copula) or asymmetric (Clayton copula) type. Finally, using 13 EU and US assets, we implement the trading strategy of an LA investor assuming assets are reallocated on a monthly basis and find that LA portfolios clearly outperform MV and CVaR portfolios.
Keywords
Loss aversion, portfolio optimization, MV and CVaR portfolios, copula, investment strategy
JEL Classification
G11, G15, G24
Comments
Contents
1 Introduction 1
2 Portfolio optimization under linear loss aversion 3
2.1 Linear loss-averse utility versus mean-variance and conditional value-at-risk ... 5 2.2 Analytical solution for one risk-free and one risky asset ... 8 2.3 Numerical solution ... 15
3 Simulation study assuming different structures and
degrees of dependence 15 4 Empirical application 21
5 Conclusion 29
Appendix A 31
Appendix B 35
References 39
1 Introduction
Risk management and behavioral finance are core activities in the asset allocation conducted by banks, insurance and investment companies, or any financial institution that is concerned about risk and about the impact of psychology on individual choice behavior. Financial decision making under uncertainty has long been characterized by modeling investors to be risk averse. Risk aversion means that if several investment opportunities have the same expected return the one with the smallest variation in returns is preferred. In classical finance, investors characterized by risk aversion usually maximize a concave utility function of total wealth. For a certain class of such utility functions a number of results have been known long since, see, for example, Merton (1990) and Ingersoll (1987). However, this is not yet the case in the field of behavioral finance, where a theory of portfolio selection that takes investors’ psychology into account is still being developed.
Although the idea of risk aversion is appealing and captures an important aspect of investment behavior, the choice of particular utility functions is probably more motivated from a rational-choice economics and tractability point of view than from realistic investors’ preferences. Experiments in behavioral economics have shown that consumers’ preferences cannot always be consistently explained using the traditional finance framework, see Kahneman and Tversky (1979). In particular, real investors seem to be characterized by aloss-averse behavior, which is a phenomenon describing asymmetric attitudes with respect to gains and losses, rather than by a purely risk averse behavior.
Their aversion to losses seems to be considerably stronger than their liking of gains.
Lately, the issue of loss aversion has been receiving more and more interest. Odean (1998) finds empirical evidence of a behavior consistent with prospect theory known as the disposition effect (see also Shefrin and Statman, 1985), when investors tend to hold losing investments too long and sell winning investments too soon. De Bondt and Thaler (1985) investigate whether overreaction to unexpected and dramatic events matters at the market level and find positive evidence in the sense that prior losers are found to outperform prior winners. Benartzi and Thaler (1995), who examine the single-period portfolio choice for an investor with prospect-type utility, offer an explanation of the equity premium puzzle based on myopic loss aversion (interaction between loss aversion and frequent portfolio evaluation). This supports the idea that if investors review their portfolios annually, the resulting empirical premium is consistent with the loss aversion values estimated in the standard prospect theory framework.1 Related to the work of Benartzi and Thaler (1995) is
1The termnarrow framingis sometimes used to describe the underlying phenomenon.
also that of Barberis, Huang and Santos (2001) who consider loss aversion in a multiperiod context, where investors update the reference point through time and argue that these updating rules might explain the equity premium puzzle. The finding of Benartzi and Thaler is challenged by Durand, Lloyd and Tee (2004) who claim based on their empirical findings that the analysis of Benartzi and Thaler is not robust. On the other hand, Zeisberger, Langer and Trede (2007) implement a bootstrap approach and find results in line with the original results of Benartzi and Thaler.
Gomes (2005) studies the optimal portfolio allocation of loss-averse investors and its implications for trading volume. An axiomatic characterization of the behavior depending on a reference point is provided in Apesteguia and Ballester (2009), who also give applications on modeling the status- quo bias and the addictive behavior. Recently, McGraw, Larsen, Kahneman and Schkade (2010) have pointed out the importance of the context of judgement for the presence of loss aversion. An extensive behavioral economic survey can be found in DellaVigna (2009).
While one strand of research, as indicated above, has recently been working with utility functions that are motivated by behavioral experiments and imply asymmetric or downside risk, another strand of research, mainly in the area of applied finance, has been occupied with the discussion and introduction of new downside risk measures, without (necessarily) building on utility maximizing agents.2 The use of downside risk measures has been particularly promoted by banking supervisory regulations, which specify the risk of proprietary trading books and its use in setting risk capital requirements. The measure of risk used in this framework is value-at-risk (VaR), which explicitly targets downside risk, see the Basel Committee on Banking Supervision (2003, 2006). VaR has been developing into one of the industry standards for assessing the risk of financial losses in risk management and asset/liability management. Another risk measure, which is closely related to VaR but offers additional desirable properties like information on extreme events, coherence and computational ease, is conditional value-at-risk (CVaR). Computational optimization of CVaR has been made readily accessible through the results in Rockafellar and Uryasev (2000).
We contribute to the existing literature outlined above along different lines. First, we investi- gate how the maximization of (a certain form of) loss-averse utility relates to the optimization of CVaR. In doing so, we create a link between the two above-mentioned strands of literature, i.e., be- tween maximizing loss-averse utility whose specific form is motivated by experiments, and between optimizing purely descriptive downside risk measures. More specifically, we extend the results of
2An overview of downside risk measures with an application to hedge funds can be found in Krokhmal, Uryasev and Zrazhevsky (2002).
Rockafellar and Uryasev (2000) by comparing CVaR as well as mean-variance optimization to the maximization of loss-averse utility. Second, we analytically solve the portfolio selection problem of a loss-averse investor in a way similar to Gomes (2005), where our set-up of the loss aversion problem differs from his. Third, we provide additional insight into the asset allocation decision by running simulation experiments for the case when analytical solutions cannot be obtained. In doing so, we explicitly account for asymmetric dependence by using (appropriate) copulas which have been found useful to model dependence beyond linear correlation. Fourth, we contribute to the empirical research involving loss-averse investors by investigating the portfolio performance under the optimal investment strategy, where the portfolio is re-allocated on a monthly basis us- ing 13 European and U.S. assets. In addition to using fixed loss aversion parameters, we employ time-changing versions which depend on previous gains and losses and which have been suggested to better reflect the behavior of real investors. As opposed to a number of other authors, we do not consider a general equilibrium model but examine the portfolio selection problem from an investor’s point of view.
The remaining paper is organized as follows. In Section 2 we first derive conditions under which the linear loss-averse utility maximization (LA) problem is equivalent to the traditional mean- variance (MV) and conditional value-at-risk (CVaR) problems, under the assumption of normally distributed asset returns. Then we look at the two-asset case, where one asset is risk-free, and derive the optimal weight of the risky asset as well as the (slightly modified form of the) Sharpe ratio under the assumption of binomially and normally distributed returns. Section 3 reports simulation results for the two-asset case on the sensitivity of the (modified) Sharpe ratio and the asset allocation of the optimal LA portfolio with respect to the the loss aversion parameter and the reference point, and with respect to the degree and structure of dependence. We implement the trading strategy of a linear loss-averse investor, who re-allocates this portfolio on a monthly basis, and study the performance of the resulting optimal portfolio in Section 4. We also compare the optimal LA portfolio to the more traditional optimal MV and CVaR portfolios. Section 5 concludes.
2 Portfolio optimization under linear loss aversion
Loss aversion, which is a central finding of Kahneman and Tversky’s (1979) prospect theory, de- scribes the fact that people are more sensitive to losses than to gains, relative to a given reference
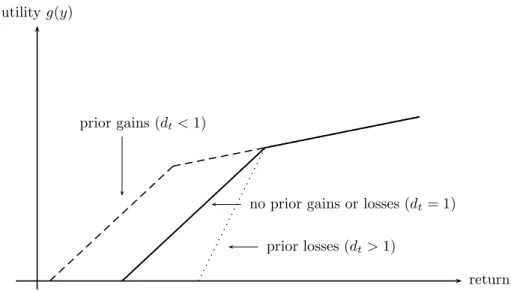
point. More specifically (i) returns are measured relative to a given reference value and (ii) the decrease in utility implied by a marginal loss (relative to the reference point) is always greater than the increase in utility implied by a marginal gain (relative to the reference point).3 We consider a linear form of loss-averse utility, which is a special case of the originally introduced loss-averse utility. Another feature of the original (S-shaped) loss aversion is an explicit risk seeking behavior in the domain of losses, something which is not captured by our linear loss-averse utility. Under linear loss aversion investors are characterized by the following utility of (portfolio/asset) returny
g(y) =
y, y >yˆ (1 +λ)y−λˆy, y≤yˆ
=y−λ[ˆy−y]+
where λ≥0 is the loss-averse, or penalty, parameter, ˆy ∈R is the given reference point, and [t]+ denotes the maximum of 0 and t, see Figure 1. Under the given utility, investors face a trade- off between return on the one hand and shortfall below the reference point on the other hand.
Interpreted differently, the utility function contains an asymmetric or downside risk measure, where losses are weighted differently from gains.
ˆ y
returny utilityg(y)
slope = 1 +λ
slope = 1
Figure 1: Linear loss-averse utility function
We start by studying the optimal asset allocation behavior of a linear loss-averse investor. This
3This is also referred to as the first-order risk aversion (see Epstein and Zin, 1990).
behavior depends crucially on the reference return ˆy and, in particular, on whether this reference return is below, equal to, or above the risk-free interest rate or the (requested lower bound on the) expected portfolio return. Investors maximize their expected utility of returns as
max n
E r′x−λ[ˆy−r′x]+
Ax≤bo
(2.1) where x = (x1, . . . , xn)′, with xi ∈ R denoting the proportion of wealth invested in asset i,4 i = 1, . . . , n, and r is the n−dimensional random vector of returns, subject to the usual asset constraints Ax≤b, where A∈ Rm×n, b∈ Rm. Note that in general the proportion invested in a given asset may be negative or larger than one due to short-selling.
2.1 Linear loss-averse utility versus mean-variance and conditional value-at-risk In this section we show the relationship between the linear loss-averse utility maximization problem (2.1) and both the MV and the CVaR problem, under the assumption of normally distributed asset returns. The MV problem seeks to minimize the variance of an asset portfolio, the CVaR problem optimizes the asset portfolio with respect to its conditional value-at-risk. Both problems may include restrictions on the expected portfolio return and/or the assets’ weights.5
Let Z be a (continuous) random variable describing the stochastic portfolio return and fZ(·) and FZ(·) be its probability density and cumulative distribution functions. Then we define the expected linear loss-averse utility of returnZ, given the penalty parameter λ≥0 and the reference point ˆy∈R, as6
LAλ,ˆy(Z) = E(Z−λ[ˆy−Z]+)
= E(Z)−λ(ˆy−E(Z|Z ≤y))Pˆ (Z ≤y)ˆ
= E(Z)−λFz(ˆy) ˆy−CVaRFz(ˆy)(Z)
(2.2)
= E(Z)−λ Z yˆ
−∞
(ˆy−z)fZ(z)dz (2.3)
< E(Z)
4Throughout this paper, prime (′) is used to denote matrix transposition and any unprimed vector is a column vector.
5For details on the MV and CVaR optimizations, see Markowitz (1952) and Rockafellar and Uryasev (2000).
6Note that LAλ,ˆy already accounts for the expectation of utility.
where the conditional value-at-risk CVaRFz(ˆy)(Z) is the conditional expectation ofZ below ˆy; i.e.
CVaRFz(ˆy)(Z) = E(Z|Z ≤ y).ˆ As Ryˆ
−∞(ˆy−z)fZ(z)dz ≥ 0, the loss-averse utility of the random variable Z is its mean reduced by some positive quantity, where the size of the reduction depends positively on the values of the penalty parameterλand the reference point ˆy. The expected linear loss-averse utility LAλ,ˆy(·) is thus a decreasing function in both the penalty parameter and the reference point. Using the fact that Z is normally distributed withZ ∼N(µ, σ2) we have
LAλ,ˆy(Z) =µ−λσ
yˆ−µ
σ F
yˆ−µ σ
+f
yˆ−µ σ
(2.4) where f(·) and F(·) are the probability density and the cumulative probability functions of the standard normal distribution. Since y−µˆσ F
y−µˆ σ
+f
y−µˆ σ
is an increasing function of y−µˆσ , the linear loss-averse utility depends negatively on yˆ−σµ.7 Figure 2 presents different positionings of the expected linear loss-averse utility of a given asset return, provided it is normally distributed, with respect to the reference point ˆy and the CVaRβ, under the assumption that λ = 1/β and β =Fz(ˆy). The return’s loss-averse utility is larger than its conditional value-at-risk when µ >y,ˆ it is smaller whenµ <y, and it is equal whenˆ µ= ˆy.
If asset returns are normally distributed, i.e.,r ∼N(µ,Σ), whereµ, r∈Rnand Σ∈Rn×n, then the portfolio return is also normally distributed, i.e.,r′x∼N(µ′x, x′Σx), wherex ∈Rn, and using our formulation of linear loss aversion given normal returns, see (2.4), we introduce the following linear loss-averse utility maximization problem
max
LAλ,ˆy(r′x) =µ′x−λ√ x′Σx
yˆ−µ′x
√x′ΣxF
yˆ−µ′x
√x′Σx
+f
yˆ−µ′x
√x′Σx
Ax≤b, µ′x= ¯R
(2.5) Under the same assumptions, the MV problem can be stated as
minn
var(r′x) =x′Σx
Ax≤b, µ′x= ¯R o
(2.6) and the CVaR optimization problem can be written as
max
CVaRF(√yˆ−µ′x
x′Σx)(r′x) =µ′x−√
x′Σxf(√yˆ−µ′x x′Σx) F(√ˆy−µ′x
x′Σx)
Ax≤b, µ′x= ¯R
(2.7)
7Thus, the positioning of the mean with respect to the reference point is important. Based on this observation we will later introduce a performance measure labeled therelative Sharpe ratio µ−ˆσy.
LA1/β,ˆy
CVaRβ ˆy µ
β
ˆ y−CVaRβ
ˆ
CVaRβ yLA1/β,ˆy µ β ˆy−CVaRβ
LA1/β,ˆy= CVaRβ µ= ˆy β
LA1/β,ˆyCVaRβ µ ˆy β
ˆ y−CVaRβ
Figure 2: Linear loss-averse utility and conditional value-at-risk
The expected linear loss-averse utility LA1/β,ˆy(Z) and the conditional value-at-risk CVaRβ(Z) of the stochastic returnZ, withβ =FZ(ˆy) andλ= 1/β, are shown for ˆy < µ, andµ−yˆ≤yˆ−CVaRβ(Z) (top left), ˆy < µ,µ−ˆy >yˆ−CVaRβ(Z) (top right), ˆy=µ(bottom left), and ˆy > µ(bottom right).
We can now state the two main theorems of equivalence, which describe how the LA problem is related to the more traditional MV and CVaR problems.
Theorem 2.1 Let
x|Ax≤b, µ′x= ¯R 6= ∅, r ∼ N(µ,Σ) and λ > 0. Then the LA problem (2.5) and the MV problem (2.6) are equivalent, i.e., they have the same optimal solution, if either (i) yˆ= ¯R or (ii) y >ˆ R¯ and λ= 1/F
ˆ y−R¯
√x′Σx
.
Proof: If ˆy = ¯R and λ >0 then LAλ,ˆy(r′x) = ˆy−λ√
x′Σxf(0) and the equivalence between (2.5) and (2.6) follows fromλf(0)>0.
If ˆy >R¯ and λ= 1/F
ˆ y−R¯
√x′Σx
then the objective functions of (2.5) can be stated as
LA1/F
ˆ y−R¯
√x′Σx
,ˆy(r′x) = 2 ¯R−yˆ−√ x′Σx
f
ˆ y−R¯
√x′Σx
F
ˆ y−R¯
√x′Σx
Maximizing this is equivalent to minimizing the variancex′Σxover the same set of feasible solutions, which follows from the fact thatF(·) is an increasing function and thatf(z) is decreasing forz≥0.
Theorem 2.2 Let
x|Ax≤b, µ′x= ¯R 6= ∅, r ∼ N(µ,Σ) and λ > 0. Then the LA problem (2.5) and the CVaR problem (2.7) are equivalent, i.e., they have the same optimal solution, ifyˆ≥R¯ and λ= 1/F
ˆ y−R¯
√x′Σx
.
Proof: If ˆy≥R¯ and λ= 1/F
ˆ y−R¯
√x′Σx
then problems (2.5) and (2.7) can be written as
LAλ,ˆy(r′x) = 2 ¯R−yˆ−√ x′Σx
f
ˆ y−R¯
√x′Σx
F
ˆ y−R¯
√x′Σx
and
CVaRF(0)(r′x) = ¯R−√ x′Σx
f
ˆ y−R¯
√x′Σx
F
ˆ y−R¯
√x′Σx
and the statement of the theorem follows.
Theorem 2.1 states the conditions under which the LA and MV problems are equivalent provided returns are normally distributed: they are equivalent (i) when the reference point is equal to the mean of the portfolio return at the optimum, or (ii) when the reference point is strictly larger than the mean of the portfolio return at the optimum and the loss aversion parameter is equal to some specific value (depending on the reference point). In the latter case, the loss aversion parameter yielding equivalence is smaller for larger reference points. Under the conditions stated in (ii), the LA (MV) problem is also equivalent to the CVaR problem; and finally the LA and CVaR problems are equivalent also when ˆy = ¯R and λ = 2 (see Theorem 2.2). The condition µ′x = ¯R, which is required in both theorems, can be interpreted as setting a lower bound on the portfolio return, R¯≤µ′x, which is binding at the optimum.8
Similar relationships between the maximization of loss-averse utility and the MV and CVaR problems are true under the assumption of t-distributed portfolio returns and additional assump- tions.9
2.2 Analytical solution for one risk-free and one risky asset
To better understand the attitude with respect to risk of linear loss-averse investors, we consider a simple two-asset world, where one asset is risk-free and the other is risky, and analyze what
8A similar constraint is required in Rockafellar and Uryasev (2000), when the equivalence of the CVaR, VaR and MV problems is shown.
9Detailed derivations can be obtained from the authors upon request.
proportion of wealth is invested in the risky asset under linear loss aversion. Another motivation for looking at this problem is that, when Tobin’s separation theorem holds, the investor’s investment decision problem can be simplified to deciding which proportion to invest in the safe asset and which to invest in some risky portfolio. As Levy, De Giorgy and Hens (2004) have shown, Tobin’s separation principle does hold under the assumption of the Tversky and Kahneman’s prospect theory utility, of which our linear loss-averse utility is a special case.10
Let r0 be the certain (deterministic) return of the risk-free asset and let r be the (stochastic) return of the risky asset. Then the portfolio return is R(x) = xr+ (1−x)r0 = r0 + (r −r0)x, where x is the proportion of wealth invested in the risky asset, and the maximization problem under consideration of the linear loss-averse investor is
max{LAλ,ˆy(R(x)) = E(R(x)−λ[ˆy−R(x)]+)
= E(r0+ (r−r0)x)−λE([ˆy−r0−(r−r0)x]+)|x∈R} (2.8) whereλ≥0,yˆ∈R and [t]+= max{0, t}.
The risky asset is binomially distributed
First we assume for the sake of simplicity and because in this case a number of results can be shown analytically, that the return of the risky asset follows a binomial distribution. We assume two states of nature: a good state of nature which yields return rg such that rg > r0 and which occurs with probability p; and a bad state of nature which yields return rb such that rb < r0 and which occurs with probability 1−p. In the good state of nature the portfolio thus yields return Rg(x) = r0 + (rg −r0)x with probability p, in the bad state of nature it yields return Rb(x) =r0+ (rb−r0)x with probability 1−p.Note that
E(r) = prg+ (1−p)rb = p(rg−rb) +rb, (2.9)
var(r) = p(1−p)(rg−rb)2, (2.10)
E(R(x)) = E(r0+ (r−r0)x) =p(r0+ (rg−r0)x) + (1−p)(r0+ (rb−r0)x)
= r0+ (p(rg−rb)−r0+rb)x, (2.11)
10In the same place, it has been shown, however, that no financial market equilibria exist under the assumption of Tversky and Kahneman’s prospect theory utility.
var(R(x)) = p(1−p)(rg−rb)2x2, (2.12)
[ˆy−Rg(x)]+=
ˆ
y−r0−(rg−r0)x, for x≤ rˆy−rg−r00
0, for x > rˆy−r0
g−r0
(2.13)
[ˆy−Rb(x)]+ =
0, for x≤ rr00−−ˆryb ˆ
y−r0−(rb−r0)x, for x > rr00−r−yˆ
b
(2.14)
Thus, the loss-averse utility of the two-asset portfolio including the risk-free asset and the binomially distributed risky asset, can be written as
LAλ,ˆy(R(x)) =r0+ (p(rg−rb)−r0+rb)x−λ p[ˆy−Rg(x)]++ (1−p)[ˆy−Rb(x)]+
(2.15) The next theorem presents the analytical solution of the loss-averse utility maximization prob- lem (2.8) for the binomially distributed risky asset with respect to a certain threshold value of the loss aversion parameter λ.
Theorem 2.3 Let rb< r0< rg, p > rr0−rb
g−rb, x∗ be the optimal solution of (2.8) and ˆλ≡ p(rg−rb)−r0+rb
(1−p)(r0−rb) (2.16)
where the risky asset’s returnr is assumed to be binomially distributed withrg (rb) being the return in the good (bad) state of nature, which occurs with probability p (1−p). Then the following holds:
(i) If 0≤λ <ˆλthen x∗= +∞ (ii) If λ= ˆλ then x∗∈[maxn
y−rˆ 0 rg−r0,rr00−−ˆryb
o ,+∞) (iii) If λ >λˆ then x∗= maxn
y−rˆ 0 rg−r0,rr00−−ˆryb
o
Proof: in the appendix.
Note that the threshold value of λ can also be written as ˆλ = (E(r)−r0)/((1−p)(r0 −rb)) and can thus be interpreted as a scaled equity premium, where the scaling factor is greater than 1 (and thus ˆλgreater than the equity premium) whenr0−rb <1/(1−p). Note, in addition, that if
an investor is not sufficiently loss-averse then the solution of the loss-averse linear utility coincides with the solution of linear utility.
As a performance measure we will consider in the addition to the Sharpe ratio,SR(Z) = µzσ−r0
z , also the relative Sharpe ratio of a random variable Z, which we define as RSR(Z) = µzσ−ˆy
z , where µzis the mean andσz is the standard deviation ofZ. We consider the relative Sharpe ratio because we think that the loss-averse investor with a given reference point ˆyis more concerned about excess returns above his/her individual reference return than about excess returns above the risk-free return. Our modified version of the Sharpe ratio is also supported by equation (2.4), where the expected return always enters with the reference point and the standard deviation as−(µ−y)/σ.ˆ The next remark characterizes the optimal risky asset’s weight x∗ and, in particular, states its sensitivity with respect to the loss aversion parameters λand ˆy. In addition, the relative Sharpe ratio is given for the optimal weight.
Remark 2.1 Let rb < r0 < rg, E(r)> r0, x∗ be the optimal solution of (2.8) and λ >λ, whereˆ λˆ is defined by (2.16). Then
(i) x∗ ∈[0,1) if rb ≤yˆ≤rg; (ii) the mean-variance problem
min var(R(x)) = min{p(1−p)(rg−rb)2x2}
has the same solution, namely x∗ = 0, as the loss-averse utility maximization problem (2.8) if yˆ=r0;
(iii)
dx∗
dλ = 0, dx∗ dˆy =
−r0−1rb <0, for ˆy < r0 0, if yˆ=r0
1
rg−r0 >0, for ˆy > r0
(2.17)
(iv) SR(R(x)) = SR(r)>0;
(v)
RSR(R(x∗)) =
q p
1−p >0, for ˆy < r0
−q
1−p
p <0, for ˆy > r0 (2.18) (vi)
RSR(r) = r p
1−p+ rb−yˆ
pvar(r). (2.19)
Theorem 2.3(iii) implies that the sufficiently loss-averse investor (λ >λ) with the reference pointˆ being equal to the risk-free rate (ˆy=r0), will not invest invest in the risky asset (x∗ = 0) when its return has the binomial distribution and the expected equity premium is positive. In case when the reference point is below (above) the risk-free rate, ˆy < r0 (ˆy > r0), the fraction invested in the risky asset decreases (increases) with an increasing reference point. However, in all cases is the fraction invested in the risky asset insensitive to the change of the penalty parameter λ, provided the investor is sufficiently loss-averse, i.e., λ >λ. In addition, it follows from Remark 2.1(iv), (v)ˆ that both the Sharpe ratio of the portfolio returnR(x) and the relative Sharpe ratio of the optimal portfolio returnR(x∗) are insensitive with respect to the penalty parameter and the reference point.
The risky asset is normally distributed
Let us now assume that the risky asset’s return is normally distributed, i.e., r ∼N(µ, σ2) where σ >0. Then also the portfolio return R(x) = r0+ (r−r0)x is normally distributed withR(x)∼ N(r0+ (µ−r0)x, x2σ2) and the loss-averse utility function can be formulated as
LAλ,ˆy(R(x)) =
r0+ (µ−r0)x−λσxh
y−rˆ 0
σx −µ−rσ 0 F
y−rˆ 0
σx −µ−rσ 0 +f
y−rˆ 0
σx −µ−rσ0i
, x6= 0 r0−λ[ˆy−r0]+, x= 0
(2.20) The following theorem proves properties of the optimal solution of the loss-averse utility maximiza-
tion problem (2.8) under the assumption that the risky asset’s return is normally distributed.
Theorem 2.4 Let x∗ be the optimal solution of problem (2.8), λ > 0, ˆλN = µ−σhr0, where h =
−µ−rσ0F
−µ−rσ 0 +f
−µ−rσ0
and the risky asset is assumed to be normally distributed such that r∼N(µ, σ2) and σ >0. Then the following holds
(i) If µ≤r0 then the maximum of (2.20) is reached at x∗ =−∞
(ii) If µ > r0 andλ <ˆλN then the maximum of (2.20) is reached at x∗= +∞
(iii) If µ > r0, λ= ˆλN and yˆ6=r0 then the maximum of (2.20) is reached at x∗= +∞ (iv) If µ > r0, λ= ˆλN and yˆ=r0 then the maximum of (2.20) is reached for any x∗∈R
(v) If µ > r0 andλ >ˆλN then the maximum of (2.20) is reached at x∗=−∞
Proof: in the appendix.
Assuming the more reasonable case that µ > r0, the two main results are stated in parts (ii) and (v) of the theorem.11 As before, the investor’s optimal investment behavior depends crucially on the value of his/her penalty parameter. If it is below some threshold value (λ <λˆN) the risky asset’s optimal weight goes to plus infinity, if it is above that same threshold (λ >λˆN), the risky asset’s optimal weight goes to minus infinity. So, if investors are sufficiently loss-averse, they want to go infinitely short in the risky asset. In reality, however, investors usually face a short-sales constraint on risky assets. Therefore, the next theorem presents properties of the solution of the constrained loss-averse utility maximization problem
max{LAλ,ˆy(R(x))|x≥0} (2.21)
where LAλ,ˆy(R(x)) is given by (2.20) and the no-short-sales restriction is applied to the risky asset.
Theorem 2.5 Let x∗ be the optimal solution of problem (2.21), λ >λˆN, where λˆN >0 is defined as in Theorem 2.4, µ > r0, yˆ6=r0 and the risky asset is assumed to be normally distributed such that r ∼N(µ, σ2) and σ >0. Then x∗ >0,
dx∗
dλ = σ2(x∗)3 λ(ˆy−r0)2
µ−r0
σ F
ˆy−r0
σx∗ −µ−rσ 0 f
y−rˆ 0
σx∗ −µ−rσ0 −1
<0 (2.22)
11Parts (iii) and (iv) cover the special case when the penalty parameter is exactly equal to some threshold value, i.e.,λ= ˆλN.
and
dx∗
dˆy = x∗ ˆ y−r0
>0, for ˆy > r0
<0, for ˆy < r0 (2.23)
Proof: in the appendix.
Like before, when the risky asset’s return was binomially distributed, the optimal fraction invested in the risky asset decreases (increases) with an increasing reference point, provided the reference point is below (above) the risk-free interest rate, i.e., ˆy < r0 (ˆy > r0). So, when the investor’s reference return is below the risk-free interest rate, he/she will invest less into the risky asset with an increasing ˆy, as the risk-free asset yields a high enough return anyway. On the other hand, when the investor’s reference return is above the risk-free rate, he/she will want to invest more into the risky (and more profitable) asset with an increasing ˆy in order to meet the return target. The optimal weight of the risky asset also decreases with an increasing penalty parameter.
So, if the investor’s reference point is below the risk-free interest rate, his/her optimal weight of the risky asset is a decreasing function of both the penalty parameter and the reference point. The following remark presents our findings regarding the relative Sharpe ratio.
Remark 2.2 Let the assumptions of Theorem 2.5 be satisfied. Then the following holds (i) SR(R(x)) = SR(r) = µ−rσ0;
(ii) Let x6= 0. Then RSR(R(x)) = r0xσ−yˆ+ SR(r);
(iii) Let x∗ be the solution of problem (2.21). Then dRSR(R(x∗))
dλ =− x∗σ
λ(r0−y)ˆ
µ−r0
σ F
ˆ y−r0
σx∗ − µ−σr0 f
ˆ y−r0
σx∗ −µ−σr0 −1
=
>0, for ˆy < r0
<0, for ˆy > r0
(iv) Let x∗ be the solution of problem (2.21). Then dRSR(R(xdˆy ∗)) = 0.
Note that the portfolio performance (in terms of RSR) of the loss-averse investor facing a short-sales constraint increases with an increasing degree of the loss aversion if the reference point is below the risk-free rate; and it decreases if the reference point exceeds the risk-free rate. Note in addition that a positive expected equity premium and the reference point being below the risk-free rate are
sufficient conditions such that the relative Sharpe ratio of the optimal portfolio of problem (2.21) is positive.
2.3 Numerical solution
In empirical applications or simulation experiments, the linear loss-averse utility maximization problem (2.1) has to be solved numerically. We thus reformulate the original problem as the bilinear parametric problem ofn−variables
max ( 1
S
S
X
s=1
rs′x−λ[ˆy−rs′x]+
Ax≤b )
(2.24)
whereλ,x, ˆy,Aandbare defined as above, andrsis then−vector of observed returns,s= 1, . . . , S.
It can be shown that (2.24) is equivalent to the following (n+S)−dimensional linear program- ming (LP) problem
maxx,y−
ˆ µ′x− λ
Se′y−
Ax≤b, Bx+y−≥ye, yˆ −≥0
(2.25) where ˆµ= (ˆµ1, . . . ,µˆn)′ is the vector of estimated expected returns; i.e., ˆµi = S1 PS
s=1rsi, e is an S−vector of ones, B′ = [r1, r2, . . . , rS] and y− ∈ RS is an auxiliary variable.12 The equivalence should be understood in the sense that if x∗ is the x portion of an optimal solution for (2.25), then x∗ is optimal for (2.24). On the other hand, if x∗ is optimal for (2.24) then ((x∗)′,(y−)′)′ is optimal for (2.25) whereys−= [ˆy−r′sx∗]+,s= 1, . . . , S. Thus, the utility function of problem (2.25) maximizes the expected return of the portfolio penalized for cases when its return drops below the reference value ˆy. However, Best, Grauer, Hlouskova and Zhang (2010) introduced a method that efficiently (and directly) solves the problem (2.24).
3 Simulation study assuming different structures and degrees of dependence
There is growing evidence that dependence in financial markets is not symmetric but of an asym- metric nature. Stock returns, for example, appear to display stronger dependence in bear than
12De Giorgi, Hens and Mayer (2007) suggested to solve the original problem by a different equivalent LP problem with (n+ 2S) dimensions.
in bull markets. The presence of such asymmetry violates the assumption of normally distributed asset returns, which underlies traditional mean-variance analysis and also our previous analytical analysis. The consequences of falsely assuming symmetric dependence are diverse: value-at-risk levels, for example, will generally be too optimistic when the potential for extreme co-movements is underestimated. A growing number of studies on portfolio management consider the asymmetric dependence of stock returns in an explicit way. These studies vary in how portfolios are optimized but agree to a large part in the use of copula theory. A copula links together two or more marginal distributions to form a joint distribution, where the marginal distributions can be of any form. The multivariate distribution can thus be split in two parts which may be treated completely separately, the univariate marginal distributions and the copula.13
The Gaussian (normal) copula is the one that is implicitly used all the time. It is implied by the joint normal distribution and is completely determined by the linear correlation ρ. One property of the Gaussian copula is that it displays symmetric dependence, i.e., dependence in the lower and upper tail of the distribution is the same. On the other hand, the Clayton copula is often used to model asymmetric dependence: under the Clayton copula the probability of joint negative extreme co-movements is greater than the probability of joint positive extreme co-movements, i.e., dependence in the lower tail of the distribution is larger than in its upper tail. We use the term structure of dependence to describe different copulas and the termdegree of dependence to describe the level or amount of dependence, given a specific copula.
We study properties of the optimal linear loss-averse portfolio and its differences with respect to the optimal mean-variance portfolio by running simulation experiments when the distribution of returns is implied by the Gaussian and the Clayton copulas for different degrees of dependence.
The rank correlation Kendall’s tau14is used to find those Gaussian and Clayton copula parameters which reflect the same degree of dependence. We consider a simple two-asset world, where the investor can invest into two risky assets, such that one is considerably safer than the other. We thus simulate two asset returns which, first, are distributed as N(µ,Σ) involving the Gaussian copula and, second, display the same marginal (i.e., normal) distributions as above but instead of the Gaussian use the Clayton copula. The expected return, µ ∈ R2, and the covariance matrix,
13Formally, the copulaC of two random variablesX andY with marginal distribution functionsFx(·) andFy(·) is implicitly defined byF(x, y) =C(Fx(x), Fy(y)), whereF(·) is the two-dimensional distribution function. For a thorough introduction to copula theory see Joe (1997) and Nelsen (2006).
14Kendall’s tau is a measure of dependence which does not depend on the marginal distributions (while linear correlation does) but is completely specified by the copula.
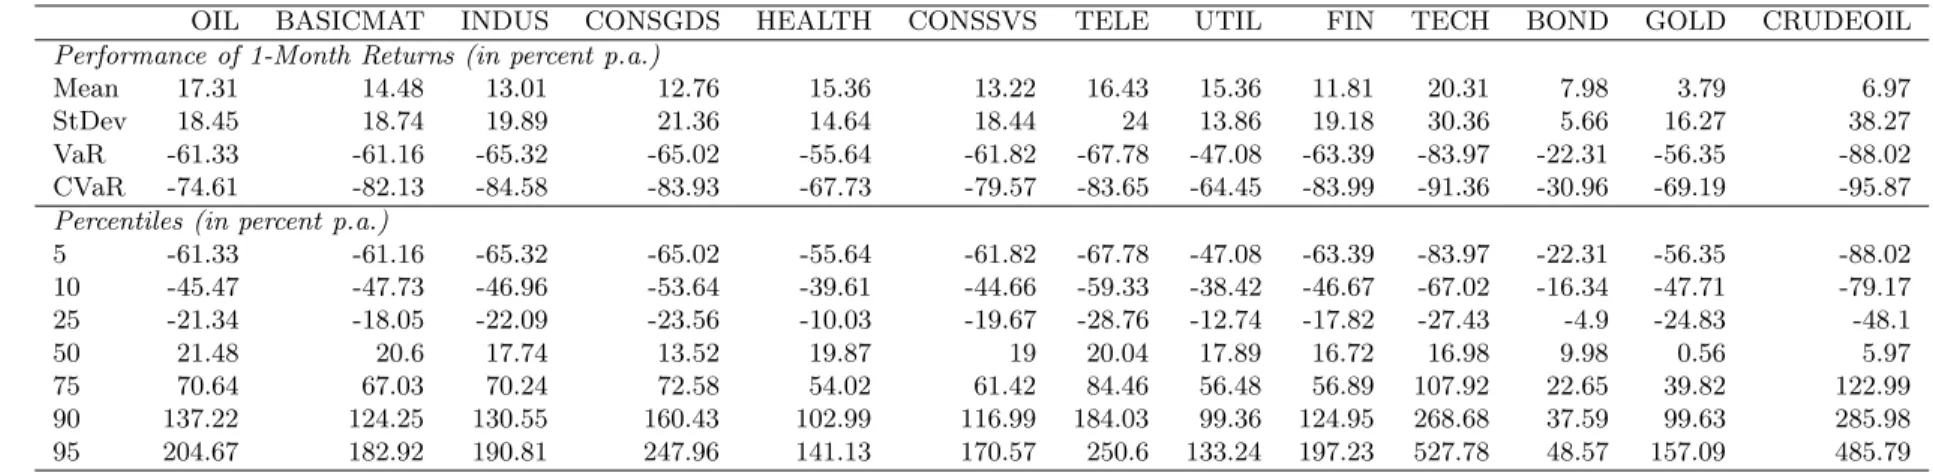
Σ ∈ R2×2, are the sample estimates of the EU dataset employed in the empirical section. We use the bond as a proxy of the safer (and less profitable) asset and the overall stock index as a proxy of the riskier (and more profitable) asset. For the EU market the corresponding quantities are µ1 = 7.98%, µ2 = 13.27%, σ12 = 5.66%, σ22 = 16.92% and ρ = 0.07, where σ21 and σ22 are the estimated variances of asset 1 (bond) and asset 2 (stock) andρ is their estimated correlation. As markets usually move together, we only consider a positive degree of dependence in the simulation exercise. The sample size of the simulation is 1,000.
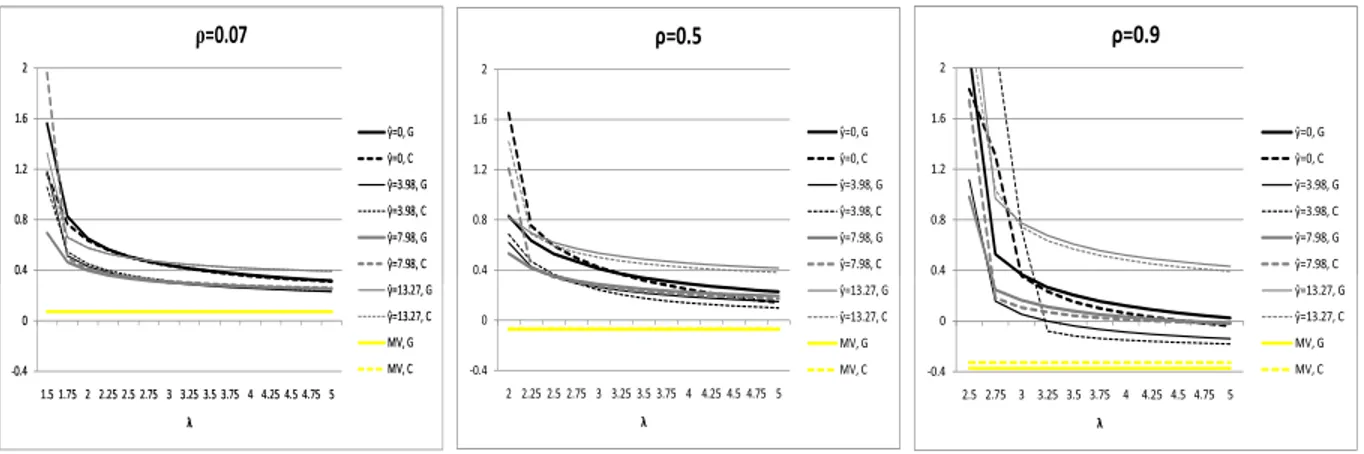
Our experiments are conducted for changing the loss aversion parameter λ while the reference point ˆy remains fixed, ˆy ∈ {0%,3.98%,7.98%,13.27%},15 and while the dependence parameter for both copulas remain fixed, ρ ∈ {0.07,0.5,0.9}. We thus examine the performance and the asset allocation of optimal linear loss-averse and mean-variance portfolios when returns are generated by the Gaussian and Clayton dependence models.
Figure 3 presents optimal weights of the riskier asset for different reference points and depen- dence parameters, assuming Gaussian and Clayton dependence models. As the assumptions in our simulation experiment deviate from those in our theoretical analysis, i.e., we now consider a “safer”
(but not totally risk-free) asset and we assume different structures and degrees of dependence, it will be interesting to see which of our analytical findings still hold. The very first observation is that the weight of the riskier asset is a decreasing function of the penalty parameterλ. So investors allocate less wealth to the riskier asset when their loss aversion parameter is higher. This seems to be true for both the Gaussian and Clayton copulas and is in line with our findings for the case when a no-short-sales restriction is imposed on the risky asset and the return of the risky asset is normally distributed, see Theorem 2.5.
On the other hand, what seems to be different with respect to the dependence structure is the weight of the riskier asset: for smallerλ, the weight seems to be larger when dependence is modeled by the Clayton copula, for largerλ(above some threshold level) the weight seems to be larger when dependence is modeled by the Gaussian copula. What can also be observed is that the threshold penalty parameter λ∗ beyond which the weight of the riskier asset falls below one is increasing with an increasing dependence parameter ρ; i.e., x(λ,y, ρ)ˆ ≤1 for λ ≥ λ∗(ˆy, ρ) where λ∗(ˆy, ρ) is increasing inρfor a fixed reference point ˆy. So, in order to display a given investment behavior, i.e., a given optimal investment in the riskier asset, investors need to be more loss-averse (in terms of
15Note that ˆy= 3.98% corresponds to the mean of the risk-free interest rate from our EU dataset.
ρ=0.07
ρ=0.07
0.4 0.8 1.2 1.6 2
ρ=0.5
ŷ=0, G ŷ=0, C ŷ=3.98, G ŷ=3.98, C ŷ=7.98, G ŷ=7.98, C
-0.4 0 0.4 0.8 1.2 1.6 2
2 2.25 2.5 2.75 3 3.25 3.5 3.75 4 4.25 4.5 4.75 5 λ
ρ=0.5
ŷ=0, G ŷ=0, C ŷ=3.98, G ŷ=3.98, C ŷ=7.98, G ŷ=7.98, C ŷ=13.27, G ŷ=13.27, C MV, G MV, C
0.4 0.8 1.2 1.6 2
ρ=0.9
ŷ=0, G ŷ=0, C ŷ=3.98, G ŷ=3.98, C ŷ=7.98, G ŷ=7.98, C
-0.4 0 0.4 0.8 1.2 1.6 2
2.5 2.75 3 3.25 3.5 3.75 4 4.25 4.5 4.75 5 λ
ρ=0.9
ŷ=0, G ŷ=0, C ŷ=3.98, G ŷ=3.98, C ŷ=7.98, G ŷ=7.98, C ŷ=13.27, G ŷ=13.27, C MV, G MV, C
Figure 3: Sensitivity analysis of riskier asset’s optimal weight with respect toλfor different ρ Returns are simulated using the Gaussian (solid line) and Clayton (dashed line) dependence models with µ1 = 7.98%, σ21 = 5.66% (safer asset) and µ2 = 13.27%, σ22 = 16.92% (riskier asset). These parameters are estimates for the bond and overall stock index returns in our empirical EU dataset (1982 – 2008). We use values of zero, the risk-free interest rate and the reported means of the safer and riskier assets for the reference point. The sample size of the simulation is 1,000. G (C) indicates that the returns were simulated with the Gaussian (Clayton) copula, MV indicates that the optimization procedure used was mean-variance.
the penalty parameter) with an increasing degree of dependence. Finally, for all three dependence parameters ρ is the weight of the riskier asset of the mean-variance investor significantly smaller than the weight of the loss-averse investor, however, they are nearly identical for both dependence models.
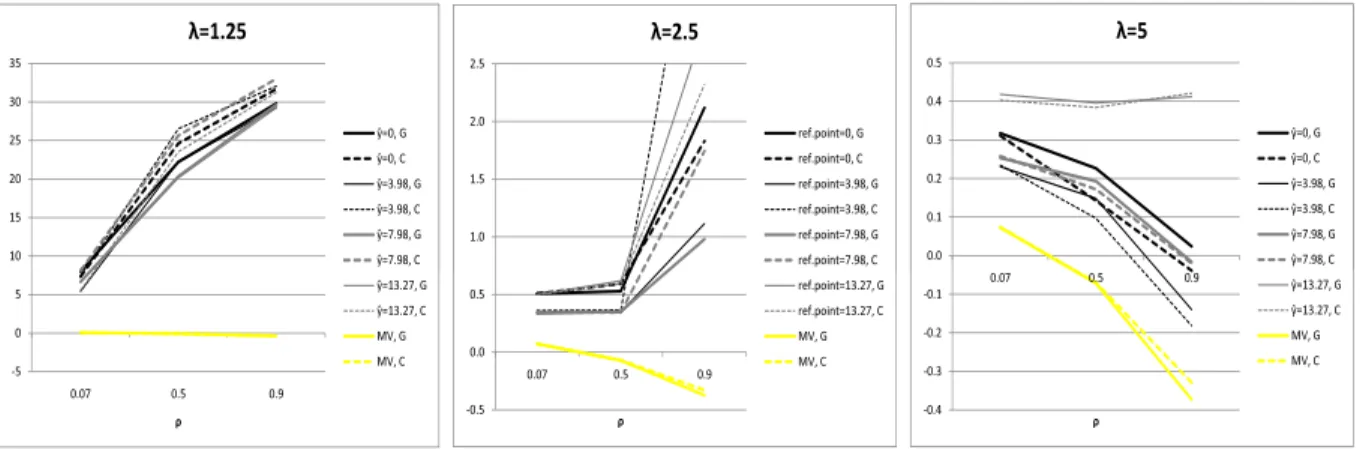
Certain monotonicity properties of the riskier asset’s weight with respect to the dependence parameterρcan be seen in Figure 4. The optimal weight of the riskier asset under both dependence models is an increasing function of the dependence parameter ρ for smaller penalty parametersλ;
and is a decreasing function of ρ for higher penalty parameters; i.e., higher positive dependence seems to induce “riskier” behavior of less loss-averse investors who seem to invest more into the riskier asset when the dependence between assets increases. However, investors with a higher degree of loss aversion seem to become more conservative when dependence increases.
Figure 5 suggests that the dependence of the riskier asset’s weights with respect to the reference point is in line with our findings for the case when a no-short-sales restriction is imposed on the risky asset and the risky asset’s return is normally distributed, see Theorem 2.5. We can observe a U-shape of weights: first (ˆy≤yˆ∗) the optimal weight of the riskier asset decreases with an increasing
10 15 20 25 30 35
λ=1.25
ŷ=0, G ŷ=0, C ŷ=3.98, G ŷ=3.98, C ŷ=7.98, G ŷ=7.98, C
-5 0 5 10 15 20 25 30 35
0.07 0.5 0.9
ρ
λ=1.25
ŷ=0, G ŷ=0, C ŷ=3.98, G ŷ=3.98, C ŷ=7.98, G ŷ=7.98, C ŷ=13.27, G ŷ=13.27, C MV, G MV, C
1.0 1.5 2.0 2.5
λ=2.5
ref.point=0, G ref.point=0, C ref.point=3.98, G ref.point=3.98, C ref.point=7.98, G ref.point=7.98, C
-0.5 0.0 0.5 1.0 1.5 2.0 2.5
0.07 0.5 0.9
ρ
λ=2.5
ref.point=0, G ref.point=0, C ref.point=3.98, G ref.point=3.98, C ref.point=7.98, G ref.point=7.98, C ref.point=13.27, G ref.point=13.27, C MV, G MV, C
0.0 0.1 0.2 0.3 0.4 0.5
0.07 0.5 0.9
λ=5
ŷ=0, G ŷ=0, C ŷ=3.98, G ŷ=3.98, C ŷ=7.98, G ŷ=7.98, C
-0.4 -0.3 -0.2 -0.1 0.0 0.1 0.2 0.3 0.4 0.5
0.07 0.5 0.9
ρ
λ=5
ŷ=0, G ŷ=0, C ŷ=3.98, G ŷ=3.98, C ŷ=7.98, G ŷ=7.98, C ŷ=13.27, G ŷ=13.27, C MV, G MV, C
Figure 4: Sensitivity analysis of riskier asset’s optimal weight with respect toρ for different λ Returns are simulated using the Gaussian (solid line) and Clayton (dashed line) dependence models with µ1 = 7.98%, σ21 = 5.66% (safer asset) and µ2 = 13.27%, σ22 = 16.92% (riskier asset). These parameters are estimates for the bond and overall stock index returns in our empirical EU dataset (1982 – 2008). We use values of zero, the risk-free interest rate and the reported means of the safer and riskier assets for the reference point. The sample size of the simulation is 1,000. G (C) indicates that the returns were simulated with the Gaussian (Clayton) copula, MV indicates that the optimization procedure used was mean-variance.
reference point, beyond some threshold ˆy∗, i.e., ˆy≥yˆ∗, the optimal weight increases with increasing ˆ
y. So, when the investor’s reference return is below some threshold level, he/she wants to invest less into the riskier asset with an increasing ˆy, as the alternative (less risky) asset yields a high enough return anyway. On the other hand, when the investor’s reference return is above the threshold level, he/she will want to invest more into the riskier (and more profitable) asset with an increasing ˆ
y in order to meet the return target. For smaller penalty parameters this threshold ˆy∗ seems to coincide with the mean return of the safer asset (bond); i.e, ˆy∗ = 7.98%, while for larger penalty parameters the threshold seems to coincide with the risk-free interest rate (ˆy∗ = 3.98%). Note that according to Theorem 2.5 this threshold corresponds to the return of the (truly) safe asset. This property also explains the ranking of the size of the risky weights as presented in Figure 3, for both the Gaussian and the Clayton copulas provided the penalty parameter λis large enough.
When focusing on performance measures such as the Sharpe ratio (SR) and the relative Sharpe ratio (RSR),16we can see that the property of RSR as stated in Remark 2.2(iii), namely RSR being an increasing function of the penalty parameterλfor ˆy≤yˆ∗and being a decreasing function ofλfor
16Note that SR =√µ′x∗
x∗)′Σx∗ and RSR = √µ′x∗−yˆ
x∗)′Σx∗