June 12, 2008
Document of the World Bank
Report No. 43396-LK Sri Lanka Addressing the Needs of an Aging Population
Report No. 43396-LK
Sri Lanka
Addressing the Needs of an Aging Population
Human Development Department South Asia Region
Public Disclosure AuthorizedPublic Disclosure AuthorizedPublic Disclosure AuthorizedPublic Disclosure Authorized
Report No. 43396-LK
Sri Lanka
Addressing the Needs of an Aging Population
June 12, 2008
Human Development Unit South Asia Region
Document of the World Bank
ABBREVIATIONS AND ACRONYMS ADL Activities of Daily Living
A/L Advanced Level
CSPS Civil Service Pension Scheme
DC Defined Contribution
DCS Department of Census and Statistics
DB Defined Benefit
EPF Employees’ Provident Fund
ETF Employees Trust Fund
GCE General Certificate of Education
GDP Gross Domestic Product
HIES Household Income and Expenditure Survey IADL Instrumental Activities of Daily Living IHD Ischemic Heart Disease
IHP Institute for Health Policy
ILO International Labour Organization LTTE Liberation Tigers of Tamil Eelam MOH Ministry of Health
NCD Non-Communicable Diseases
NGO Non-Governmental Organization
OECD Organization for Economic Cooperation and Development
O/L Ordinary Level
SLAS Sri Lanka Aging Study SSB Social Security Board
TEWA Termination of Employment of Workman Act
Vice President : Praful Patel
Country Director : Naoko Ishii
Sector Director : Michal J. Rutkowski
Sector Manager : Mansoora Rashid
Task Team Leader : Milan Vodopivec
CONTENTS
Executive Summary ...i
1. DEMOGRAPHIC TRENDS, THE PROFILE OF OLD PEOPLE, AND THE EMERGING ISSUES ... 1
A. Demographic trends ... 2
B. Socio-economic characteristics of old people... 6
C. Emerging issues ... 9
Annex 1.1: Description of the World Bank 2006 Sri Lanka Aging Survey ... 11
2. INFORMAL SUPPORT SYSTEMS ... 13
A. Living arrangements ... 13
B. Intergenerational transfers (cash and in-kind) ... 17
C. Respect and authority within household and society ... 23
D. Expectations of future support ... 25
E. Formal care for the Elderly ... 27
F. Policy Recommendations... 29
Annex 2.1: Tables... 32
3. INCOME SUPPORT PROGRAMS FOR OLD AGE ... 40
A. Assessment of current system ... 40
B. An integrated approach to pension policy... 51
Annex 3.1: Tables... 64
4. HEALTH STATUS, PUBLIC HEALTH, AND HEALTH CARE OF OLD PEOPLE ... 67
A. What are the prospects for healthy aging? ... 67
B. How accessible and adequate are the healthcare ... 72
services for the elderly? ... 72
C. What are the prospects for sustainable healthcare financing? ... 82
D. How should the health system respond? ... 87
Annex 4.1: Regression results ... 91
Annex 4.2: The IHP Health Expenditure Projection Model... 94
5. LABOR MARKET AND POPULATION AGING... 97
A. Labor force projections: shrinking of the labor supply after 2030... 97
B. Working in old age ... 99
C. Determinants of work activity of old workers ... 108
D. Obstacles for employment of old workers ... 109
E. Concluding remarks and policy recommendations ... 112
Annex 5.1: Tables... 114
REFERENCES ... 120
BOXES Box 2.1: Voices of old people suggest a decline in their respect and authority... 24
Box 2.2: Changing perceptions of old parents by their children... 28
Box 3.1: International experience with informal sector pension coverage ... 48
Box 3.2: The aborted reform of the CSPS ... 50
Box 4.1: Actuarial health cost projection for Sri Lanka, 2005-2101 ... 83
Box 5.1: Push and pull factors of labor market withdrawal... 105
Box 5.2: The generosity of Sri Lanka’s severance pay system... 110
FIGURES
Figure 1.1: Demographic aging, Sri Lanka and world regional averages (percentage of population over 60
years old, 2000-2050) ... 1
Figure 1.2: Sri Lanka’s population, 2001-2100 ... 3
Figure 1.3: Projected trends in total fertility, Sri Lanka 2001-2100 ... 3
Figure 1.4: Projected trends in life expectancy by sex, Sri Lanka 2001-2100... 3
Figure 1.5: Share of the old people age groups, Sri Lanka 2001-2100... 3
Figure 1.6: Changes in age structure of Sri Lanka’s population 2007-2075... 4
Figure 1.7: Trends in dependency ratios, Sri Lanka 2001-2101 ... 5
Figure 1.8: Fertility trends in low fertility countries and Sri Lanka ... 6
Figure 1.9: Numbers of old people by sex and age, 2006... 7
Figure 1.10: Marital status of old people, 2006 ... 7
Figure 1.11: Poverty incidence by age groups (2002) ... 8
Figure 1.12: Comparison of needed rate of GDP per capita growth to catch up with Japan at the same point of population aging and historical growth record, Sri Lanka and regional comparators ... 10
Figure 2.1: Living arrangement of old people by age, gender, and education... 14
Figure 2.2: Living arrangement of elderly, 1992 and current ... 15
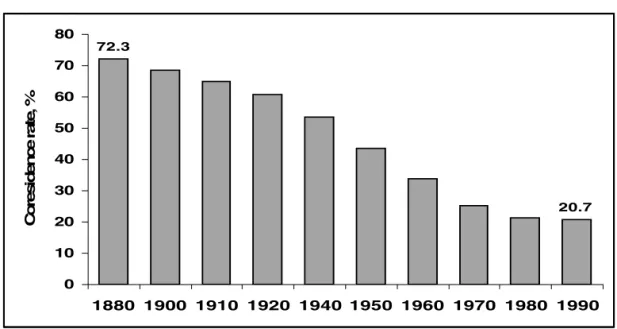
Figure 2.3: Percentage of 65+ year old US males living with family, 1880-1990... 16
Figure 2.4: Percentage of persons over 60 living alone, selected countries... 17
Figure 2.5: Opinions from old people and adult children on the best living arrangement... 18
Figure 2.6: Percentage of elderly reporting children as main source of income by age, unweighted average for China (urban), Indonesia, Thailand and Sri Lanka... 20
Figure 2.7: Expectations of support from children over time: ... 27
Figure 3.1: Pension value in real terms for F&F scheme by age of enrollment... 44
Figure 3.2: Distribution of monthly pensions of civil servants... 45
Figure 3.3: Coverage of the workforce with old age income support programs... 46
Figure 3.4: Share of population over age 60 in selected Asian countries, 2000-2030... 47
Figure 3.5: Spending as share of GDP without reforms, 2002-2050 ... 49
Figure 4.1: Composition of mortality by major cause in Sri Lanka compared to European and South-East Asian regions of WHO... 68
Figure 4.2: Ratio of age-standardized death rates in low and middle-income countries to those in high- income countries, 2005 ... 68
Figure 4.3: Age-specific prevalence of blindness by number of persons per 10,000 population, Sri Lanka 1981 and 2001... 70
Figure 4.4: Age-specific prevalence of disability in hands by number of persons per 10,000 population, Sri Lanka 1981 and 2001 ... 70
Figure 4.5: Age-specific prevalence of disability in legs by number of persons per 10,000 population, Sri Lanka 1981 and 2001... 70
Figure 4.6: Age-specific prevalence of deafness and dumbness by number of persons per 10,000 population, Sri Lanka 1981 and 2001 ... 70
Figure 4.7: Age-specific prevalence of blindness by number of persons per 10,000 population, Sri Lanka 1981 and 2001... 71
Figure 4.8: Age-specific prevalence of disability in hands by number of persons per 10,000 population, Sri Lanka 1981 and 2001 ... 71
Figure 4.9: Age-specific prevalence of disability in legs by number of persons per 10,000 population, Sri Lanka 1981 and 2001... 71
Figure 4.10: Age-specific prevalence of deafness and dumbness by number of persons per 10,000 population, Sri Lanka 1981 and 2001 ... 72
Figure 4.11: Changes in age-sex standardized mortality rates by disease group, Australia 1922-2000 ... 78
Figure 4.12: Trends in national health expenditure under different demographic scenarios, 2005-2051... 84
Figure 4.13: Impact of aging versus other cost drivers on future health spending by 2025 ... 84
Figure 4.14: Projected national health expenditure in main model scenarios (% of GDP) ... 86
Figure 4.15: Trends in outpatient utilization rates in main model scenarios (visits per capita per annum) 86 Figure 4.16: Trends in public sector inpatient productivity in main model scenarios (unit cost of average admission) ... 87
Figure 4.17: Trends in public sector share of outpatient provision in main model scenarios (% of total) . 87 Figure 5.1: Labor force projections, 2001-2070 ... 98
Figure 5.2: Age composition of standard labor force projections, by gender (2001-2070) ... 98
Figure 5.3: Education structure of the labor force, 1990 and 2004... 99
Figure 5.4: Labour force participation, by age and gender, 1992 and 2004 (in percent)... 100
Figure 5.5: Labour force participation of old workers, 1992-2004 (in percent) ... 100
Figure 5.6: Retirement status, by prime-age employment type and age ... 101
Figure 5.7: Unemployment rates by age and gender (1992 and 2004) ... 102
Figure 5.8: Retirement status by age and gender (percent)... 103
Figure 5.9: Old workers by type of employment status and type of employer ... 104
Figure 5.10: Old workers by sector of work and occupation ... 104
Figure 5.11: Reasons for retirement from full time work ... 106
Figure 5.12: Average number of hours worked, by age and gender, ... 107
Figure 5.13: Age wage profile, by sector and gender ... 107
TABLES Table 2.1: Sources of support in five Asian countries ... 18
Table 2.2: International comparison of major sources of income of old people... 19
Table 2.3: Percent of old people receiving ADL support, by type of provider and age of older parent ... 21
Table 2.4: Percent of old persons receiving IADL support by gender of the older adult ... 22
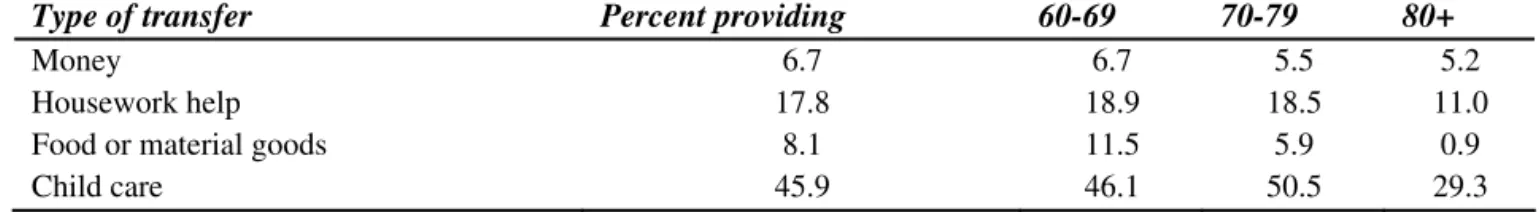
Table 2.5: Percent of old people providing transfers to adult children within previous 12 months, ... 23
Table 2.6: Level of participation in family decision making process ... 23
Table 2.7: Attitudes of old people and adult children on who should be primarily responsible for taking care of parents during old age ... 25
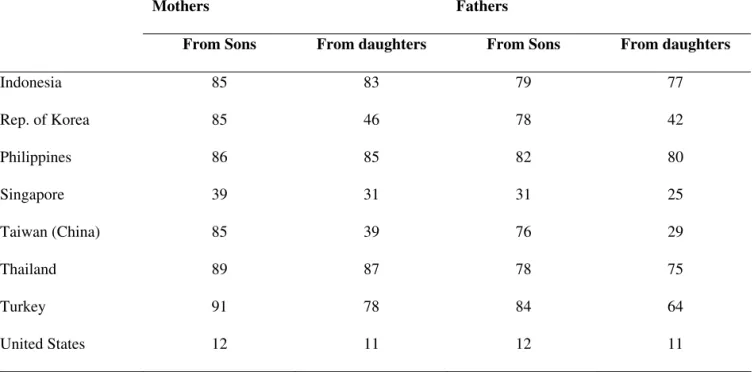
Table 2.8: Percent of old people who expect financial help from sons and daughters ... 26
Table 2.9: Distribution of day centers for elderly, by province ... 29
Table 3.1: Comparison of social pensions in selected countries... 41
Table 3.2: Key indicators for the five earnings-related schemes in Sri Lanka ... 42
Table 3.3: Regional patterns for selected retirement parameters ... 52
Table 3.4: Use of EPF balances ... 53
Table 3.5: Current and new pension policy ... 55
Table 3.6: Sri Lankan workers’ retirement plans, by type of employment... 57
Table 4.1: Distribution of health status by socioeconomic quintiles ... 69
Table 4.2: Sources of treatment used by sick persons ... 73
Table 4.3: Distribution of institutions and patient turnover by level of facilities, 2003 ... 73
Table 4.4: International comparison of health outcomes and expenditures ... 74
Table 4.5: Average out-of-pocket costs, travel and waiting times for outpatient-care by facility type ... 75
Table 4.6: The prevalence of diabetes and prior diagnosis in elderly aged 60-65 years ... 76
Table 4.7: Distribution of facility utilization by socioeconomic quintiles... 81
Table 4.8: Proportions of elderly who have been diagnosed with chronic disease who have had relevant tests done in past 12 months ... 82
Table 4.9: Proposed Aging activities, with prioritizations, in the area of healthcare ... 90
ACKNOWLEDGEMENTS
This report was prepared by the team led by Milan Vodopivec (senior economist, SASHD), based on background papers or contributions by Nisha Arunatilake (consultant, labor market chapter); Angelique Chan (consultant, chapter on informal support of old people); Robert Palacios (senior economist, SASHD, chapter on income support programs for old age); Irudaya Rajan (consultant, chapter on informal support of old people), Daya Samarasignhe (long-term care of old people); Oleksiy Sluchynskyy (SASHD, chapter on income support programs for old age); and Nimnath Withanachchi (SASHD, health chapter). A valuable input from the Institute for Health Policy (provided by Ravi Rannan-Eliya, M.A.L.R.
Perera, and Aparnaa Somanathan) in the form of the draft health chapter, analyses of demographic trends, and socio-economic conditions of elderly is also gratefully acknowledged. Significant input to the health chapter was provided also by Anabela Abreu (sector manager, SASHD) and Michael Maurice Engelgau (SASHD). Helpful comments were obtained also from peer reviewers Patricia Alailima, former Director General, Ministry of Finance, Sri Lanka, and Anita Schwarz (lead economist, ECSHD), as well as from Mr. Kumaradasa, Addl. Secretary, Ministry of Labour Relations and Manpower, and W. Yamuna Chitranganie, Addl. Secretary, Ministry of Social Services and Social Welfare.
The report was prepared under the overall guidance of Julian Schweitzer (sector director, SASHD), Mansoora Rashid (sector manager, Social Protection, SASHD), and Naoko Ishii (country director, Sri Lanka). The team benefited from the discussion of the concept note at the “Aging Study Steering Committee” meeting, chaired by Mrs. V. Jegarasasingham, secretary, Ministry of Social Service and Social Welfare. The team would also like to thank Mr. A.G.W. Nanayakkara, former Director General, and Mr. Yasantha Fernando, Director, Sample Service, the Department of Census and Statistics, for providing the sampling frame for the survey of the elderly, and ACNielsen Lanka (Pvt) Limited for the carefully administered survey of elderly.
EXECUTIVE SUMMARY
I. Background
1. In slightly more than two decades, Sri Lanka’s population will grow to be as old as Europe or Japan’s today, but its level of income will be much lower. It would take a spectacular growth for Sri Lanka to catch up with developed countries’ per capita level of income. Therefore, the traditional intergenerational systems in place today will have less time to adapt as the speed of the aging process will have been unprecedented in the industrial world. Without major changes, Sri Lanka will face this massive social challenge at a level of income and pension system coverage that is much below that of countries already at a similar stage in their demographic transitions. This study is about the key issues that will have to be addressed in order to successfully avert serious problems, or even crisis, as Sri Lanka’s inevitable population aging unfolds.1
2. Sri Lanka faces serious challenges on several fronts in addressing the onset of rapid aging.
In developed countries, challenges of aging are associated primarily with the negative impact of aging on economic growth, and the need to plan for additional public and private outlays for old age income support and healthcare. In Sri Lanka, a developing country, these challenges are compounded by the fact that many old people, now and in the future, lack social security coverage and may therefore face poverty;
that the effectiveness of traditional, family support of old people may be reduced; that many old people are deprived of choice, as they are forced to work late in their life and only retire because of health reasons; and that the health system may not be adequately focused to address the healthcare needs of elderly, and may be constrained by lack of resources and their inequitable distribution.
3. Developing an effective, coherent strategy to address population aging thus needs to concentrate on the following four key, interconnected challenges:
• How to reinforce traditional family support to old people, the support confronted by formidable foes of demographic change and modernization? How to supplement it with formal systems without damaging the family support?
• How to improve formal old age income support programs? In particular, how to increase their coverage and ensure adequacy and sustainability? How to ensure that such a scheme would not
“crowd out” other formal and informal support systems?
• How to improve healthcare and long-term care to support an aging population? How to orient health care towards the needs of old people, and facilitate continued improvements in healthy life expectancy amongst the old people? How to reorganize the system, including management of
1 Aware of the rapid aging process awaiting Sri Lanka, the National Secretariat for Elders (now part of the Ministry of Social Services and Social Welfare) in 2003-04 conducted a nationally representative survey of 11,663 persons (aged 60 years or more) and produced a rich report National Survey of Elders that provides the analysis of the survey (National Secretariat for Elders, 2004). The Sri Lankan government also recently introduced legislation mandating that adult children are responsible for the welfare of their elderly parents.
human resources, to strengthen its emphasis on primary health care, particularly the promotion and surveillance activities? How to improve the provision of long-term, institutional care of the frail, dependent old people?
• How to mitigate the slowdown of GDP growth when one of key production inputs – labor – will start shrinking in the coming years? In particular, how to promote longer working lives and improve employability of old workers, as well as improve labor market choices for those that are forced to continue working late in their lives?
4. The four main chapters of this report focus on these four critical areas in turn. Chapter 2 examines living arrangements, intergenerational transfers as well as the respect and authority old people enjoy. One of the biggest problems facing old people is lack of independent financial sources, so chapter 3 provides an analysis of formal income support programs including pensions and relevant safety net programs. Chapter 4 evaluates the health status of old people and how well placed the healthcare system is to cope with an aging population. Finally, Chapter 5 analyzes the implications of an aging labor force.
These chapters are preceded by an overview chapter that presents demographic trends that have contributed to population aging and sketches a portrait of the current old people in Sri Lanka.
5. While the report addresses the above four topics in separate chapters, it emphasizes their links and interrelated nature, confirming the need for an inter-sectoral, holistic approach. For example, family support through co-residence and income transfers to the old people are both intricately linked to the performance of the pension system. Improvements in health conditions for older workers would allow many to continue earning and postpone retirement, which in turn, could ease the pressure on pension systems and on families with increasingly fewer working age adults having to care for and support each old people member of the household. Better health, income support and the ability to choose when to retire would all contribute to better intergenerational relations and attitudes towards the old people. Therefore, when implemented in conjunction, the proposed policy measures would reinforce each other and would have an effect greater than the sum of their parts.
6. The report uses a variety of data sources, including a 2006 survey of old people in Sri Lanka. International evidence has also been included where considered relevant. In some cases, as in Chapter 3 dealing with old age income support systems, the analysis also draws heavily from other studies, often produced by Sri Lankan researchers. In other cases, the report relies on original, unpublished data from a special aging survey conducted specifically for this report and available upon request (World Bank 2006 Sri Lanka Aging Survey – SLAS, the survey based on a representative sample of Sri Lankan old people). The report defines old people as individuals over 60 years of age.
II. Key Findings
7. The demographic transition faced by Sri Lanka will be particularly dramatic. Population aging is a universal phenomenon, but it looms particularly large for Sri Lanka: not only is its population among the oldest in the non-developed world, but Sri Lanka is also one of the fastest aging countries in the world. Sri Lanka’s share of population over 60 years old in 2000 was 9.2 percent, which exceeded the average of all regions in the world except OECD countries, Eastern Europe and the former Soviet Union.
Driven by low and declining fertility and increasing life expectancy, population projections show a record fast aging process, with the proportion of those aged 60 years or more reaching almost 30 percent by 2050, with especially rapid increasing of the share of the very old.
8. Present socio-economic conditions of old people are not alarming, but some groups need special attention. Most elderly—about 80 percent—live with their children, and rely on them for financial and in-kind support. This support is not all one way. The elderly also support their children,
through child care and other support. As the population ages, an increasing share of the elderly, particularly the very aged elderly, will be women. While poverty among elderly is much lower than for the population as a whole, the incidence of poverty among the very old women (widows) is higher, and will require focused attention. Workers in the formal sector withdraw from the labor market early because of mandatory retirement ages (and because they have access to pensions), while workers in the informal sector work longer and withdraw mostly because of ill health. The prevalence of non-communicable disease among the elderly is high, a result of risk factors (obesity, diet, etc.) and a legacy of malnutrition;
and disability rates appear to have increased in the country.
9. The family is the main support of old people, but there are signs of emerging strains in the traditional support system. As in other countries, elderly who receive pensions (or have other assets) receive less informal support, relieving the burden on poor families, but are more important in household decision making. The elderly are by and large satisfied with current arrangements and expect these to continue in the future (as do their children). Will these arrangements, including co-residence rates, decline, as they did in Korea, Japan and the US? Predictions are difficult, and expectations of family based support may not materialize (e.g., Japan). However, the report finds some signs that the traditional system is under strain. Primary caregivers, mainly women, who both work and care for both children and parents, including providing support for assisted living, report considerable stress in their lives. Despite being the last resort, institutionalization of elderly has reportedly increased. Many institutionalized elderly note that demanding working lives of their children and preference for living independently were responsible for their institutionalization. There is also some evidence that, as in higher income countries, those elderly who can afford to do so prefer to live alone with their spouse. As the dependency ratio increases with aging, the burden of care on primary care givers may increase significantly. Long-term care by the family for the elderly may decline as a result, putting pressure on the health care system.
Alternatively, if families continue to provide care, this may well impose opportunity costs for care givers in terms of forgone labor market participation. Support to families taking care of an increasing number of elderly over a longer period of time through cost effective community based social care services and income support (pensions, safety nets) for the elderly, may be required. This option is largely non-existent in Sri Lanka today. Particular attention will be needed to ensure adequate safety nets and social care services are targeted to aged and widowed women who appear the most vulnerable population group among the elderly.
10. Formal old age income support systems have limited coverage, inadequate benefits and are financially unsustainable. Formal income support systems help workers smooth income over their lifetime. Although Sri Lanka provides the most comprehensive social security system in South Asia, the coverage of current schemes is limited to minority of the working age population, the benefits are inadequate, and the financial sustainability of schemes questionable. First, pensions are received by less than one-fifth of the old people and only one-third of the labor force participates in pension scheme, with the vast majority of informal sector workers lacking coverage and considerable evasion among those in the formal sector. Second, civil servants are the only group that has reasonable levels of benefits and longevity insurance but costs may be unsustainable in the long run. The Employees’ Provident Fund provides insufficient benefits due to low investment returns, a low pensionable age, and the lump sum payout that does not offer longevity insurance (for outliving one’s savings). Fourth, population aging renders both formal and informal sector schemes fiscally unsustainable, or sustainable only if they pay inadequate pensions. Third, without means of transferring income from their working years in the informal sector to retirement, the elderly must rely on family support or very low benefits from the social assistance programs. The report indicates that elderly without income in old age have limited bargaining power in the household and very little influence over decisions that affect their lives. The aging of the population means that options to provide financially sustainable formal income support to complement family support will require considerably more attention.
11. Health systems are not ready to address the needs of an aging population. The coverage of Sri Lanka’s health system is extensive. The country also has a strategy to address non-communicable disease-based on prevention, including the promotion of healthy lifestyles. However, risk factors noted above remain important (some are comparable or higher than in developed countries). The treatment of non-communicable disease is outdated and relies on under-financing and under-treatment of cases. It has not taken advantage of the emergence of less costly medication. Population aging may increase current outlays to meet future needs (in complement with improved efficiencies in the system). This report estimates that, given current trends and expenditure patterns, population aging itself may add up to 1 percent of GDP by 2050, not including health awareness and demand likely having as large an impact, increasing costs by additional 0.5-1.5 percent of GDP. Separately from measures trying to control the costs of services, public delivery systems are not suited to address the needs old people. Health systems do not provide continuous or integrated care for the elderly that allow systematic screening for illness or disability, and many elderly patients who require secondary prevention do not receive it. Evidence from developed countries shows that increase in elderly population, if accompanied by prevention and active care of non-communicable diseases (NCDs), need not increase the burden of disease. While there are some pilots in progress to address active aging, resources are scarce, and an overall strategy for health in the context of aging has not been developed.
12. The number of working age population will decline and—all else equal—may reduce growth. A vast majority of old workers are self-employed or casual workers engaged in the informal sector and work full-time: skilled workers in agriculture, manufacturing, and wholesale and retail trade.
Few are unemployed. Older workers generally fall into two categories—those that work until very old age (or death—even in the family, caring for grandchildren) due to poverty and the lack of pension income, and those that stop working earlier than they would like due to poor health (especially casual workers and the self-employed) or rigidities in the labor market including early retirement ages (especially civil servants and regular workers in the formal private sector). Are there constraints to the employment of older workers? Wages for older workers are lower than for younger ones, indicating that wages are not a constraint to hiring older workers. While there is some evidence—consistent with findings in developed countries—that strict employment legislation may reduce hiring of old workers, it is not conclusive. In OECD countries, work stress (related to poor working conditions) and lack of training/skills are factors that may well reduce employment of older workers, and these may be important for Sri Lanka as well.
Better understanding of these issues will be important for designing policies to foster employment of older workers as one measure to counter the decline in the labor force.
III. Key Policy Recommendations
13. The aging of the population does not have to imply slow down in growth as long as measures are enacted to boost labor productivity, increase labor force participation, or both. Aging also need not have a large impact on public spending of health and pension systems, or impose a huge burden on families if appropriate policy measures are taken in advance.2 The report suggests the following key policy actions that could help mitigate the potential adverse impact of aging in the country (see summary of policy recommendations in a table below). Given the interlinkage between these measures, the report recommends an integrated action plan focusing on these four areas for addressing aging in Sri Lanka.
2 While outside the scope of the study, the impact of population aging on education spending has two potentially offsetting effects. The declining size of school-age population is likely to reduce public spending on education. On the other hand, efforts to improve the quality of the system, the increased outreach efforts towards those who drop out early from the system, and the promotion of life-long learning, may raise public spending on education.
14. Supporting informal care arrangements. To help sustain informal support, as well as to complement it with necessary additional components, the report suggests the following: First, introduce or expand social welfare and care services targeted to the most vulnerable, and provide community- and home-based support services for the sick and frail old people. Through such approaches, the country can reduce the demand for expensive institutional care, reduce burden on caregivers and enable the old people to continue to live in their home/community. Second, increase the capacity of nursing homes to care for old people. Although institutionalization is regarded as a last resort by old people, the demand for such facilities will rise in line with the reduced probability of the provision of support by children, increasing demands of formal sector employment, and, possibly, future changes in value systems. Finally, improve income support programs and health services (see below) to the old people so that they can continue to contribute to the household welfare. Such policies could ease the increased strain on multigenerational households arising from the decline in the ratio of working age members to the old people in the household, as well as the strain on the informal mechanisms created by modernization (see below).
15. Strengthening formal income support for elderly. A coherent policy for income support for the old people would begin with a predetermined set of objectives for the two functions of the pension system – providing a minimum income and smoothing consumption. Other guiding principles include: (i) differentiation of benefit eligibility and benefit levels for old people under broader social assistance program, and improving targeting of the Samurdhi program to allow for higher average benefits; (ii) integrating the consumption smoothing schemes for private and public sector workers for full portability, and equalizing retirement ages and replacement rate targets. This includes the introduction of contributions for civil servants; (iii) integrating schemes for informal sector workers to ensure full portability while allowing for more flexible contribution levels and periodic payments under a unified recordkeeping platform; (iv) encouraging the expansion of coverage by fiscal incentives in the form of targeted matching contributions; (v) facilitating or mandating a shift from lump-sum payouts to income streams either through annuitization or scheduled withdrawals; and (vi) establishing an overarching investment policy framework that would shift funded schemes away from government bonds and towards more diversified portfolios (and therefore, higher risk-adjusted rates of return).
16. Re-orienting the health system to respond to an aging population will require developing a health system that enables Sri Lankans at all ages to achieve healthy aging, minimizing the costs of the health system to the economy, and reducing out-of-pocket catastrophic health expenditure. To achieve these goals, the report provides detailed recommendations, including: (i) strengthening health promotion and prevention to reduce the potential years of life lost in premature mortality as well as to ensure better quality of remaining life in the old people; (ii) integrating management of primary prevention and primary care for the old people using the maternal and child health network of the Ministry of Health for geriatric assessment, prevention, and rehabilitation. If services are appropriately staffed and proper equipment is provided, management of chronic diseases at primary care level is more cost-effective than outpatient hospital care or inpatient care; (iii) expanding the health information system to deliver the information and evidence required to support and monitor the responses to aging; and (iv) promoting productivity change in public sector health service delivery, to contain the expenditure of the healthcare system, but increase public healthcare expenditures in line with current commitments to reduce the shift in patients demand to the more expensive private sector.
17. Countering labor force declines by improving employment, productivity, and choice. In the light of the prospects of shrinking labor force, policy recommendations thus include actions to increase labor market supply, labor productivity, and the choices of old people:
• First, increasing participation rates, particularly of women but also of old workers – those that are currently forced to retire early. To increase labor force participation of old workers, labor market rigidities should be reduced, including inflexible retirement ages that force healthy older workers
out of the formal labor markets before they would otherwise choose. These policies could effectively counter the effects of population aging on labor supply – for example, simulations show that the increase of women’s participation rate by 20 percent could delay the reduction of labor force by 15 years. The introduction of family-friendly employment policies (including increasing part-time/flexible working opportunities) would also be helpful, as would complementary policies aimed at reducing their burden as primary care givers to old persons (see above). More work is needed to examine obstacles for employment of old workers (inflexible labor laws, etc.) and to determine whether have employers’ negative perceptions about the adaptability and productivity of older workers create work disincentives for old workers, and how important an obstacle is weak employability of old workers – and if so, what should be done about it.
• Second, improving the productivity of the labor force would help in boosting economic growth, another factor countering the taxation effect of population aging on growth. While improving productivity requires action on several fronts, three suggested by this report include (i) improving skills of older workers to help them improve their employability, through investment in life long learning; (ii) promoting formalization of the economy – for example, upon making the labor market more flexible and less restrictive, so that workers could shift towards better, more productive jobs, and, at the same time, jobs that offer improved social security; and (iii) improving health outcomes for informal sector workers is a complementary policy would help them to increase their earning capacity, thus reinforcing the above recommendations in the area of health.
• Finally, improving the choices of old workers. Formal sector workers withdraw from the labor market early because of early retirement ages (and because they have access to pensions), while the lack of resources forces many informal sector workers to work much longer and withdraw from the labor market mostly because of ill health. Providing old people with an independent source of income would therefore significantly improve old peoples’ choices, the fact underscoring the need to extend the coverage of old age income support systems.
18. Investing in a healthy and productive aging is essential for reducing the burden of aging in Sri Lanka. The policies noted above will need to be finalized carefully, with involvement of several line ministries, given their inter-sectoral linkages, In most cases, these policy changes would have to be phased in gradually, and they would take several years or even decades to implement in any case. The fiscal costs of these policies will also need to be carefully analyzed to ensure their overall sustainability.
Given the speed of the population aging over the next two decades, delays in action are likely to prove costly. In order to avert an aging crisis in Sri Lanka, preparations to address aging will have to begin sooner rather than later: inaction is not a viable alternative.
Summary of Policy Recommendations: Investing in Healthy and Productive Aging is Essential for Reducing the Burden of Population Aging in Sri Lanka
Supporting and Complementing Informal Care Arrangements
• Introduce/expand social welfare and care services targeted to the most vulnerable.
• Provide community- and home-based support services for the sick and frail old people.
• Improve income support programs as well as health services to the old people so that they can continue to contribute to the household welfare.
• Increase the capacity of nursing homes to care for old people.
Strengthening Formal Old Age Income Support
• Determine key parameters of the system: the minimum income and the targeted replacement rate.
• Improve social assistance programs (including Samurdhi) delivery to old people by increasing benefit levels and tightening eligibility rules.
• Harmonize and integrate retirement schemes for private and public sector workers (above all, equalize retirement ages and replacement rate targets).
• Integrate schemes for informal sector workers to ensure full portability while allowing for more flexible contribution levels and periodic payments under a unified recordkeeping platform.
• Encourage the expansion of coverage by fiscal incentives such as targeted matching contributions.
• Facilitate or mandating a shift from lump-sum payouts to income streams either through annuitization or scheduled withdrawals.
• Establish an overarching investment policy framework that would shift funded schemes away from government bonds and towards more diversified portfolios.
Re-orienting the health system to respond to an aging population
• Strengthen health promotion and prevention to reduce the potential years of life lost in premature mortality and to ensure better quality of remaining life of old people.
• Integrate management of primary prevention and primary care for the old people using the maternal and child health network of the Ministry of Health for geriatric assessment, prevention, and
rehabilitation.
• Expand the health information system to deliver the information and evidence required to support and monitor the responses to aging.
• Promote productivity change in public sector health service delivery, to contain the expenditure of the healthcare system, but increase public healthcare expenditures in line with current commitments to reduce the shift in patients demand to the more expensive private sector.
Countering labor force declines by improving employment, productivity, and choice
• Increase participation rates of old workers (as well as women and young workers) by adjusting inflexible retirement age rules and by stimulating part-time/flexible employment arrangements.
• Improve the productivity of the labor force by improving skills of older workers (life long learning); by promoting formalization of the economy (for example, less restrictive employment protection
legislation would help workers to shift to better and more productive jobs that, at the same time, offer improved social security); and by improving health of workers.
• Enhance choice of old workers by making retirement rules more flexible; by providing old people – particularly those who are forced to work in their later years – with independent source of income; and by improving the health of workers so that they could stay employed if they wished.
1. DEMOGRAPHIC TRENDS, THE PROFILE OF OLD PEOPLE, AND THE EMERGING ISSUES
Population aging is a universal phenomenon, but it looms particularly large for Sri Lanka: not only is its population among the oldest in the non-developed world, but Sri Lanka is also one of the fastest aging countries in the world. Sri Lanka’s share of population over 60 years old in 2000 was 9.2 percent, which exceeded the average of all regions in the world except OECD countries, Eastern Europe and the former Soviet Union (Figure 1.1). And population projections show a record aging of population: in 2050, the share of Sri Lankan population over 60 years old is projected to reach 28.5 percent, an increase in comparison to 2000 matched by very few countries.3
Figure 1.1: Demographic aging, Sri Lanka and world regional averages (percentage of population over 60 years old, 2000-2050)
0 5 10 15 20 25 30 35
2000 2010 2020 2030 2050
Percent
S ri La nka As ia OEC D La tin Am e ric a a nd C a ribbe a n Ea s te rn Euro pe a nd fo rm e r S U M iddle Ea s t a nd No rth Afric a S ub-S a ha ra n Afric a
1.1 This chapter probes into the demographic factors that explain the aging of Sri Lanka’s population, and sets out the broad challenges confronting the country. Its first section details the demographic challenge faced by Sri Lanka by summarizing the future demographic trends and discussing its two main drivers: falling fertility and increasing longevity. The next section sketches a portrait of the current population of old people in Sri Lanka, summarizing their social characteristics and reviewing their socio-economic conditions. Based on these building blocks, the third section highlights the key challenges emerging in each of the four areas focused upon by the report: informal support for old people, old age income support, healthcare of old people, and the labor market. The annex to the chapter provides a description of the World Bank 2006 Sri Lanka Aging Survey, a special aging survey conducted specifically for this report.
3 One of the few countries with a similar projected increase of the share of old people is China – a country where government has been actively involved in limiting the number of children families may have and where UN projections show an increase from 10.1 percent in 2000 to 31.1% in 2050.
Source: De Silva (2007), for Sri Lanka; World Bank (1994), for other
A. DEMOGRAPHIC TRENDS
1.2 Sri Lanka’s population was enumerated at 18.7 million in the 2001 census, and will increase modestly to 21-23 million by 2020-2030, before beginning to decline (de Silva, 2007).
Projections show that the era of continuous population growth will soon be in the past. Sri Lanka will experience a contracting population from the fourth decade onwards (Figure 1.2), comparable to the situation in Japan today, assuming fertility rates continue at low levels (Figure 1.3, see discussion below) and in the absence of substantial inward migration.
1.3 The main driver of the slowing momentum of population growth has been rapid fertility decline since the 1950s. The total fertility rate (the number of children that the average woman will bear during her lifetime) fell below the replacement level of 2.1 by 1994. It has continued to fall, reaching 1.7- 1.9 currently, paralleling experience in several countries of East Asia (Japan, Korea, Taiwan, Thailand), and it is already lower than in certain developed countries with high birth rates, such as the USA.
1.4 Increasing life expectancy is the next most important driver of Sri Lanka’s population aging, with life expectancy already higher than in some OECD economies. Sri Lankans are living longer, helped by investments in human development—health and education, resulting in an increasing proportion of Sri Lankans living to an advanced age. On present trends, life expectancy will reach the current average OECD level of 77.8 years by 2050 (OECD, 2005). However, a critical aspect of life expectancy trends in Sri Lanka is that male adult life expectancy has stagnated since the 1970s, even whilst female life expectancy has rapidly increased. The population projections assume that in future male life expectancy will keep pace with improvements in female life expectancy (Figure 1.44), but if it does not, the old people will be even more a predominantly female population than they are set to be already.
1.5 Central to Sri Lanka’s demographic aging will be an increase in the share of the old people in the population, with an increase in the proportion of the old people who are very old. The share of the population aged 60 years and more will increase from 11% currently to 16% in 2020 and 29% by 2050, before peaking at 34% in 2080. At the same time, there will be a process of aging of the old people, as the oldest old people aged more than 80 years, who are the ones most likely to be frail and dependent, will increase from one tenth of the old people population to almost one third. By 2050, the 80+ year age group will account for more than 5% of the overall national population (Figure 1.5).
1.6 The increase in the numbers of old people and reductions in the youngest age groups will change Sri Lanka’s age structure from the pyramidal structure typical of most developing countries to a flat pillar shape similar to that evolving in the most developed countries today (Table 1.6). This process will largely be complete by 2050. What can also be foreseen is that because of the decline of the fertility rate below replacement level in the early 1990s, there each age cohort born after the late 1990s may be smaller than the preceding one, resulting in a narrowing at the base of the age structure, which is already apparent today
3
Figure 1.2: Sri Lanka’s population, 2001-2100 Figure 1.3: Projected trends in total fertility, Sri Lanka 2001-2100 0.05.0
10.0
15.0
20.0
25.0 20012011202120312041205120612071208120912101
Po pu latio n (m illion s)
Low Standard High0.0
0.5
1.0
1.5
2.0
2.5
2001-2006 2011-2016 2021-2026 2031-2036 2041-2046 2051-2056 2061-2066 2071-2076 2081-2086 2091-2096
T o ta l fert ility ra te
High Standard Low Source: De Silva (2007) Source: De Silva (2007) Figure 1.4: Projected trends in life expectancy by sex, Sri Lanka 2001- 2100 Figure 1.5: Share of the old people age groups, Sri Lanka 2001-2100 6064687276808488
2001-2006 2011-2016 2021-2026 2031-2036 2041-2046 2051-2056 2061-2066 2071-2076 2081-2086 2091-2096
Life expectancy at birt h (y ears)
MaleFemale5.37.39.410.612.213.713.313.913.112.012.22.9
3.5
5.2
7.0
8.2
9.811.311.312.1 11.710.8 1.0
1.3
1.8
2.8
4.0
5.0
6.57.98.6 9.69.8 05
10
15
20
25
30
35
40 20002010202020302040205020602070208020902100 Years
P er c en ta g e o f p o p u la tio n (
% )
60-6970-79+80 Note: Life expectancy assumptions in the mid-range standard projection
4
Figure 1.6: Changes in age structure of Sri Lanka’s population 2007-2075 2007 654321012345
0-4
10-14
20-24
30-34
40-44
50-54
60-64
70-74
80+ Population (%)
Male Female
2050 654321012345
0-4
10-14
20-24
30-34
40-44
50-54
60-64
70-74
80+ Population (%)
Male Female 2025 654321012345
0-4
10-14
20-24
30-34
40-44
50-54
60-64
70-74
80+ Population (%)
Male Female
2075 654321012345
0-4
10-14
20-24
30-34
40-44
50-54
60-64
70-74
80+ Population (%)
Male Female Source: De Silva (2007)
1.7 These changes will result in a rapid increase in the dependency ratio starting in slightly over a decade (from 2020). Although the old age dependency ratio (proportion of population aged 60 years or more versus the proportion aged 15-59 years) has been increasing in recent decades, there has been a corresponding fall in the child dependency ratio (proportion of population aged less than 15 years versus the proportion aged 15-59 years). The two trends will roughly balance until 2025, implying that some of the increase in social costs in aging might be met by savings in the need for investments in children.
However, from 2025, the total dependency rate will begin to increase rapidly from 55% to reach more than 75% by the middle of the century (Figure 1.71.7). This change in the dependency ratio has important implications for policies as noted below.
Figure 1.7: Trends in dependency ratios, Sri Lanka 2001-2101
26% 29%
37%
63%
50%
16%
93%
76%
54%
0%
10%
20%
30%
40%
50%
60%
70%
80%
90%
100%
2001 2011 2021 2031 2041 2051 2061 2071 2081 2091 2101
Percentage of population
Child dependency Old age dependency Total dependency
Source: De Silva (2007) Forecasting the Future Fertility Trend
1.8 The future fertility trend is the most difficult to forecast. The population projections used in this study, De Silva (2007), assume that fertility will continue to fall for the next two decades to a forecast range of 1.3–1.7, before beginning to recover upwards to reach a range of 1.5–2.1 towards the end of the century (Figure 1.3: 3). However, this is inherently speculative, and the recent experience of European and Asian societies shows that fertility has continued to fall to previously unimaginable levels of 1.3-1.4, but in only some has there been a rebound to higher levels. Even in the latter, fertility has rarely reached replacement level.
1.9 The phenomenon of low fertility (below replacement level) is a recent phenomenon, which started in Europe at the end of the 1960s, but is now most marked in advanced East Asian economies. Almost thirty countries have what are termed “very low fertility” rates, defined as less than 1.5 births per woman. Although declining fertility was originally seen as a common feature of advanced industrialized nations, it has become increasingly clear that very low fertility is not universal in all high- income economies, and that there are clear differences between countries. In particular, very low and persistent fertility is a particular feature of two groups of countries (Figure 1.81.8): (i) predominantly Catholic, southern European nations such as Spain and Italy, and (ii) East Asian societies such as Japan, Korea, Taiwan, Hong Kong SAR and Singapore. In these societies fertility has continued to fall to about 1.3, and has dipped below 1.2 in some (Korea, Taiwan, Singapore).
Figure 1.8: Fertility trends in low fertility countries and Sri Lanka
0.0 1.0 2.0 3.0 4.0 5.0
1970 1975 1980 1985 1990 1995 2000 2005
Total fertility rate
Korea Japan Germany Italy Spain Poland Sri Lanka
Source: Cho (2006)
1.10 There are reasons to anticipate that fertility in Sri Lanka may follow a similar trajectory to East Asian countries, such as Korea and Japan. In developed countries, fertility decline has been driven partly by the availability of contraception, and changing norms about the ideal number of children.
In addition, socio-economic changes, such as increasing education of women and increased female labor force participation, have led to increased age at marriage and reduced marital fertility. These factors have also been present in Sri Lanka. However, in some OECD countries, such as UK, France and USA, this has been accompanied by dramatic changes in social norms, which can be termed a sexual revolution, in which child-birth outside marriage has become common, and in some cases accounts for half of all births (Cho, 2006). In the very low fertility OECD economies, such as Korea, Japan and Spain, social norms have not changed in this way, and the marital fertility rate has dominated fertility decline. It is also thought that the strong antenatal policies pursued by Asian governments in the 1970s may have inculcated today’s younger adults with norms encouraging low fertility. Given that social norms in Sri Lanka may be more akin in these respects to Korea and Japan than they are to the USA and UK, it is possible that as the economy develops fertility will fall to and persist at levels as low as they are now in these Asian countries. In summary, there exists considerable uncertainty over the future trend in fertility, because global experience of such low fertility levels is limited to the past few decades and a few countries.
B. SOCIO-ECONOMIC CHARACTERISTICS OF OLD PEOPLE
1.11 To understand how population aging will affect future generations of old people and economic growth in general, it is useful to review key socio-economic characteristics and conditions of the current generation of old people in Sri Lanka.
1.12 Gender composition and marital status. Among old people, there is a large share of women and widows. The old people aged over 60 years numbered 2.1 million in 2006, representing 10.6 percent of the population, The female share of the old people is higher than male, owing to the increased life expectancy of women compared to men since the 1960s. The female share increases with advancing age, from 53% in the 60-64 year age group, to 60 % in the 70-74 year age group to almost 70% in those aged
over ninety years (Figure 1.9). At the same time, the likelihood of being a widow also increases with age, so that the majority (66%) of the oldest old people (>80 years) are widowed, compared with only 29% of the young old people (Figure 1.101.10).
Figure 1.9: Numbers of old people by sex and age, 2006
53%
53%
58%
56%
58%
59%
69%
- 100,000 200,000 300,000 400,000 500,000 600,000 700,000 800,000
60-64 65-69 70-74 75-79 80-84 85-89 90+
Age groups (yea
Male Female
S i 3
Source: Estimated using results of: World Bank 2006 Sri Lanka Aging Survey and de Silva (2007).
Note: Percentages indicate percentage of each age group that is female.
Figure 1.10: Marital status of old people, 2006
68%
74% 70%
58%
50% 45%
32% 34%
29% 22%
25%
40%
46% 54%
66% 66%
0%
20%
40%
60%
80%
100%
60-74 60-64 65-69 70-74 75-79 80-84 85-89 90+
Years
Married Widowed Divorced/Separated/Never married
Source: World Bank 2006 Sri Lanka Aging Survey (2007).
1.13 Residence. As in most developing countries co-residence rates are high in Sri Lanka. Almost 80 percent of old people live with their children, and many rely on their children for financial and other support. Only 6 percent of elderly live alone. Most elderly also reside in rural areas and in the more developed regions of the country. According to the results of the SLAS, 80 percent of the old people lived in rural areas, compared with 13 percent in urban areas and 6 percent in the estate sector. The results of the 2001 national census indicate that the old people share is highest in Western (9.9%) and Southern
Provinces (11.2%), and lowest in North-Central Province (6.5%) and Uva (7.4%). The explanations for this pattern may lie in the higher fertility levels seen in the poorer provinces and possibly in the higher life expectancy of those living in the more developed areas.
1.14 Poverty profile. Poverty does not affect old people disproportionately more than the population as a whole, but the incidence of poverty among the very old is large, and it affects more old women than men. According to 2002 data form the household income and expenditure survey, the total rate of poverty in Sri Lanka was 22.7 percent, and among the old the poverty rate was significantly below that and only for the people older than 85 it approached the national average (Figure 1.11).4 In contrast, the poverty rate among the young was above the national average, and for the group of 5-14 olds it amounted to 30.8 percent. According to Gamiratne et al, (2004), old women are more likely to be poor than old men – women aged 70-79 were about 5 percentage points more likely to be poor than men in that age group (interestingly, the poverty statistics for 60-69 year olds were about the same for men and women). Note that the above results assume that resources are shared equally within the household, irrespective of gender and age, and that some empirical studies have found that men tend to consume more their a proportional share.
Figure 1.11: Poverty incidence by age groups (2002)
0 5 10 15 20 25 30 35
Total Below 5
5-14 15 - 24
25 - 44 45 - 54
55 - 64 65-74
75-84 85 and abov
e
Source: Own computations, based on HIES 2002.
1.15 Health profile. Overall health indicators for Sri Lanka’s population are better than for almost all low and low-middle-income countries, with life expectancy and mortality rates comparable to some of the poorer OECD countries. However, overall positive life expectancy trends mask important differences in gender. Female adult life expectancy has continued to increase, but male older adult life expectancy has largely stagnated, resulting in men living eight years on average less than women. The failure to improve older adult mortality has been due primarily to increasing mortality in older adults from non-communicable disease, particularly ischemic heart disease (IHD), strokes and diabetes. Also worrisome, the disability rates in the old people in Sri Lanka are not declining, as they are in most developed countries. The rates of blindness, and disability in limbs, hearing and speaking generally rose in Sri Lanka (but blindness in the young old people decreased)5. Thus, as in all countries, old people are
4 It has to be emphasized that a similar poverty profile by age cohort emerges even if poverty rates are calculated by adjusting household income per capita for the age composition of families (Gaminiratne et al, 2004). Poverty is based on an absolute poverty line of Rs. 1,423, corresponding to the per-capita consumption expenditure providing nutritional intake of 2030 kilocalories (Department of Census and Statistics 2004).
5 Though somewhat contrary to this finding, the self-assessed health ratings of old people did not change between 1991 and 2006.