January 23, 2007
Document of the World Bank Report No. 36568-LK
Sri Lanka
Poverty Assessment
Engendering Growth with Equity: Opportunities and Challenges
Poverty Reduction and Economic Management Sector Unit South Asia Region
Report No. 36568-LK Sri Lanka P o verty Assessment Public Disclosure Authorized Public Disclosure Authorized Public Disclosure Authorized Public Disclosure Authorized
Table of Contents Preface
Acknowledgements Executive Summary 1.
2. Poverty, Inequality and Vulnerability 3.
The Sri Lankan Economy in an Inlernational Context: Achievements and Challenges A Profile of Poor Households and Lagging Regions
vii viii ix - xxi
I
9
24
40
List of Tables
Table I : Health outcomes by wealth quintiles and sector Table 2: Selected provincial indicators, 2003-04
Table 3: Key findings, implications and knowledge gaps Table 1-1 : Agricultural productivity growth, 1990-2000 Table 1-2: Selected infrastructure indicators, 2000-03 Table 1-3: Gross tertiary enrollment rate, 1997-2003 Table 1-4: Net foreign direct investment, 1980s-2000s Table 1-5: Burden of interest payments, 2003
Table 2-1: Poverty trends in Sri Lanka
Table 2-2: Poverty and population share by province, 2002 Table 2-3: Poverty headcount by districts
Table 2-4: Share of each province in GDP Table 2-5: Mean real per capita consumption
Table 2-6: Inequality: Gini coefficient of per capita expenditure
Table 2-7: Growth in mean per capita real consumption, 1996-97 to 2003-04 Table 2-8: Total change in real per capita income, 1996-97 to 2003-04 Table 2-9: Decomposition of Theil Inequality index
Table 2-10: Projected poverty headcount in 2015 Table 2-1 1: Average annual percent growth per capita
Table 3-1: Distribution of employment status of household heads
Table 3-2: Poverty headcount rates by employment status of household heads Table 3-3: Poverty headcount by employment status of youth (IO to 20 years of age) Table 3-4: Poverty headcount by industry where household head is employed, 2002 Table 3-5: Poverty headcount ratios by educational attainment of household heads Table 3-6: Welfare indicators in Colombo City
Table 3-7: Poverty indices and access to infrastructure by province Table 3-8: Sectoral shares and inequality measures by province
Table 3-9: Poverty and educational attainment of household heads by province Table 3-10: Poverty and share of paid employees in the agricultural sector by province Table 4-1: Correlation of size of recent migration into Colombo City
Table 4-2: Estimates of poverty headcount ratio in Colombo City Table 4-3: Ratio of remittance to consumption expenditure, 2002 Table 5-1: Selected indicators, Sri Lanka and other countries Table 5-2: International comparison of health expenditures, 2002
Table 5-3: Child nutrition and health status, by wealth quintiles and by sector, 2000 Table 5-4: Women’s nutritional status by wealth quintiles and by sector
Table 5-5: Net enrollment rates by income quintile, 1995-96 Table 5-6: Mastery skills at grade 4, 2003
Table 5-7: Key educational indicators, 2002
Table 6-1: Household distribution and poverty rates by sector and province, 2002
Table 6-2: Average annual growth rate of output and share in total output value of the Agriculture, Table 6-3: Average annual growth in wage earnings by sector, 1992-2002
Table 6-4: Average yields of selected crops, 2002-04 Table 6-5: Transport facilities and rural access
Table 7-1 : Main data sources used for the analysis of the North and East Table 7-2: Labor Force Statistics (%) 2002
Table 7-3: Labor Force Statistics (%) 2004
Forestry and Fisheries Sector, 1982-2004
xi i
xv
xx
4
5
6
6
7
9
11
12
12
14
14
14
15
16
17
18
25
26
26
27
27
30
31
33
33
35
43
46
47
54
56
58
58
60
61
63
65
66
66
67
73
77
79
79
Table 7-4: Provincial GDP and population shares 1990-2003 Table 7-5: Selected social indicators
Table 8-1: Literacy rates by sector
Table 8-2: Changing pattern of housing stock in estates
Table 8-3: Selected attributes of estate households and asset index-poverty Table 8-4: Profile of migrants from estates (last 5 years before the survey) Table 8-5: Welfare of households with migrants
Table 8-6: Asset index-poverty rates List of Figures
Figure 1: Poverty headcount in Sri Lanka Figure 2: Poverty headcount by district, 2002
Figure 3: Distribution of real per capita monthly consumption expenditure (PCEXP) at 2002 prices Figure 4: Average annual growth of Gini coefficient
Figure 5: Poverty headcount by education attainment of household heads, 2002 Figure 6a: Poverty estimates for DS divisions
Figure 6b: Accessibility index at DS division level
Figure 7: Share of household heads with tertiary education by origin district, 2001 Figure 8: Provincial poverty rates within the rural sector, 2002
Figure 1-1: Poverty headcount trends in Sri Lanka, 1990-2002 Figure 1-2: GNI per capita, 1962-2002
Figure 1-3: The rank of Human Devetopment Index minus the rank of GDP per capita, 2004 Figure 1-4: Annual rates of growth and poverty reduction, 1991-2002
Figure 1-5: Average annual growth rate of Gini coefficient, 1991-2002
Figure 1-6: Annual Growth Rate of Gini Coefficient and Poverty Headcount Rate Figure 2-1 : Province and district boundaries
Figure 2-2: Percent change in headcount between 1990-91 and 2002 by district Figure 2-3: Growth-inequality decomposition between 1990-9t and 2002 Figure 2-4: Sectoral outputs and contribution to GDP
Figure 2-5: Distribution of real per capita monthly consumption expenditure (PCEXP) at 2002 Figure 2-6: Projected increases in poverty headcount due to economic shocks
Figure 3-1 : Spatial concentration of poor population
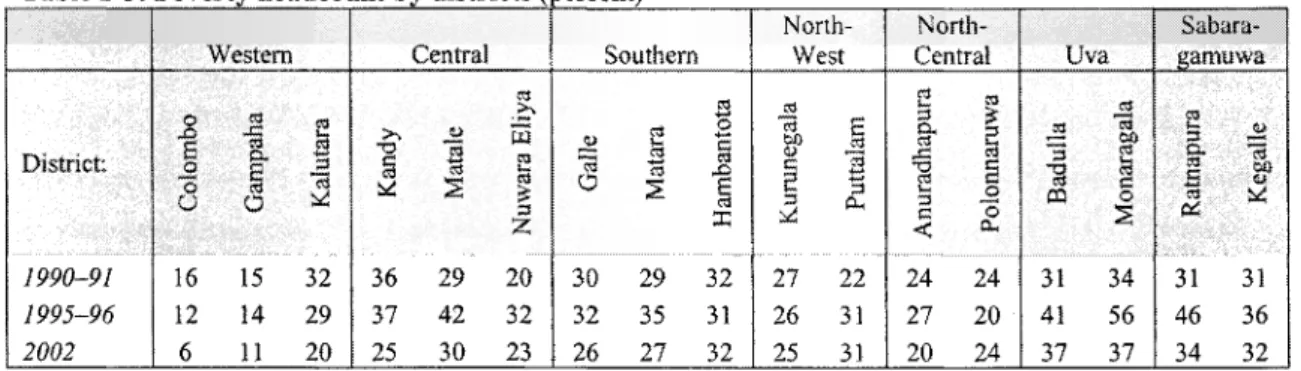
Figure 3-2: Accessibility index and average driving distance to Colombo correlated with district poverty headcounts
Figure 3-3: Proportion of housing units using electricity or gas correlated with district poverty rates
Figure 3-4: Proportion of household heads with higher education or no education correlated with district poverty rates
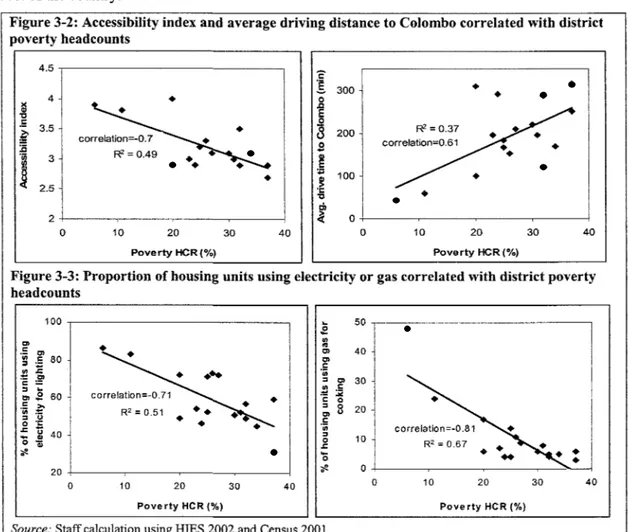
Figure 3-5: Poverty estimates for DS divisions Figure 3-6: Accessibitity index for DS divisions
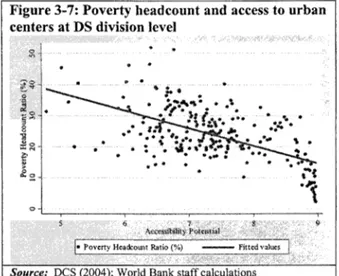
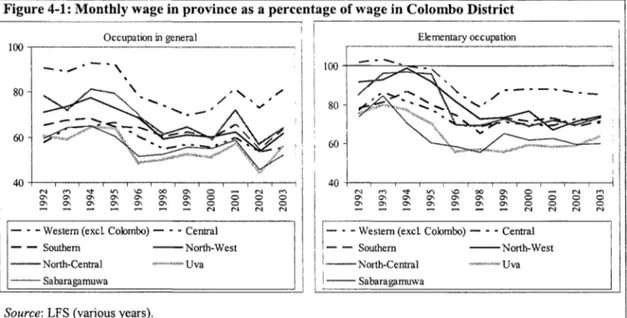
Figure 3-7: Poverty headcount and access to urban centers at DS division level Figure 4-1: Monthly wage in province as a percentage of wage in Colombo District Figure 4-2: Composition of migrants by sector of origin
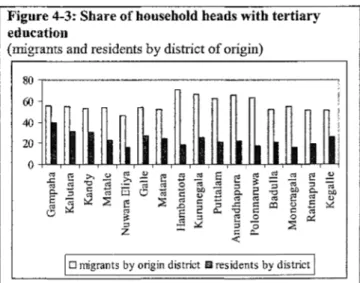
Figure 4-3: Share of household heads with tertiary education
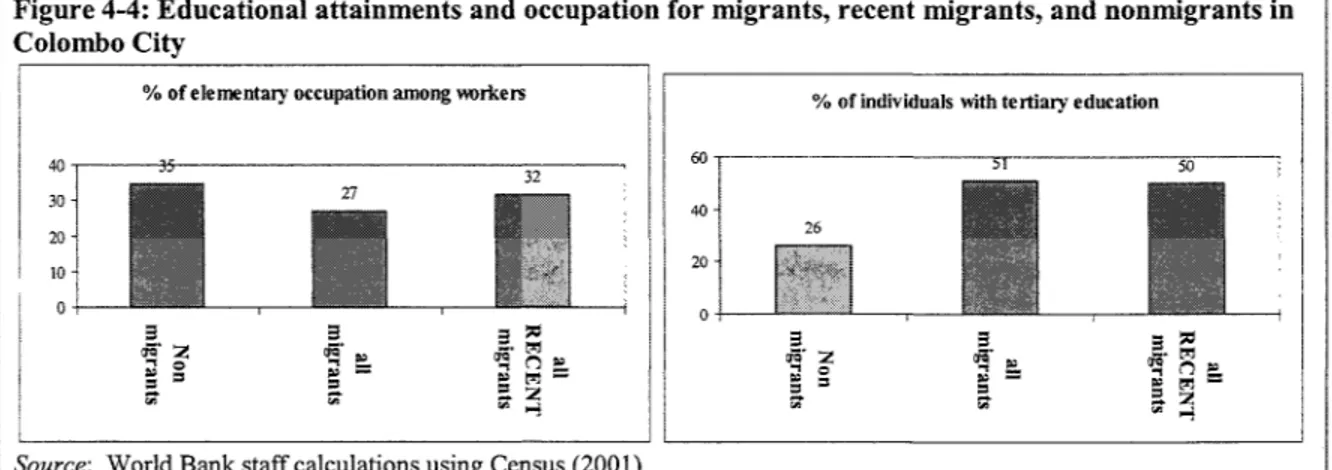
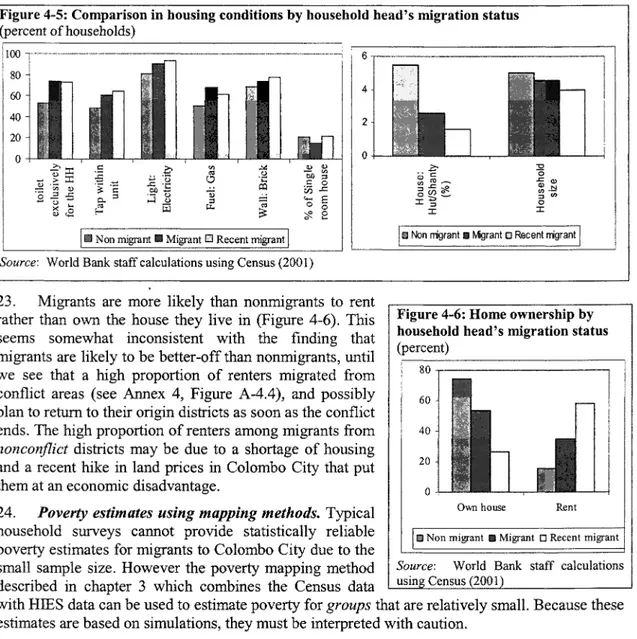
Figure 4-4: Educational attainments and occupation for migrants, recent migrants, and Figure 4-5: Comparison in housing conditions by household head’s migration status Figure 4-6: Home ownership by household head’s migration status
Figure 4-7: Percent of households with remittances by consumption quintifes Figure 4-8: Population density
prices
nonmigrants in Colombo City
81 85 90 91 92 95 96 98
ix ix xi xi i xiii xiii xiv xviii
1 2 2 2 2 3 11 12 13 17 18 19 29 32 32 34 37 37 38 41 41 43 44 45 45 46 48
X
Figure 5-1: Sri Lanka's poor do relatively better than South Asian counterparts Figure 5-2: Diarrhea is more prevalent among the poor
Figure 5-3: Private tuition usage by quintile, 2003-04
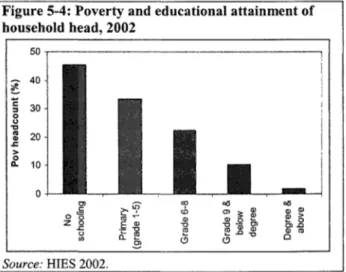
Figure 5-4: Poverty and educational attainment of household head, 2002 Figure 6-1: Distribution of population (2001) and the poor by sector, 2002
Figure 6-2: Growth in incomes (95-96 to 2002) by income groups (percentiles) for rural and Figure 6-3: Distribution of number of owned agricultural holdings and area by farms size, 1982 Figure 6-4: Constraints Rated as Major or Severe Problems by Rural Entrepreneurs
Figure 7-1 : GDP Growth 1997-2003 for North and East
Figure 7-2: One Month Mean and Nominal Expenditures (2003-04)
Figure 7-3: Food expenditures as a share (Yo) of per capita expenditures 2003/04 Figure 7-4: Education Mastery Skills of Primary School Students, 2003
agricultural households and 2002
Figure 8-1 : National identification card ownership in estates is associated with better education Figure 8-2: Income diversification is associated with lower poverty
Figure 8-3a: Primary occupation of estate population (age 15 years and older) Figure 8-3b: Monthly earnings by primary occupation of estate residents Figure 8-4: Asset index-poverty in estates by road quality
and earnings
55 59 61 62 65 66 68 72 78 80 81 85
93 94 95 96 99
Figure 8-5: Coverage of cash transfers in estates 105
List of Boxes
Box 2-1: Establishing official poverty lines
Box 2-2: Samurdhi benefits have limited impact on households
Box 2-3: How to improve Samurdhi targeting-a formula-based approach Box 3-1: Underserved or poor settlements in Colombo City
Box 4-1 : Mitigating excessive urban concentration: theory and cross-country experiences Box 5-1: Is public healthcare in Sri Lanka propoor and efficient?
Box 5-2: Impact of malnutrition on schooling and earnings Box 5-3: Nutritional status is responsive to income
Box 7-1: Island-wide Vulnerability Study by the World Food Program
Box 7-2: Vulnerability and Poverty Profiles (VPPs) of Villages in the North and East Box 8-1: What factors determine possession of NlCs in estates?
Box 8-2: External emptoyment as a means to achieve economic mobility Box 8-3: Access to and quality of health facilities in the estates
Box 8-4: Improvements in sanitation and health in the last 15 years: Key informants' perspectives Box 8-5: The negative consequences of alcoholism in the estates
Box 8-6: Perceptions on management and trade unions in the estates
Box 8-7: Perceptions about changes in communities and households over last 15 years
10
20
21
30
51
57
60
61
83
84
92
93
100
100
101
102
103
Preface
Since 2003, the Department of Census and Statistics (DCS) in Sri Lanka and the World Bank have been working together to improve methodologies and analytical tools for measuring and analyzing poverty.
This included developing an official poverty line and creating a poverty mapping system using small-area estimation techniques and Geographic Information Systems. This report uses these analytical tools as well as qualitative and quantitative research conducted in Sri Lanka and the broader development community to take a closer look at the trends, patterns and determinants of poverty, with particular focus on lagging regions and sectors. In many of these areas, the report extends and updates the analysis conducted for the World Bank’s Poverty Assessment for Sri Lanka 2002.
The report has been prepared in coNaboration with DCS, particularly on topics related to measurement of poverty and its correlates and poverty mapping. The analysis is primarily based on national data sets from the Household Income and Expenditure Survey (HIES), the Demographic and Health Survey and Labor Force Survey (LFS) for different years conducted by DCS, and the Consumer Finances and Socio Economic Survey (CFSES) for different years conducted by the Central Bank of Sri Lanka. These data were supplemented by a qualitative study and household survey of the estate sector conducted by the Centre for Poverty Analysis and the Sri Lanka Business Development Centre, respectively. Notably, the poverty estimates in this report exclude the conflict-affecfed North and East, since HIES data necessary for measuring poverty is not available for this region. A chapter focusing on economic and social outcomes in the North and East provides an overview of the evidence available for this region from alternative data sources, including the CFSES, LFS and smaller surveys by private agencies.
The report is intended to add to the debate and understanding of poverty and inequality in Sri Lanka.
Acknowledgment of the slow and uneven pace of growth and poverty reduction across regions in Sri Lanka features prominently in the President’s election manifesto, the Mahinda Chintana. The Chintana explicitly addresses regional inequalities in incomes, human development outcomes, and access to economic infrastructure. The 2007 Budget includes measures to strengthen links between emerging policy priorities articulated in the Chintana and initial steps toward the creation of a medium-term budget framework.
While the available data sources provide significant insights into poverty issues, the analysis is somewhat
limited by the absence of a regular integrated household survey, like the Living Standards Measurement
Surveys conducted in many developing countries. In the absence of an integrated survey, information
from different sources were combined and recent innovations like poverty maps were used to draw
insights about the causes and determinants of poverty. The DCS is currently introducing changes to the
HIES to cover a wider range of topics critical to assessing a household’s well-being, which will greatly
enhance poverty analysis and its ability to inform policy in the future.
Acknowledgements
This report was prepared by Ambar Narayan, Princess Ventura (Task Managers) and Nobuo Yoshida from the Poverty Reduction and Economic Management (PREM) unit of the World Bank’s South Asia Region, drawing upon significant contributions from Nistha Sinha (health), Kirthisri Rajatha Wijeweera (education), Mona Sur and Dina Umali-Deininger (rural poverty), Muttukrishna Sarvananthan (North and East) and Aphichoke Kotikula (estates). The analysis of poverty using data from numerous surveys and the Population Census produced by the Department of Census and Statistics (DCS) was conducted in partnership with the DCS. In particular, the team is grateful to Wimal Nanayakkara, Suranjana Vidyarathne, G. Y. L. Fernando, and K. G. Tillakaratne (DCS) for valuable advice and contributions to the analysis. The report was edited by Hedy Sladovich (World Bank). Research assistance was provided by Fei Gao and Gozde lsik (World Bank). Oxana Bricha, Prameela Namasivayam and Malathi Ratnayaka (World Bank) provided able assistance in handling logistical and contracting arrangements for the report, and Thelma Rutledge (World Bank) prepared the report for printing.
The peer reviewers are Anila Bandaranaike (Director, Statistics, Central Bank of Sri Lanka), Gershon Feder and Linda Van Gelder (World Bank). The team is grateful to Tara Vishwanath (World Bank) for overall guidance on the report and design of the Estate household survey, as well as detailed comments at various stages. The team also gratefully acknowledges advice and comments received from Anila Bandaranaike and Rocio Castro (World Bank) during various stages of preparation; Harsha Aturupane and Kumari Vinodhani Navaratne (World Bank) for guidance on human development issues; and Uwe Deichmann and Piet Buys (World Bank) for contributions to the analysis using poverty and accessibility maps.
The report benefited from extensive discussions with officials from government departments, notably the Plantation Human Development Trust and Ministries of Finance & Planning, Resettlement, Estate infrastructure and Livestock Development, Health, and Social Welfare. Comments on a previous draft received from Department of National Planning, Ministry of Finance & Planning benefited the final version. Acknowledgments are also due to participants at the Concept Note and Bankwide review meetings for comments and suggestions that shaped the report, and participants at the Regional workshop on Inequality (Delhi, December 2004) where preliminary results of the analysis were presented.
The quantitative Estate household survey was conducted in collaboration with a team from Sri Lanka Business Development Centre (SLBDC) led by Rohanthi Perreira; a team from Centre for Poverty Analysis (CEPA) in Colombo led by Neranjana Gunetilleke and Sanjana Kuruppu conducted the qualitative study of the estates. Guidance on methodology, peer reviewing and partial funding for the qualitative study were provided by the World Bank’s “Moving out of Poverty” (MOP) study team led by Deepa Narayan (World Bank). The questionnaire and sampling design of the Estate household survey benefited from the active participation of numerous individuals, notably, officials from DCS and the Statistics Department of Central Bank, the SLBDC and CEPA teams, and members of the World Bank Sri Lanka Country Team. The qualitative study benefited from suggestions received from government officials, researchers, and other industry related participants at two stakeholder workshops organized by CEPA in Colombo. Financial support from the Department for International Development (DFID), United Kingdom for the estate and conflict-related studies greatly facilitated the new work undertaken for this report.
The report benefited from oversight and comments provided by Kapil Kapoor (Sector Manager, South
Asia PREM). Finally, the team thanks Sadiq Ahmed (Sector Director, South Asia PREM) for his valuable
support; and Deborah Bateman (Country Coordinator), Peter Harrold (ex-Country Director for Sri Lanka)
and Naoko lshii (Country Director for Sri Lanka) for their support and commitment to bring the poverty-
and inequality-related challenges to the forefront of the World Bank’s engagement in Sri Lanka.
Executive Summary
measurement) essential to measure poverty i s not
1. The development story m S n Lanka IS one of mixed success. The country is on par with middle- income countries and Millennium Development Goal timetables for universal primary school enrollment, gender parity in primary and secondary school enrollment, and universal provision of reproductive health services. At the same time, consumption income poverty persists and the poor continue to face basic welfare challenges such as malnutrition.
2. A number o f interrelated constraints prevent access by the poor to opportunities in more dynamic sectors o f the economy. In poor rural areas and the estates economic and geographic constraints include inadequate connectivity to markets and growth centers, lack o f electricity and transport facilities (infrastructure) and poor quality schools (public services). In poor urban areas constraints include inadequate access to clean water, electricity, sanitation and quality of housing. At the household level, the report assesses the cyclical nature o f poverty traps caused by l o w levels of education, poor nutrition and underemployment (mostly associated with the informal sector). Population in the estates, North and East, and the tsunami-affected coastal areas are more likely to fall into the poverty trap cycle due to historical disadvantages or recent events like civil conflict or natural disasters.
U 90-91 95-96 I3 2002
I.
3. Consumption poverQ reduction in Sri Lanka has been modest-about 3 percentage points (from 26 to 23 percent) from 1990-91 to 2002)-and uneven across sectors. Urban poverty halved between 1990-91 and 2002, while rural poverty declined by less than 5 percentage points, and poverty in the estates increased by about 50 percent-malung this sector the poorest in the country (Figure 1). The conflict-affected North and East are excluded fiom these estimates, since consumption data from HIES (the official source for poverty
Poverty, growth, and inequality trends in Sri Lanka
Figure 2: Poverty headcount by district, 2002
Figure 1: Poverty headcount in Sri Lanka
o f U v a and Sabaragamuwa fell from 16 incidence of poverty fell to 11 percent for Western Province compared with 35 percent for Sabaragamuwa and Uva.
5. The largest poverty reduction in 2002 occurred in districts with low incidence of poverty in 1990-91 (Colombo and Gampaha in Western Province).2 In some districts-already
I Source: DCS HIES 2002.
' Excluding the North and East. Source: Peace Secretariat using Central Bank Provincial GDP numbers.
percentage points, respectively, by 2002. Poverty headcounts in Colombo and Gampaha were 16 and 15 percent, respectively, in 1990-91, and reduced by 10 and 4
6. Poverty and vulnerability (the risk of falling into or deeper into poverty) are closely linked, since the poor and those just above the poverty line are more susceptible to shocks.
Figure 3 shows that the population is highly concentrated around the poverty line, implying that even small shocks can cause large increases in poverty in~idence.~
7. Current targeted welfare programs peljform well below potential. Despite a long history of publicly funded welfare programs the evidence suggests that current programs perform well below potential in protecting the consumption of the vulnerable and the poor.
The largest cash transfer program, Samurdhi still misses a large proportion of the poor even
Sources of risk at the household level include sickness and death of a family member and unemployment at the household level.
Glinskaya (2000), using data from SLIS (1 999-2000).
World Bank staff calculations based on DCS HIES 1990 and 2002.
At the community level risks include drought, crop failure, and other natural disasters (World Bank 2006c, draft).
’ CFSES 2003-04.
Figure 3: Distribution of real per capita monthly consumption expendit”
Source: Staff estimate based on HIES 199G91 and 2002.
Sri Lanka (higher Gini indicates hgher inequality) increased at an annual rate of 2 percent, much higher than for East Asian comparator countnes with the exception of China (Figure 4). Thus, for every 1 percent annual growth in GDP per capita, the poverty headcount ratio declined by 0.4 percent in Sri Lanka, compared with 0.9, 1.4, and 2.6 percent in Korea, Vietnam and Thailand, respectively.
12. Rising inequality hinders poverty reduction.
Had consumption distribubon remained unchanged from 1990-91, the 30 percent growth in average consumption by 2002 would have reduced poverty by more than 15 percentage points nationally instead o f the observed 3 percentage points. At the average rate o f per capita consumption Gini increase o f the past decade (2 percent annually) and continuing GDP growth at the average rate over the past two
Figure 4: Average annuat growth of Gini coefficient
__--____---_-._______----_I-- I
I
Note: Gini coefficients o f per capita consumption for China and Sri Lanka, o f per capita income for other countries.
Source: China-Ravallion and Chen (2004); Korea-World Bank (2004a); Malaysia-Government o f Malaysia (2001);
Thailand, Vietnam-PovCalNet at the World Bank; Sn years (5.7 percent annually), the poverty headcount
in 201 5 i s likely to be 15 percent, well short of the Millennium Development Goal o f halving poverty between 2000 and 2015.' Sri Lanka will need to grow at 10 percent annually to achieve this target. If the Gini coefficient remains unchanged at the 2002 level, however, a 5.7 percent rate o f annual GDP growth will be sufficient to reduce the poverty headcount to 8 percent by 20 1 5.8
II.
13. Poverty i s strongly associated with attributes of individualsihouseholds such as education attainment, employment status, and family size. After individual differences are accounted for (in a multivariate regression o f the probability o f being poor), the likelihood o f being poor also depends on a range of spatial factors, such as poor regional growth and employment opportunities, and the availability o f infrastructure, such as roads and electricity.
A.
14. Larger households, especially those with children, are more likely to be member workmg abroad, however, have a significantly lower likelihood of being poor.
15. The human development challenges that face Sri Lanka difler from those that face most developing countries. Primary enrollment and literacy are near-universal in Sri Lanka. Similarly, basic indicators o f health-fertility, infant and child mortality, immunization rates, life expectancy, and maternal health-are uniformly high across income groups. Good basic indicators in health correlate well with the high literacy o f mothers in Sri Lanka.
16. Low education attainment is strongly associated with poverty (Figure 5). In 2002, well over 30 percent of households with heads with schooling up to and including grade 5 fell under the poverty line, compared with less than 10 percent for heads who completed at least grade 9. Regression analysis shows that a household is significantly less likely to be poor when the head has an education at the A-level and above.
The correlates of poverty: household characteristics and spatial factors
Household and individual specific factors
Households with a
In case o f S n Lanka, since HIES was not conducted in 2000, the reference year i s 2002.
Assumes population growth rate o f 1 2 percent These projections are based on the approach proposed by Bourguignon (2003)
Please note the per capita consumption measure i s unable to account for economies o f scale in consumption and age o f family
to estimate growth elasticity o f poverty under certain restrictive assumptions about the current distribution o f consumption
members, and therefore tends to underestimate the welfare of larger households
17. Disaggregated data on school enrollments show disparities among income groups. Educational attainment i s significantly lower among children o f poor households.
Net enrollment for grades 10-13 among the lowest income quintile (31 percent) is only one-half that of the richest quintile (60 percent) and the net tertiary enrollment rate for the lowest quintile (2 percent) 1s less than one-sixth that for the richest quintile (1 3 percent).
18. The low quality of education acts as an additional handicap for the poor in remote areas. Nationally, students display a l o w skill level in first languages, English, and mathematics, and these indicators are even lower for nonurban children. Absenteeism of teachers
Figure 5: Poverty headcount by education
attainment Of 2o02
(percent)
P f
Degree &above kade 9 &behwdegree
Grade 6-8 I
Up to Grade 5 No schoohg
S O U ~ ~ ~ S Z O O Z 0 10 20 30 40 SO
(about 20 percent nationally) is also higher in nonurban 1 Source:
schools. The poor quality o f education has led to a rapid
increase in the use of private tutors, and another urban-rural and rich-poor gap: CFSES (2003-04) shows that private tuition i s used less by nonurban children, and twice as often by students in the highest income quintile than those in the lowest quintile.
Bank staff calculatlons 2002.
19. Rich-poor gaps in health include low birthweight, malnutrition among preschool children, poor nutritional status of adult women, and incidence of communicable diseases such as tuberculosis and diarrhea. Food availability, dietary awareness, and access to safe water and sanitation are often linked to income/consumption poverty (Table 1).
20. Inadequacies in nutrition and education affect lifelong earnings and trap households in a cycle of low capability and poverty. The higher incidence o f poverty among the less-educated and the fact that the poor are less likely to participate in higher levels of education perpetuates the vicious cycle o f poverty.
and sector
2 1. The correlation between unemployment and poverty for the population as a whole is weak, but the presence of an unemployed youth is associated with a higher probability of the household being poor.
More than 75 percent o f the unemployed are between 15 and 29 years o f age." Youth unemployment i s especially high among school dropouts, who in turn are more likely to belong to poor households. A household i s also more likely to be poor when at least one member i s employed in an elementary occupation (mostly in the informal sector)." Since underemployment i s often a feature in the informal sector, this finding supports the commonly held view that underemployment and poverty are closely linked. Individuals with lower education attainment tend to be employed in elementary occupations.
Education i s thus an important underlying factor linlung labor market outcomes with poverty. Also, consistent with the pattern o f agncultural stagnation discussed later, employment as an agncultural worker increases the likelihood of poverty.
lo Nanayakkara (2004).
l1 Elementary occupations in the informal sector include wage labor in agnculture, fishing, mining and construction, street
vendors, domestic helpers, and garbage collectors.
B. Spatial or location-specific factors
22. Spatial characteristics at the district and DS division levels emerge as strong correlates of poverty.
Households-identical in all characteristics-can have very different likelihood o f being poor depending on where they are located. A household located in a D S division with the average characteristics o f Colombo district i s 7 percent more likely to be non-poor than a similar household in a D S division with the average characteristics o f Monaragala district. This highly stylized example illustrates the uneven pattern o f poverty incidence can be partly explained by the location of the household.
23. Poverty is concentrated in areas where connectivity to towns and markets, access to electricity and average educational attainment are relatively low, and agricultural labor is an important source of employment. Location attributes are highly correlated with each other, which indicate the many-sided nature of challenges faced by poor areas. Remote areas with poor connections to markets and cities are more likely to have lower access to electricity and lower average educational attainment.
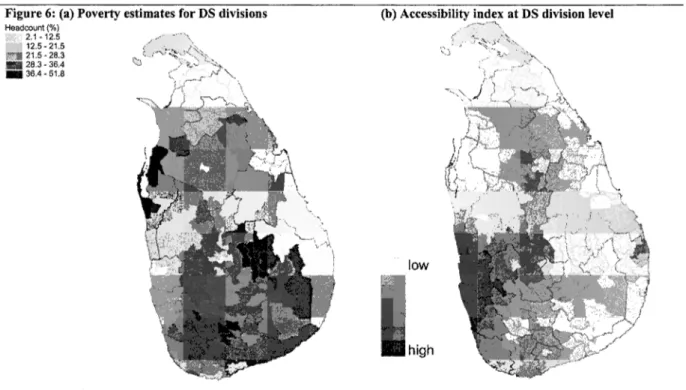
Figure 6: (a) Poverty estimates for D S divisions Ibl Accessibilitv index at DS division level
low
high
Note: The accessibility index is calculated for every point as the sum o f the population totals o f surrounding cities and towns inversely weighted by the road network travel time to each town. This map shows the mean o f the access values for all points that fall into a given D S unit. The index is a measure o f potential market integration reflecting the quality and density of local transportation infrastructure, including 185 cities and towns in the analysis.
Source: Poverty map from DCS 2004; accessibility map based on staff calculations.
24. Multivariate analysis finds that the probability of a household being poor falls by 2-3 percent with every unit increase in the accessibility index. Figure 6 vividly portrays the association between the accessibility index (potential for market integration using distance and availability o f roads from towns and markets) and poverty estimates at the DS division level, and i s based on the poverty maps produced by DCS. The probability of being poor i s also greater when the household i s located in a district with a higher proportion o f household heads with only primary education and with l o w electricity usage.
111.
25. Migration offers upward economic mobility to those in economically marginal areas. Migration can affect cross-regional inequality by shrinking wage gaps between regions as people move in response to wage differences, and promote development in lagging regions through remittances sent back to the
The impact of internal migration-a consequence of rising regional inequality
migrants’ place o f origin. However, migration can also perpetuate regional imbalances, for example when the more educated gravitate toward fast-growing cities.
26. Internal migration has almost doubled between 199697 and 2003-04 from 15 to 29per 1,000 households).” The primary migration destination i s Western Province, which includes the Colombo urban area. This trend i s consistent with the expanding wage gap between Colombo and the rest o f the country, even in elementary occupations (informal sector). The overall economic benefits o f migration from rural and remote areas to Colombo are large and have increased over the past decade. In 2003-04, 81 percent o f internal migration was by job seeker^.'^ A substantial share o f household consumption expenditwe- around 26 percent4ame from remittances in 2002 (using HIES 2002).
28. Migrants are also likely to be better-educated 27. Poverty incidence in the origin district is strongly associated with recent migration to Colombo. Census (2001) indicates that a large number o f migrants come from poorer districts and districts in the North and East. Thus poverty seems to act as a “push” factor inducing households from economically disadvantaged areas to migrate.
However, migration i s more likely to be undertaken by the better-educated. Figure 7 shows that average education among migrants i s much higher than those in their district o f origin. This indicates that the better availability o f jobs in Colombo acts as a
“pull” factor for educated or skilled workers from lagging regions.
Note: Includes migrants to Colombo city only.
Source: wB staff estimates based on census 2oo,, Figure 7: Share of household heads with tertiary education by origin district, 2001
(percent)
I xo, -- II
0 migrants by origin district residents by district I
Colombo City are almost twice more likely to have tertiary-level education than nonmigrants already living in Colombo City. Similarly, the proportion o f migrants workmg in elementary occupations i s much smaller than that o f nonmigrants. When the household head i s a migrant, the household i s also more likely to have good housing conditions and amenities. Therefore, urban poverty i s unlikely to be a direct consequence o f the rural poor flooding urban centers.
29. Migration out of remote and lagging regions is more likely among the better-educated. It i s clear that improving education in remote areas can empower the poor with better choices to improve welfare. But over-agglomeration in Colombo created by the inflow o f migrants i s leading to congestion and infrastructure bottlenecks and limiting the potential for economic growth. Furthermore, strains on basic city services tend to be concentrated in already underserved settlements, thus reducing the welfare o f the poor disproportionately. Cross-country analysis on the relationship between economic growth and urban concentration suggests the optimal “urban primacy” for Sri Lanka (the share o f the main urban center o f the country in total urban population) at 25 percent.14 Estimates for urban primacy for the greater Colombo area i s considerably above this level at 35-50 percent, putting the estimated “cost7’ o f over-
l2 CFSES 1995-96 and 2003-04. These estimates are likely to understate migration, since migrants in these surveys exclude those who have migrated along with their entire household.
l3 CFSES 2003-04. Over the same period, external migration fell marginally from 63 to 60 per 1,000 households, but remittances from abroad grew at 11 per cent in 2003. This report focuses on internal migration because o f its close link with widening regional inequalities within Sri Lanka, as well as the current lack o f information on the impact o f external migration. The latter will be analyzed in detail in an upcoming trade study for Sri Lanka.
l4 See Henderson (2000). There are many country-specific characteristics that significantly affect the relationship between urban
primacy and economic growth, but are not necessarily incorporated in a cross-country exercise such as this.
agglomeration at more than 1 percentage point in annual GDP growth.” The development of alternate urban growth centers would better utilize the economic potential o f migration to urban areas.
similar to those for other provinces with the *Excludes Killmochchi, Mannar, and Mullaitivu.
l5 Given the limitations of a cross-country regression, this number i s speculative. At the same time, it i s a useful illustration o f a broader point that Colombo urban area i s overconcentrated, which in turn imposes economic losses on the country.
l6 Central Bank o f Sri Lanka, Annual Report 1998.
” DCS 2004, Poverty Statistics for Sri Lanka; Central Bank o f Sri Lanka, CFSES 2003-04.
2001) to post-cease-fire (2002-03) years.18 Unemployment fell from 13 to 9 percent in the North and from 16 percent to 10 percent in the East from 2002 to 2004, while the national unemployment rate dropped only marginally from 8.8 to 8.3 percent.”
34. Signijkant constraints to sustaining high growth in the North and East remain. These include (i) poor availability and access to financial services, (ii) poor access and quality o f economic infrastructure (roads, telecommunications, and water), (iii) time restrictions on the use o f the A 9 highway, (iv) fishing restrictions, (v) limits on mobility in certain areas such as Jafha, and (vi) outmigration o f the better- educated to the rest o f the country or abroad. The tsunami o f 2004, as mentioned above, i s likely to have aggravated the poverty challenges in the hardest-hit Eastern Province.
35. The cease--re since 2002 has presented the North and East region with the longest semblance of normalcy and peace in recent years. Initial studies have shown significant peace dividends for the North and East. The sustainability o f growth in the regon and prospects for significant poverty reduction will depend on whether durable peace i s achieved and the institutional constraints mentioned above are addressed.
B. Poverty in the estates
36. The poverty headcount in the estates increased between 1990-91 and 2002 and is now 7percentage points higher than the national average (Figure 1). The story in the estates-home to only 5 percent o f the country’s population-seems to be one o f stagnation, rather than a drastic fall in welfare. A high concentration o f consumption per capita within a narrow interval around the poverty line implies that small shifts can result in large swings in poverty, and the large increase in poverty headcount occurred due to a slight shift in the consumption distribution (Figure 3). A comprehensive Estate Household Survey and qualitative study were conducted to examine the determinants o f estate poverty in depth and discern patterns among types o f estates by size, location, type o f crop (tea or rubber), and management (regional plantation company, privately owned and state owned). An Asset Index (AI) score was used as a proxy for household wealth.20
37. Estate households with more earners and with better-educated household heads tend to be better-of Possession o f National Identity Cards (NICs) among household heads i s also associated with significantly lower AI-poverty rates, and those with NICs have better opportunities to earn outside the estates.
Ownership o f NICs i s particularly low among youth (age 16-19), which i s probably related to the degree o f isolation o f households and estates, and, in turn, their increased vulnerability to poverty.
38. More than 40percent of estate households rely solely on estate wages for earned income. The AI- poverty rate i s highest among households with wage incomes from only one source, be that within the estate or outside it. Regression analysis shows that while wage employment outside the estates i s not associated with significantly higher welfare or earnings, households that receive income from enterprises tend to fare better.21 Therefore, diversifiing to occupations beyond wage employment-particularly to income from enterprises-is associated with higher welfare, a pattern that also holds for the rural sector (see below).
39. The “ideal” diversi3ed livelihood portfolio of an estate household would include remittances from household members working overseas. Consistent with countrywide trends, estate households that receive remittances from overseas migrants tend to be better-off. Internal migration to urban areas, with or without remittances, does not seem to matter significantly for estate households’ wealth or AI-poverty.
Peace Secretariat using CBSL data.
l 9 DCS Labor Force Surveys (LFS) 2002 and 2004.
2o AI-Poverty Rate is defined as the percentage of households whose AI scores lie below the 30th percentile. The 30th percentile was used since the poverty headcount for the estate sector i s 30 percent.
Enterprise incomes come from nonagricultural businesses and from sales of crops, livestock, and livestock products.
21
This i s partly because the rationale for internal urban migration is not limited to short-term earnings, but rather includes the expectation of future opportunities, and access to networks and shlls development.
40. Higher poverty among estate hotrseholds is associated with the remoteness or lack of useable year- round roads linking the estate to the nearest town. Nearly 42 percent o f estate households cannot use the road to the nearest town at all times o f year. Another social factor that emerged from the Estate Survey was alcoholism. About 80 percent of estate respondents mentioned alcoholism as a problem, and 75 percent o f community informants reported n o improvement over the last 15 years. The increased availability o f illicitly produced alcohol was perceived as aggravating the problem.
41. No clearpicture emerges as to why consumption poverty in the estates stagnated or worsened slightly over the past decade. One trend in employment and diversification data for the period 1996-97 to 2003- 04, consistent with higher poverty, is a fall in the average number o f income earners in estate households (from 2.3 to 1.7 per household). Ths may reflect a growing dislike for estate work by youth. The qualitative survey found youth avoid estate work in favor o f remaining unemployed until the right opportunity outside estates came their way.
42. A majority of households interviewed in the Estate Survey reported an improvement in their household conditions in the last 15 years, despite the overall deterioration in the conditions of the estates.
This difference in perceptions i s partly explained by the increasing role of nonestate employment among estate residents, which may partly de-link the condition o f the estate from that of the household.
43. Many aspects of health, education, and housing have improved in the estate; and this is also corroborated by the perceptions o f respondents to the Estate Survey. Nevertheless, the estates lag well behind the rest o f the country on key indicators of health and education. For example, 37 percent o f estate children are stunted compared with 14 percent of rural children; and 48 percent o f estate mothers have l o w body mass index (BMI) compared with 23 percent o f rural mothers (DHS, 2000). Qualitative interviews indicated dissatisfaction with the quality o f health services. Access to hospital care i s a serious concern in remote estates; survey respondents reported an average one-way travel time o f more than an hour to the nearest hospital. Households perceived an overall improvement in access to education over the past 15 years, but the cost and quality of education and teacher shortages were frequently raised as concerns.
44. Nearly 30 percent of the population in the estate sector is poor but only I 3 percent of the households interviewed reported receiving cash transfers from government welfare programs. The actual coverage rate in the estates contrasts sharply with the Samurdhi coverage rate for the rest o f the country (40 percent). Coverage by other social programs-with the sole exception o f sanitation-also appears to be low. Programs in childcare, early chldhood development services, housing, training and awareness, and microcredit reach less than 15 percent o f the households sampled in the Estate Survey.
45. Poverty traps in the estate sector and remote, rural areas of Sri Lanka share many characteristics, including a lack of connectivity and access to infrastructure to lack of education. Internal and external migration rates and participation in self-employment for the estates, although improving over time, are well below the rates for the rest o f the country (CFSES). A long history o f isolation o f these communities has contributed to inadequate networks and mobility beyond the estates. Even when estate residents are able to find work in outside jobs or migrate to urban areas, the opportunities are limited due to lower education attainment.
46. Qualitative analysis indicates that a root cause of persistence of poverty in the estates is the unique
organizational structure of estates. Historically, the estates have employed resident workers who
originally came from a foreign country; and even today, much o f the labor i s provided by a resident
workforce. The relatively unchanged estate organizational structure is found to contribute to a sense o f
marginalization, leads to isolation, and adversely affects economic decisions o f households. The long-
term future o f the sector appears to be in moving away from resident labor structure and toward a
standard employer-employee relationship. For this to work, however, the commercial viability o f estates has to improve to support higher labor productivity and wages.
C.
47. Poverty reduction in the rural sector- home to 80percent of the population and about 3.5 million of the county ’s poor-has been stymied by stagnation in the agricultural sector. Nearly 58 percent o f the rural population depends on agncultural, at least partially, for their livelihood.22 Agriculture GDP growth slowed from 2.8 percent during the 1980s to 1.6 percent during the 1990s and to 0.9 percent during 2002- 04, while national GDP has been growing annually by 5 percent since the 1 9 9 0 ~ . ~ ~
48. Households dependent on agriculture tend to be poorer (Figure 8). Nearly 24 percent o f rural agncultural households are poor, compared with only 16 percent o f nonagricultural households. In the poorest province o f Uva, the poverty rate for agncultural households (34.3 percent) i s double that for nonagriculture households (16.9 percent) (Figure 8), yet agriculture comprises 53 percent of GDP in Uva.
The challenge of rural poverty
Even in Western Province, where agriculture makes up only 3 percent o f provincial GDP, and where market access and economic infrastructure are substantially better than elsewhere, 15 percent of households engaged in agnculture are poor compared with 9 percent o f those engaged in other activities (Figure 8).24 According to CFSES (2003- 04), the average monthly income o f those engaged in agnculture i s only 60 percent of that in industries and less than one-half o f that in services.
Figure 8: Provincial poverty rates within the rural sector, 2002
3% -
30% I
25%
aoY+
15%
10%
5%
1 Source: Staff calculations based DCS HIES 2002.
49. HIES data shows skewed and limited improvement in incomes in rural areas, especialb among agricultural households. The poorest 7 percent of rural and 10 percent o f agricultural households suffered a decline in real income between 1995-96 and 2001-02. Only 19 percent o f agricultural households experienced an income increase greater than 10 percent. Raising agncultural productivity is therefore imperative for reducing rural poverty. Existing studies indicate that policies to ease farmer access to improved technologies and ensure sustainable use o f water and adjustments in existing trade and land policies can facilitate higher productivity.”
50. The growth of the rural nonfarm sector has signijicantly contributed to a reduction in rural poverty.
The nonfarm sector has become increasingly important in rural areas, generating 67 percent o f rural employment in 2003. Nearly 52 percent o f the average rural household’s income came from nonagncultural wages and self-employment in nonfarm enterprises (HIES, 2002).26 Even for households engaged in agriculture, the share of nonfarm income in their total income exceeded that o f agricultural income. The relative importance o f nonfarm income is higher for paddy farmers (probably because paddy
22 DCS HIES 2002
23 Staff calculations based on data from Central Bank Annual reports, various years.
24 Sectoral contnbution to provincial GDP from Central Bank data (2004).
25 See, for example, World Bank (2003) and World Bank (2004~).
Of the estimated 620,000 rural nonfarm enterprises scattered throughout the country, most are in manufacturing (41 percent) or trading (38 percent). The average rural enterpnse i s a mcroenterprise employing about 2 4 workers including hired labor, farmly members, and the relatively young, wth an age of about 9 years.
26
has lower value and its cultivation requires less labor days than most crops) and lower for farmers growing crops like tea, rubber, h i t , and vegetables. Among rural households owning and operating a nonfarm enterprise, the poverty rate i s 13 percent, compared with 23 percent for households without a nonfarm enterprise. The monthly income per capita for households operating a nonfarm enterprise is 20 percent higher than households without such income.
5 1. Limited employment expansion in the agricultural sector means that poverty reduction will critically depend on the rate at which the rural nonfarm sector can absorb workers from the growing labor force.27 Major obstacles for rural nonfarm enterprises include poor transportation, problems with accessing finance and the cost of finance, access and quality o f electricity, and marketing difficulties.28 The high correlation o f location-specific characteristics (like accessibility and electricity use) with the pattern o f regional poverty in Sri Lanka (section 11) reinforces this view. Addressing these constraints will improve opportunities for the estate population as well, since employment in enterprises i s associated with higher earnings in the estates.
V; Concluding remarks
52. Poverty reduction has been slow due to widening inequalities among income groups and across regions, and because growth is concentrated in Western Province. More inclusive economic growth will require easing specific constraints affecting particular sectors, regons, and groups, but priorities critical for all include improving the quality o f education, access to infrastructure like electricity, connectivity to markets and urban centers, and access to finance for microenterprises. These improvements will expand opportunities for the poor and those in lagging regions in terms o f moving to higher paying occupations, setting up or expanding microenterprises, or migrating to work in modern industries. Since many o f these opportunities are created in the urban sector, poverty reduction will require better and simultaneous coordination between rural development strategies and urban planning and development.
53. Policies to address poverty reduction must address multiple dimensions simultaneously. The President’s ManifesteMahinda Chintana-with its focus on improving the road network, access to electricity and access to finance outside Colombo i s consistent with the needs o f lagging areas and sectors identified in this report as drivers o f change to accelerate growth and poverty reduction. Improving the connectivity of poorer and remote areas to markets will be particularly important, as illustrated by the resurgence o f economic growth in the North and East following the opening o f the A9 highway to Jaffna.
54. Table 3 summarizes key cross-cutting and sectorhegion specific findings along with their implications for the way forward in terms o f policy priorities and knowledge gaps for future analysis. The analytical underpinnings for these conclusions are found in the chapters that follow.
27 In 2003, 82 percent of the total labor force of roughly 7.2 million workers was in rural areas, and nearly 106,000 people join the labor force every year.
28 ADB and World Bank (2005).
Poverty reduction has been slow during the past decade and uneven across sectors-rapid in the urban sector, but slow or stagnant in rural and estate sectors.
0 Economic growth needs to be more inclusive of lagging regions and poor households. A better understanding o f the patterns and causes of poverty requires representative household data for the entire country, including the North and East.
Current social welfare programs like Samurdhi perform well below their potential, primarily due to targeting problems.
A better targeting system (as currently being employed in two Northern districts) will improve the impact o f Samurdhi programs.
0 Poverty reduction has been dampened by rising inequality between as well as within sectors and regions.
High concentration o f population around the poverty line suggests a sizeable vulnerable population at risk of falling into poverty in the aftermath o f shocks.
0
Causes and impact of regionalhpatial inequality:
0
0
Poor areas characterized by low connectivity to markets and towns, low availability o f electricity and human capital. Largest gaps exist between Western Provlnce and the rest o f the country.
Migration into Western Province has increased rapidly in recent years due to rising gaps in economic
opportunities.
A high proportion o f migrants originate from poorer and conflict-affected districts.
The ability to migrate appears to be linked to education. Migrants in Colombo tend to be better- educated than nonmigrants at origin and destination.
Migration adds to the growth potential in the urban center. However, overagglomeration in the Colombo urban area can limit growth potential and reduce welfare due to increased costs o f congestion and strain on services.
Human development:
Basic welfare indicators (e.g., child and maternal mortality, primary and secondary enrollments) are generally high for both the poor and nonpoor. But rich-poor gaps exist along certain dimensions that can have lifelong effects on earnings, and perpetuate poverty across generations.
Poverty is associated with higher rates o f malnutrition among women and children and lower education attainment; poor children are more likely to drop out and not be enrolled at grade 10 and above.
Quality o f education, particularly outside urban areas, is an area o f concern. The poor are especially affected, since they may not be able to compensate fully with private tuition.
0
0
Improving connectivity of remote areas to market centers and infrastructure availability.
International experiences suggest investing in transport inj-astructure i s effective to develop regional growth centers, when complemented by investments in key areas (e.g., access to finance and electricity). Further analysis i s needed to identify the comparative advantages o f specific investments and interventions to exploit those advantages
Improving education and skills in remote areas can enhance employment choices, including the ability to migrate.
Better urban planning and quality o f urban services can help reduce the costs o f
overconcentration and mitigate its impact on the poor.
0 Reducing income poverty is likely to reduce malnutrition in the medium to long run. In the short term, nutritional outcomes will benefit from improving access to safe water and sanitation and nutritional awareness.
More analysis i s needed to explain high dropouts among poor children. Key question: are dropouts explained by supply or demand side factors, or a combination o f both?
The quality o f learning could be improved by
emphasizing English and information technology
skills and ensuring teacher deployment to rural
areas.
Rural sector:
Poverty in rural areas is higher among agricultural households, due to stagnation in agricultural incomes during the past 10 years.
Rural nonfarm sector has become increasingly important for employment and incomes; and income from nonfarm enterprises appears to reduce poverty.
Given limited opportunities in agriculture, poverty reduction can be improved through growth o f the rural nonfarm sector to absorb workers from the growing labor force.
Estate sector:
Lags behind national averages in poverty rates and human development (e.g., malnutrition and educational attainment). In the estates the
concentration o f consumption around the poverty line is much higher than for the country as a whole.
Poverty is higher in estates that lack an all-season road to the nearest town. Not possessing a NIC i s linked with hugher poverty among households.
Income from outside enterprises and remittances from overseas migrants reduces poverty. But the ability o f estate households to diversify their sources o f income is low compared wlth the rest o f the country.
Economic decisions and opportunities are adversely affected by marginalization from the mainstream, and the current organizational structure o f estates.
Conflict-afected areas:
The conflict-affected North and East lag behind the rest o f the country in economic infrastructure and key human development outcomes.
Remittances appear to have contributed to safeguarding income and consumption levels to a certain extent.
The cease-fue since 2002 has spurred enough economic recovery in the North and East to increase real GDP and reduce unemployment.
Improve farmer access to technologies, trade, land and irrigation to help raise agricultural
productivity.
Obstacles to growth and the start-up o f new enterprises include access to and quality o f energy and transport, as well as access to finance.
Improve access by rural entrepreneurs to markets and market information.
Improving connectivity to towns, coverage of National Identity Cards and quality o f health and education services can help improve economic opportunities.
Increasing the coverage o f Samurdhi transfers in estates can take many above the poverty line.
Expansion o f coverage o f social program in microfinance and skills development can improve households’ ability to diversify to other income activities.
More analysis i s necessary to explore how to improve the commercial viability o f estates, and move the structure toward a more standard labor arrangement.
Removing constraints on the mobility o f people and goods, such as on fishing and on hours o f operation o f the A9 highway, will yield significant economic benefits.
Filling knowledge gaps in the patterns and causes o f poverty will only be possible with more complete and representative household data.
Sustainable peace remains a necessary
precondition for sustained economic growth and
poverty reduction in this region.
1. The Sri Lankan Economy in an International Context: Achievements and Challenges
decline from 26.1 percent in 1990-91 to 22.7 percent in 2002 (Figure 1-1). During this decade
1. Human development indicators for health and education in Sri Lanka are now almost on par with developed countries. Sri Lanka has already attained or is close to attaining the Millennium Development Goals (MDGs) of universal primary school enrollment, gender parity in primary and secondary school enrollment, and universal provision of reproductive health services well before the target year of 201 5 .l
2. Improvements in nonincome dimensions of welfare, however, are not matched by improvements in income or consumption poverty. In 2002, 23 percent o f the Sri Lankan population was poor, with per capita consumption expenditures below the national poverty line.
Between 1990-91 and 2002, the poverty headcount rate declined by only 3 percentage points, well behind the pace o f poverty reduction necessary to attain the Millennium target o f halving poverty incidence by the target year of 201 5.
Lanka,1990-2002 ,
1.1. Poverty trends in SriLanka, 1990-2002
4. Economic growth during periods o f poverty
reduction was unevenly distributed, resulting in Source: HIES for different years, using official poverty lines for Sn Lanka (data excludes North & East)
national poverty increased by almost 3 percentage points &om 1990-91 to 1995-96, and then fell by more than 6 percentage points from 1995-96 to 2002.2 These estimates exclude the conflict- affected North and East, since HIES data (the official source for poverty statistics in Sri Lanka) suitable for estimating poverty is unavailable for this region (see Chapters 2 and 7 for more details).
2 - g 40 30 20
73 I 8 10
0
National Urban Rural btate
1.2. A cross-country comparison of poverty, growth, and inequality
5. Why has poverty reduction been slow and uneven across sectors and regions in Sri Lanka?
Some aggregate (macro level) studies suggest that Sri Lanka has fallen substantially short o f its income growth potential. When income growth for Sri Lanka i s compared with the Republic o f Korea, Malaysia, and Thailand t h s argument seems reasonable (Figure 1-2). In the 1960s, per capita income in Sri Lanka compared favorably with that o f these three counhles, but is currently less than one-tenth that of Korea, one-fourth that o f Malaysia, and one-half that o f Thailand. And China, which lagged far behind Sri Lanka in per capita income in the 1 9 6 0 ~ ~ recently overtook Sri Lanka after more than 10 years of extraordinary growth performance.
6. The UNDP’s global Human Development Report 2005 shows that Sri Lanka’s human development index, and its achievements in nonincome dimensions o f welfare is among the
’ See Annex 1, Table A-1 .l
* Excludes the Northern and Eastern provinces.
highest in developing countries, in sharp contrast to its rank in terms of GDP per capita. Sri Lanka’s rank on GDP per capita minus that on Human Development Index (I-IDI) i s larger than most East and South Asian comparators (Figure 1-3).3 Since human development was an important prerequisite for East Asian countries’ rapid growth during 1980s and 1990s, this indicator can be interpreted as further evidence that Sri Lanka has been unable to fully exploit its growth potential.
Figure 1-2: GNI per capita, 1962-2002 (current US$)
moo0 MOO0
lzooo
DO00 8000 6000 4000 2000 0
-Si Lanka
N r - N r - N r - N r - N
w m r - r - 0 3 0 3 o ) m o
z z z a z z a m : :
Source: World Bank, WDI (2005)
Figure 1-4: Annual rates of growth and poverty reduction in the 1990s (percent)
9riLanka China (90- Korea Malaysia Thaiknd Vietnam (91-02) 01) Rep (90- (90-99) (90-02) (93-02)
0 1)
0 Annual rate ofpoverty reduction Annual erowih rate
Source: Real per capita GDP data:- World Bank, WDI, (2005a).
Poverty headcount ratios: Sn Lanka:-DCS (2004); China:- Ravallion and Chen (2004); Korea:-World Bank (2004a);
Malaysia:-World Bank (2004b), Thailand:-& Jitsuchon (2004);
and Vietnam:-Glewwe et a1 (2000) and Carolyn Turk (2005).4
Figure 1-3: The rank of Human Development Index minus the rank of GDP per capita, 2003
1
I__--