Public Disclosure AuthorizedPublic Disclosure AuthorizedPublic Disclosure AuthorizedPublic Disclosure Authorized
A Report on the Second Poverty and Social Monitoring Survey
(PSMS-II)
Joint Report
June, 2006
Directorate of Economics and Statistics Planning Department
Government of Uttar Pradesh and
The World Bank
This report is a product of collaboration between Directorate of Economic and Statistics (DES) of the Planning Department Government of Uttar Pradesh, and the World Bank. The report was prepared under the guidance of Mr. Sunil Kumar, Secretary, Planning Department, Government of Uttar Pradesh, and Kapil Kapoor, Sector Manager, South Asia Poverty Reduction and Economic Management Unit, World Bank. Dr. R. Tiwari, Director, DES and Mr. A.K. Tiwari, Additional Director, DES provided monitoring and supervision of the administrative and technical aspects related to this report. Mr. S. D. Verma, Deputy Director, DES contributed to multiplier generation and pooling of data sets. The main authors of the report are Dr. R.K. Chauhan from the DES side and Salman Zaidi and Elena Glinskaya from the World Bank side. Dr. R. K. Chauhan, Economics & Statistics officer, DES and Dr. N.K. Singh, World Bank Consultant, implemented most of the computations including generation of multipliers, pooling of data sets, and carrying out statistical analysis of data.
The data entry packages were prepared by the Software Development Section of the DES. Efforts of Mr.
G.S. Pandey, the then Programmer of DES were considerable in dealing with the in-house production of software and providing related training. Data cleaning was undertaken by Ms. Vartika Srivastava and Ms.
Neelam Singh, Economic and Statistical Inspectors of DES, which require earnest acknowledgement.
Acknowledgements are also due to Mr. Ish Dutt Verma, Assistant Economics and Statistics Officer DES
for rendering all round assistance in day-to-day work on this report. We are thankful to Economics and
Statistics Inspectors, Assistant Economics and Statistics Officers and Supervisory Officers posted in the
field for collecting Schedule-99 data and then entering this information. (Annex 1 presents the names of
staff who were involved in the implementation of PSMS-II.) Helpful comments at the final stages of the
report were provided by World Bank colleagues Ihsan Ajwad, Arpita Chakraborty, Dipak Dasgupta, Branko
Milanovic, Philip B. O’Keefe, V. J. Ravishankar, and Binayak Sen. Editorial and logistical help has been
provided by Sapna John, Thelma Rutledge, Rita Soni and Christine van der Zanden. Last, but not least,
thanks are also due to respondents who extended their co-operation to the field staff and replied to difficult
and tedious questions patiently during the survey.
Planning Department Government of Uttar Pradesh
Foreword
Uttar Pradesh is the most populous State of India and all-round development of the State is critical to sustainable high growth rate of the country as a whole. The State is slowly emerging from the period of fiscal stress and has succeeded in controlling the spiraling fiscal deficit and reducing revenue deficit. In the year 2005-06, Uttar Pradesh successfully emerged as a ‘revenue surplus’ State – almost two years ahead of the targeted date under the Fiscal Responsibility and Budget Management Act. State Government has also, after almost two decades, succeeded in mobilizing resources for the Annual Plan 2005-06 and also fully spending the same. Investment in roads, power, agriculture, irrigation, education, health, poverty alleviation and other related sectors is increasing and it is expected that the outcomes will be commensurate with increasing investment.
The challenge of poverty alleviation is, however, still critical as almost 20 percent of the country’s poor are residing in Uttar Pradesh. Despite impressive strides being made in the field of poverty alleviation, as brought out in the Second Poverty and Social Monitoring System Report, 48.8 million people still remain below the poverty line in 2002-03. Apart from material deprivation, deficiency in using publicly provided services such as health and education by the poor is a cause for concern. State Government has initiated steps to attain universal enrolment under the ‘Sarva Shiksha Abhiyan’ and impressive results have been obtained in the last three years. Steps are also being taken to improve service delivery in the health sector.
The State Government recognizes that in the light of improvement in the fiscal position of the State and creation of an environment conducive to increased investment and rapid development of the State, a window of opportunity has opened up wherein a decisive thrust can be provided to poverty alleviation programmes.
Through effective implementation of self-employment schemes, wage employment schemes under the National Employment Guarantee Act and increased investment in rural infrastructure, it is expected that significant reductions in poverty rates can be achieved. State Government has also taken a host of initiatives such as ‘Bhoomi Sena’ (Land Army) scheme, Kanya Vidya Dhan Yojna etc., which are expected to benefit the poor.
It is recognized that the poor are unevenly distributed among the four regions and districts in the State. In order to evolve a more focused strategy to combat poverty, need to have reliable, independent district level data is being felt. State has initiated steps to build the district level data sets of socio-economic indicators. It is expected that by 2007 useful data sets would be available at least at the district level. Efforts to gather and provide targeted data (and analysis as well) by the Economics and Statistics Division of the Planning Department, which began in late nineties through the First Poverty and Social Monitoring System Report, are now beginning to bear fruit. The Economics and Statistics Division has received valuable support and technical guidance from the World Bank.
It may be noted that as a part of the overall program of fiscal and sectorial reforms “Poverty and Social
Monitoring System” project was designed and conducted by the Economics and Statistics Division of the
Planning Department, which has tremendous experience in conducting socio-economic surveys, with the
data collected through this specific survey two reports namely “Poverty and Social Monitoring in Uttar Pradesh: A Baseline Report 1999-2000” and “Poverty in India: The Challenges of Uttar Pradesh”
were published by Economics & Statistics Division, Planning Department and the World Bank respectively.
As a follow-up to the baseline survey, another multi-purposes survey was undertaken during 2002-2003 and the Second Poverty and Social Monitoring Report is based on the findings of the aforesaid survey. This report not only shows the findings based on the survey of 2002-2003 but also draws comparisons between two survey results. This Report is a collaborative report of the Economics & Statistics Division, Planning Department and the World Bank.
I hope the findings of the report would be useful to policy makers, implementing agencies and researchers dealing with reform programmes for poor and weaker sections of society and further analysis would be carried out based on the needs of specific Government departments.
Dated: 16th May, 2006 (V. Venkatachalam)
Principal Secretary
Government of Uttar Pradesh
Planning Department
Summary 11
1. Introduction and Background 15
1.1 The Poverty and Social Monitoring System in UP 15
1.2 List of Monitoring Indicators 15
1.3 The PSMS Surveys, Rounds I and II 16
1.4 Objectives and Scope of Analysis of the Report 17
2. Income and Poverty 19
2.1 State Domestic Product 19
2.2 Per Capita Consumption 19
2.3 Poverty Incidence 20
2.4 Inequality and Distribution of Expenditures 21
3. Basic Education 25
3.1 Introduction 25
3.2 School Attendance, Completion and Drop-out Rates 26
3.3 Characteristics of School Enrollment by Region, Income and Gender 27 3.4 Government-Private School Attendance Rates and Expenditures 28
3.5 Government Education Programs 30
4. Health 37
4.1 Introduction 37
4.2 Infant and Child Mortality 37
4.3 Antenatal and Postnatal Care, Family Planning Services 37
4.4 Morbidity 39
4.5 Anganwadi Attendance 40
4.6 Disability 41
5. Asset Ownership, Housing and Access to Amenities 51
5.1 Introduction 51
5.2 Ownership of Assets and Consumer Durables 51
5.3 Structure of Dwelling 52
5.4 Access to Water 52
5.5 Sanitation Facilities 52
5.6 Access to Electricity 53
6. Government Programs 59
6.1 Introduction 59
6.2 Coverage and Targeting of the Public Distribution System 59 6.3 Coverage and Targeting of Other Public Programs for the Poor 60
6.4 Awareness of Government-sponsored Services 61
Annex I………...………65
Annex II...………...………68
Annex III………104
Table 1.2: PSMS Household Questionnaires for PSMS-I and PSMS-II 17 Table 2.1: Per Capita Net State Domestic Product at Current/Constant Prices 22 Table 2.2: Average Monthly Real Per Capita Expenditures in UP by Decile Group 22 Table 2.3: Poverty Estimates for Uttar Pradesh: 1993/94 and 2002/03 22 Table 2.4: Absolute Number of Poor in Uttar Pradesh: 1993/94 and 2002/03 23 Table 2.5: Distribution of Real Per Capita Expenditures in UP by Decile Group 23 Table 2.6: Share of Total Expenditure Spent on Food in UP by Decile Group 23
Table 3.1: Literacy – Population 7 Years and Older 30
Table 3.2: Enrollment Rate of Children Aged 6 to 15 Years 31
Table 3.3: Highest Educational Attainment – Population Aged 18 Years and Older 31
Table 3.4: Drop-out Rate of Children Aged 6 to 15 Years 31
Table 3.5: School Attendance Profile by Single-Year Age Group 32
Table 3.6: Main Reasons for Not Attending School (PSMS-II) 32
Table 3.7: Enrollment Rate of Children Aged 6 To 15 Years – by Region 32 Table 3.8: Enrollment Rate of Children Aged 6 To 15 Years – by Income Level 33 Table 3.9: Enrollment Rate of Children Aged 6 To 15 Years – by Income Level 33 Table 3.10: Proportion of Students Attending Different Types of Schools 33 Table 3.11: Percentage Attending Government Schools – by Region and Income Level 34 Table 3.12: Average Expenditure Per Pupil on Education – PSMS-II 34 Table 3.13: Receipt of Government Scholarships (PSMS-II) – by Income Level 34 Table 3.14: Receipt of Free Text Books (PSMS-II) – by Income Level 35
Table 4.1: Infant Mortality Rate in Uttar Pradesh 42
Table 4.2: Distribution of Expectant Women by Receipt of Antenatal Care 42 Table 4.3: Distribution of Expectant Receiving Antenatal Care by Source 42 Table 4.4: Women Delivering During Past One Year by Place of Delivery 42
Table 4.5: Married Women Reporting Delivery in Last One Year 43
Table 4.6: Percentage of Deliveries by Place 43
Table 4.7: Percentage of Women Giving Birth at Home by Person Conducting Delivery 43 Table 4.8: Percentage of Safe Deliveries by Income Level and Social Group 44 Table 4.9: Distribution of Eligible Couples by Use of Family Planning Method 44 Table 4.10: Distribution of Eligible Couples Using Family Planning Method by Type 44 Table 4.11: Percentage Reporting Illness (During 15 Days Preceding Survey) 45 Table 4.12: Population Consulting Doctor/ Quack/ Health Facility by Symptom 45 Table 4.13: Percentage Consulting by Consultation Type and Income Level 46 Table 4.14: Population Not Consulting Doctor/ Quack/ Health Facility by Reason 46 Table 4.15: Population Not Consulting Doctor/Quack/ Health Facility by Symptom 46 Table 4.16: Percentage of Persons (Age 6 and above) by Number of Days Unable to
Work Normally Due to Illness 47
Table 4.17: Percentage of Households by Knowledge of Existence of Anganwadi in the Village 47
Table 4.18: Percentage of Children (0–6 Years) Attending Anganwadi in UP 47
Table 4.19: Percentage of Children (0–6 Years) Receiving the Nutritional Supplement 48
Table 4.20: Percentage of Children (0–6 Years) Receiving the Nutritional Supplement 48
Table 4.21: Prevalence of Disability per 1000 Population by Disability Type and Sex 49
Table 5.2: Asset Ownership – by Income Group 54
Table 5.3: Structure of Dwelling 55
Table 5.4: Main Source of Drinking Water 55
Table 5.5: Households with Main Source of Drinking Water within their Premises 55
Table 5.6: Type of Sanitation System 56
Table 5.7: Households Connected to Covered/Open Drains 56
Table 5.8: Type of Latrine in the Household Premises 56
Table 5.9: Households with Flush Latrines within their Premises 56
Table 5.10: Households with Electricity Connection 57
Table 5.11: Average Hours per Day of Electricity Supply 57
Table 6.1: Households with APL and BPL Cards 61
Table 6.2: Households with Antyodaya and BPL Cards (PSMS-II) 61
Table 6.3: Households with BPL Cards – By Income and Social Group 62
Table 6.4: Purchases of Wheat and Rice from the PDS Shop 62
Table 6.5: Coverage of Other Government Programs 62
Table 6.6: Coverage of Other Government Programs – by Income and Social Group 63 Table 6.7: Coverage of Other Government Programs in Rural Areas – by Income and
Social Group 63
Table 6.8: Coverage of Other Government Programs in Urban Areas – by Income and
Social Group 64
Table 6.9: Awareness of Government-sponsored Services 64
List of Figures
Figure 2.1: Average MPCE in Uttar Pradesh by Decile Group 19
Figure 2.2: Headcount Poverty Rate in UP (percent) 20
Figure 2.3: Absolute Number of Poor in UP (million) 20
Figure 2.4: UP Poverty Incidence (rural and urban) 21
Figure 3.1: Children’s School Enrollment in UP (percent) 26
Figure 3.2: Highest Educational Attainment for Population Aged 18 and Above 26
Figure 3.3: School Attendance Profile by Age (PSMS-II) 27
Figure 3.4: Rural-Urban Gap in Enrollment (percent) 27
Figure 3.5: Enrollment Rates for Children Aged 6–15 Years by Income Level 28
Figure 3.6: School Enrollment (percent) 28
Figure 3.7: Share of Private School Enrollment (percent) 28
Figure 3.8: Private School Enrollment (Children 6-10 years) 29
Figure 3.9: Government School Enrollment for Children Aged 6–10 Years by Income Level 29
Figure 3.10: Government Scholarships (PSMS-II) 30
Figure 3.11: Government Free Textbook Program (PSMS-II) 30
Figure 4.1: Infant Mortality Rate in UP 37
Figure 4.2: Percentage Reporting Home Deliveries 38
Figure 4.3: Distribution of Deliveries by Person 38
Figure 4.4: Percentage of Safe Deliveries 38
Figure 4.5: Percentage of Reporting Fever 39
Figure 4.6: Proportion Consulting Government Health Facility/Doctor by Income Level 39
Figure 4.7: Proportion of Persons by Number of Days Unable to Function Normally 40 Figure 4.8: Prevalence of Disability by District of Uttar Pradesh (Census 2001) 41
Figure 5.1: Ownership of Assets (PSMS-II) 51
Figure 5.2: Dwelling of Pucca Building Material 52
Figure 5.3: Main Drinking Water Source by Access and Type: PSMS-II 52
Figure 5.4 : Type of Latrine (PSMS-II) 53
Figure 5.5: Flush Latrine within Premises (PSMS-II) 53
Figure 5.6: Sanitation System (PSMS-II) 53
Figure 5.7: Electricity Connection (PSMS-II) 53
Figure 5.8: Electricity Supply per Day (PSMS-II) 54
Figure 6.1: Type of PDS Card (PSMS-II) 59
Figure 6.2: Distribution of PDS Beneficiaries in UP (PSMS-II) 59
Figure 6.3: Median Price of Wheat and Rice 60
Figure 6.4: Coverage of the Other Government Programmes 60
Figure 6.5: Awareness of Government-sponsored Services 61
Context
The Uttar Pradesh Poverty and Social Monitoring System (UP PSMS) was established by the Government of Uttar Pradesh (GoUP) in 1999, under the direction of the Directorate of Economics and Statistics (DES), Planning Department. A broad set of economic and social monitoring indicators (measures of economic growth and poverty, as well as human development outcomes, access to basic services and antipoverty programs, and measures of consumer awareness and satisfaction) was agreed upon at the outset of the project, and a special- purpose module (Poverty Module) was added to the state sample of the 55th Round National Sample Survey (NSS) to measure these indicators. The first survey (henceforth PSMS-I) was completed between February and June 2000. Drawing upon the salient findings of PSMS-I, in October 2002 DES prepared a baseline report on poverty and living conditions, which painted a broad picture of the status of the poor in Uttar Pradesh. PSMS-I report was widely disseminated and discussed throughout Uttar Pradesh, within the government as well as outside of it. The second survey (henceforth PSMS-II) entailed adding a similar module to the 58th and 59th rounds of the state samples NSS and was completed in 2002–03. Both PSMS rounds were administered to large samples of households that were representative of the UP state as a whole, as well as for the rural and urban areas, and the “NSS regions” separately.
Drawing on the PSMS-I and II indicators as well as other sources, this current PSMS-II report has been prepared jointly by the Planning Department of the GoUP and the World Bank. The report aims to provide a quick statistical update on changes in poverty and living conditions and access to services between these two data points. At the same time, the GoUP requested the Bank’s support for a preparation of a joint report with a wider and deeper scope of analysis focusing on determinants and
changes in living conditions of the UP population and assessing performance of current policies and programs with respect to their impacts on the poor.
It is envisaged that the Planning Department of the GoUP and the Bank will embark on the preparation of an analytical report after this PSMS-II report is completed and disseminated.
Highlights of the Findings
Income and Poverty (trends between 1993/94 and 2002/03)
Per capita net state domestic product in Uttar Pradesh in current prices doubled from Rs. 5,066 in 1993/94 to Rs. 10,289 in 2002/03.
NSS UP data show that the pattern of growth between 1993/94 and 2002/03 was pro-poor, meaning that per capita expenditures of the poorest one-tenth of the population increased faster (by 109 percent in nominal terms) than that of the richest one-tenth (which increased by 62 percent in nominal terms).
The headcount poverty rate for UP fell from 40.9 percent to 29.2 percent between 1993/94 and 2002/03.
In absolute terms, the absolute number of poor in UP declined from 59.3 million in 1993/
94 to 48.8 million in 2002/03.
The poverty rate in rural areas of UP fell from 42.3 percent to 28.5 percent, while that in urban areas declined only slightly from 35.1 to 32.3 percent. In this way the urban poverty rate in UP is now higher than rural poverty in the state.
Other poverty measures such as the poverty gap and the squared poverty gap also show similar declines for UP during this period.
Education (trends between 1999/2000 and 2002/03)
Literacy rates in Uttar Pradesh have increased
from 56 percent in 2000 to 60 percent in 2003.
The percentage of the population over 18 that has ever attended school, increased from 46 percent in 2000 to 51 percent in 2003. Still, in 2003, 15 percent of children aged 6–11 years has never attended school.
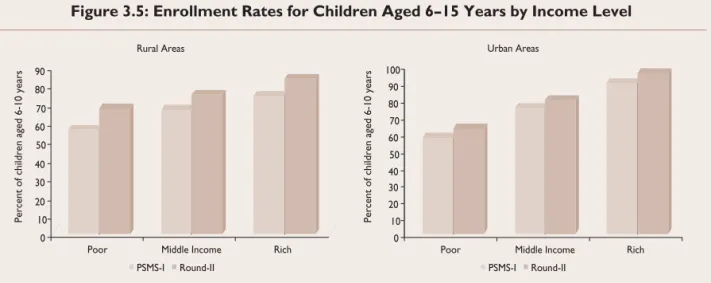
Enrollment rates at the primary level (i.e., among children aged 6–10 years) stood at 78 percent in 2003, up sharply from around 67 percent in 2000; these rates are up in all regions, for both boys and girls, and among all income groups.
The urban-rural enrollment gap has been eliminated among children aged 6–10 years, and has narrowed considerably among those aged 11–15 years.
Among children in UP who never enrolled in school, the main reasons cited for this were
“cannot afford” (60 percent) and “education not useful” (14 percent).
Some 7 percent of ever enrolled children left school before completing the primary level.
Enrollment in private schools increased from 31 to 37 percent for those 6 to 10 years old and from 37 to 45 percent for those 11 to 13 years old during 2000–2003. Government schools continue to be an important source of education for the poor, especially in rural areas.
Average per pupil expenditures on education are much higher for children enrolled in private vs. government schools, the gap being particularly high at the primary level. Even for those children attending government schools in UP, the total non-fee costs (books, uniforms, private tutoring) are quite high and constitute the bulk of the cost.
In 2003, the government’s scholarship and free textbooks programs were reaching, respectively, 18 and 27 percent of all students. These programs were reasonably well-targeted to the poor, though there appears to be some scope for reducing leakage to high-income groups.
Health (trends in the late 1990s early 2000)
The Infant Mortality Rate (IMR) in UP fell from 85 to 80 deaths per 1,000 live births between 1998 and 2002.
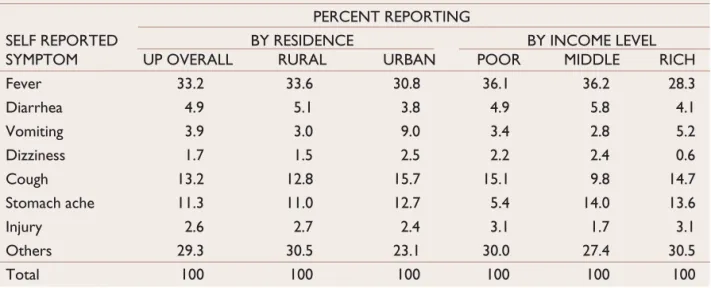
About 40 percent (61 percent in urban and 35 percent in rural areas) of those persons, who consulted any medical practitioner, consulted a formal private health provider, and 10 percent (10 percent in rural and 14 in urban areas) visited a government health facility. The rest sought consultations from private informal providers (quacks, traditional healers, etc.).
Both in rural and urban areas, the poor were less likely than the non-poor to seek consultation in the government health facilities.
One-third of those who reported being ill during the two weeks preceding the PSMS-II survey did not lose a single workday, while one-sixth reported a loss of more than eight workdays. The rest of the respondents lost from one to seven workdays.
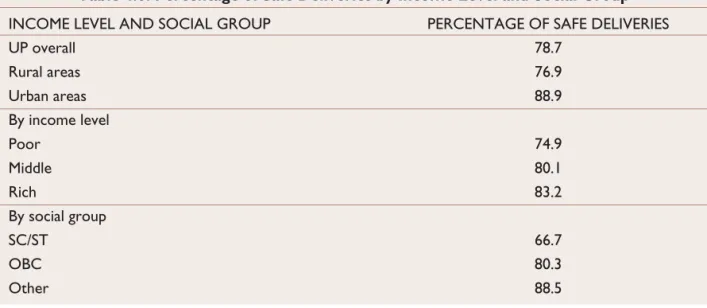
Almost 63 percent of all deliveries in UP were assisted by trained or traditional dai. Only 16 percent of all deliveries were institutional, with urban areas and rich individuals being more likely to report institutional delivery. Accordingly, almost 80 percent of all deliveries in the State could be considered safe deliveries. The proportion of safe deliveries in urban areas was about 90 percent compared to about 77 percent in rural areas.
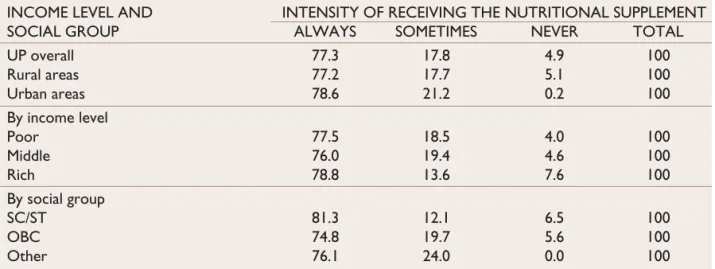
Between 1999–2000 and 2002–2003 anganwadi attendance increased from nearly no attendance to 10 percent of all children eligible by age. The anganwadi attendance among the poor is higher than among the rich (11.4 vs. 7.4 percent).
More than two-thirds of anganwadi-attending children receive food supplements ‘often’, 18 percent get them ‘sometimes’, and 5 percent
‘never’.
The prevalence of disability was measured as 0.21 percent among the general population (2001 Census) and as 0.13 percent (NSS 58).
Access to Amenities (trends between 1999/2000 and 2002/03)
In 2002/03, 57 percent of all dwellings were of pucca construction material, up from 42 percent in 1999/2000. Improvements in housing structure are registered both in urban and rural areas and across all income groups.
Hand-pumps increased in importance as the most common drinking water supply source in UP, with about three-quarters of the population in 2002/03 reporting this as their main water source.
There have been virtually no improvements in access to sanitation in UP over the period in question. Some 71 percent of UP’s population (85 in rural and 19 in urban) do not have access to latrines of any type.
In 2002/03, 35 percent of the state’s population had access to electricity, reflecting a much higher coverage rate of 80 percent in urban areas, but only 23 percent in rural areas. This represents a slight decline from 1999–2000 when 39 percent (84 in urban and 28 in rural) of the population had reported having electricity connection.
Only 10 percent of UP’s population reported having access to electricity for 15 or more hours per day in 2002/03. This also represents a slight worsening from 1999–2000 when 13 percent of the population reported so. The rates in rural areas are considerably lower than in urban areas.
Government Programs (trends between 1999/2000 and 2002/03)
In 2002/03, 66 percent of UP’s population had above-the-poverty-line (APL) cards, 21 percent
had below-the-poverty-line (BPL) cards, and 13 percent did not have any PDS card. This represents a decline in the share of BPL- cardholders in UP, and an increase in the proportion of the population without any cards compared to 1999/2000.
Out of all BPL-cardholders, 40 percent came from the poorest one-third of the population, 31 percent came from the middle third and 29 percent from the richest third. The Antyodaya Anna Yojana (AAY) scheme, which benefits 3 percent of the population, is better targeted towards the poor.
Overall, there has been some decline in the proportion of beneficiaries of various government programs (such as old age pension, disability pension, widowhood pension, benefits for pregnancy, subsidized credit and Jawahar Rozgar Yojana (JRY)/employment generation schemes).
The targeting of the subsidized credit program to the poor in rural areas has substantially worsened, while JRY/other employment programs tend to serve more poor and socially deprived in rural areas of the state. Their targeting has actually improved.
Almost 80 percent of the population is aware of the benefits of vaccination, 70 percent of the benefits of child immunizations, 73 percent know of family planning and 54 and 39 percent know the importance of iodized salt and ORS, respectively. There are large variations between urban and rural areas of the state, with urban areas having better knowledge.
Awareness of HIV/AIDS was found to be 50.1
percent in the state, showing a large gap in
awareness between urban and rural areas.
During most of India’s post-independence period, economic growth in Uttar Pradesh (UP) has lagged behind other states. The gap between UP and the rest of India widened substantially during the 1990s, as the annual growth rate of Gross State Domestic Product (GSDP) slowed down to over two percentage points per year slower than for India as a whole. Power shortages, low rates of capital formation and low productivity of existing irrigation systems and road networks, along with the underdevelopment of human capital were among the main causes of economic stagnation in UP, particularly in the agricultural sector. In 1999 the Government of Uttar Pradesh embarked upon a comprehensive reform program with assistance from the World Bank. Wide-ranging fiscal, governance, as well as sectoral reforms were initiated by the government. While the primary objective of the reform program was to address the fiscal crisis facing the state government,
1the reforms undertaken were also expected to have a significant impact on raising incomes and the standard of public service delivery, as well as on reducing poverty in the state. Since the actual impacts of reforms on the poor are complex and can be difficult to anticipate, a carefully designed monitoring system was needed to track changes both in outcomes (e.g., incomes, literacy, morbidity, etc.) as well as in key intermediate variables (e.g., access to services, infrastructure, etc.) that have an impact on living standards. In response, the GoUP, with the help of the WB, set up a Poverty Monitoring System (UP PSMS) in the UP, Department of Planning with the mandate to collect and process data on living standards and report the results.
1.1 The Poverty And Social Monitoring System In UP
The establishment of the PSMS by the GoUP was an important reform in itself, as it provided an important source of information to policymakers
at all levels of government for making better informed decisions regarding poverty reduction and social development initiatives. The objectives of the UP PSMS are fourfold:
To measure and monitor progress in key areas related to poverty and living standards of the population in the state;
In the context of ongoing reforms, to identify emerging problems that may have adverse impacts on the poor or other vulnerable groups;
To use this information to aid in making more informed policy decisions, also to improve the performance and accountability of public sector entities, particularly those providing services to the poor;
To keep the public better informed about progress as well as difficulties linked to achieving key development objectives in the state.
A broad set of economic and social monitoring indicators was agreed upon at the outset of the project. These indicators—which include conventional measures of economic growth and poverty, as well as human development outcomes, access to basic services and antipoverty programs, and measures of consumer awareness and satisfaction—were to be used to track progress at combating poverty in the state.
1.2 List of Monitoring Indicators
A specific set of poverty and social performance indicators reflecting the various dimensions of well- being was identified by the GoUP Planning Department following consultation with relevant line departments. Where feasible, it was agreed that indicators should be disaggregated by gender, social group, urban/rural and geographic region. These included:
1Cutbacks in grants from the central government, coupled with the adverse impact of a rising wage bill due to the 5th Pay Commission award, resulted in serious fiscal crisis for the UP government.
and Background
Consumption and Income Measures GSDP growth rates
Composition of household expenditures (food, priority non-food items)
Poverty headcount index, depth and severity of poverty
Employment and Wages
Wages for agricultural laborers, unskilled workers Prices for key food commodities, price index for poor
Employment status
Education Literacy rates School enrollments
School drop-out rates, school completion rates
Health
Percent immunized Infant mortality rates
Housing and Infrastructure
Proportion living in slums, unregulated settlements
Access to clean water and sanitation Access to electricity
Participation in Government Programs
Access to anti-poverty programs, social welfare schemes
Safe motherhood, use of antenatal care, deliveries attended by trained birth attendants Enrollment in adult, non-formal education Use of ICDS (anganwadi, balwadi program)
Public Health Knowledge, Awareness of Social Rights
Distance to Key Services and Facilities
Measure of Service Quality and Satisfaction
Health, education, water and sanitation
1.3 The PSMS Surveys, Rounds I and II
After several years of operation, the UP PSMS boasts a number of noteworthy achievements. The statistical capacity in the state has been substantially increased through a number of capacity-building activities (e.g., staff training, hardware and software upgrading), and district level data entry units have been set up. These measures have led to substantial improvements in the quality and timeliness of survey and district level administrative data.
Two special purpose surveys have been conducted by the PSMS. The first survey (a baseline) entailed adding a special purpose module (Poverty Module) to the state sample of the National Sample Survey (NSS) 55th Round and was completed from February–June 2000 (henceforth PSMS-I). Drawing upon the salient findings of PSMS-I, in October 2002 DES prepared a baseline report on poverty and living conditions that painted a broad picture of the status of the poor in Uttar Pradesh and how well they were being served by government services and programs. This report was widely disseminated and discussed throughout Uttar Pradesh, within and outside the government, to stimulate discussion on the performance of current policies and programs with respect to impacts on the poor. The second survey (henceforth PSMS-II) entailed adding a similar module to both the 58th and 59th rounds of the state sample and was completed in 2002/03.
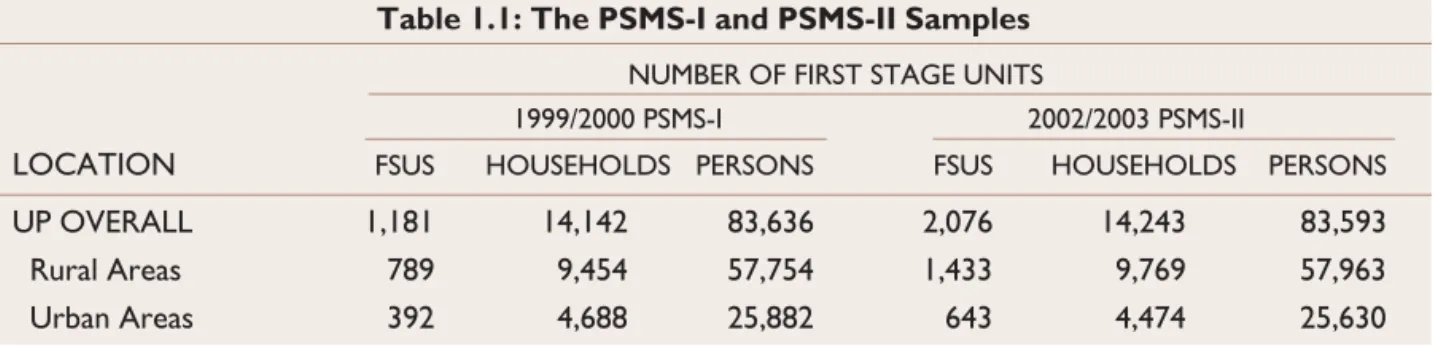
Table 1.1: The PSMS-I and PSMS-II Samples
NUMBER OF FIRST STAGE UNITS1999/2000 PSMS-I 2002/2003 PSMS-II
LOCATION
FSUS HOUSEHOLDS PERSONS FSUS HOUSEHOLDS PERSONSUP OVERALL 1,181 14,142 83,636 2,076 14,243 83,593
Rural Areas 789 9,454 57,754 1,433 9,769 57,963
Urban Areas 392 4,688 25,882 643 4,474 25,630
Source: PSMS-I & PSMS-II.
Both PSMS rounds were administered in large samples that were representative of the UP state as a whole, as well as at the rural and urban levels. Questionnaires were canvassed in over 14,000 households in each of the two rounds (Table 1.1). The PSMS-II questionnaire is presented here in Annex 3.
At the individual and household level, the PSMS surveys collected information on a wide range of activities using an integrated questionnaire (Table 1.2). The questionnaire comprised a number of different modules, each of which collected information on a particular aspect of household behavior and welfare. In particular, data were collected on the educational attainment, health status and employment activities of all household members. In addition, information was also collected on housing and amenities, vulnerability and asset ownership, and on household awareness and use of various government programs and services. Finally, the NSS schedule 1.0, which was canvassed with the PSMS schedules, collected data on the household’s consumption of goods and services in the past year.
This allows for the creation of aggregate consumption indicators and a ranking of individuals into different income groups (i.e., bottom one-third, middle one-third and top one-third as ranked by per capita annual household expenditures, separately for urban and rural areas). This, in turn, permits an analysis of how the above socioeconomic characteristics vary across different income groups in Uttar Pradesh.
1.4 Objectives and Scope of Analysis of the Report
Data collected by the PSMS surveys provide a valuable source of information to study a number of topics of interest from a policy perspective. In the interest of publishing the PSMS results as early as possible, this report is descriptive rather than analytic in its approach. It highlights the main changes in socioeconomic indicators that took place between the two PSMS surveys. Thus, indicators for primary education, primary health, water supply and sanitation, housing and amenities, etc. derived from the 2002/03 PSMS-II are compared with the 2000 PSMS-I. Given that the two PSMS rounds are large, complex household surveys that collect information on a number of different topics, main tabulations are presented in the main report and supplementary tabulations are in Annex 2. These tabulations comprise only a subset of the larger number of tables that could be prepared using data from these two surveys.
In addition to collating PSMS-I and PSMS-II data, this report uses a number of other data sources—
the 50
thround of the central sample of the National Sample Survey (NSS), 1992–93 and 1998–99 National Family Health Survey (NFHS-I and II), the 2001 Population Census, and the 1998–1999 Reproductive and Child Health Survey (RCH)—to bring additional insights to a wide range of poverty and human development indicators in Uttar Pradesh.
In the following five chapters, the report presents Table 1.2: PSMS Household Questionnaires for PSMS-I and PSMS-II
PSMS-I (1999/2000) PSMS-II (2002/03)
1. INDIVIDUAL INFORMATION 1. Household Roster
A: Household Roster 2. Education
B: Education 3. Health
C: Information on Children 0–5 years 4. Maternal and Child Health
D: Maternity History – All women aged 15–49 years 5. Activities – All persons 10 years and older E: Activities: All persons 10 years and older 6. Housing and Amenities
2. HOUSEHOLD INFORMATION 7. Vulnerability and Asset Ownership
A: Housing and Amenities 8. Government Programs and Services
B: Vulnerability and Asset Ownership 9. Irrigation and Extension Services
C: Government Programs and Services 10. Access to Facilities
salient findings pertaining to data collected through these surveys on various sectors (education, health, access to various government services and amenities, etc.). The questions underlying the contents of this report are the following:
Were the patterns of growth in Uttar Pradesh pro-poor?
Has headcount poverty declined over the 1990s and 2000s? Has the absolute number of poor declined?
Has access to basic services improved in the 2000s? What is the role of the private sector in delivering these services?
Have education and health outcomes improved?
If so, did they improve for the poor as well?
Did the housing situation improve?
Do the government-targeted programs reach
their intended beneficiaries?
2.1 State Domestic Product
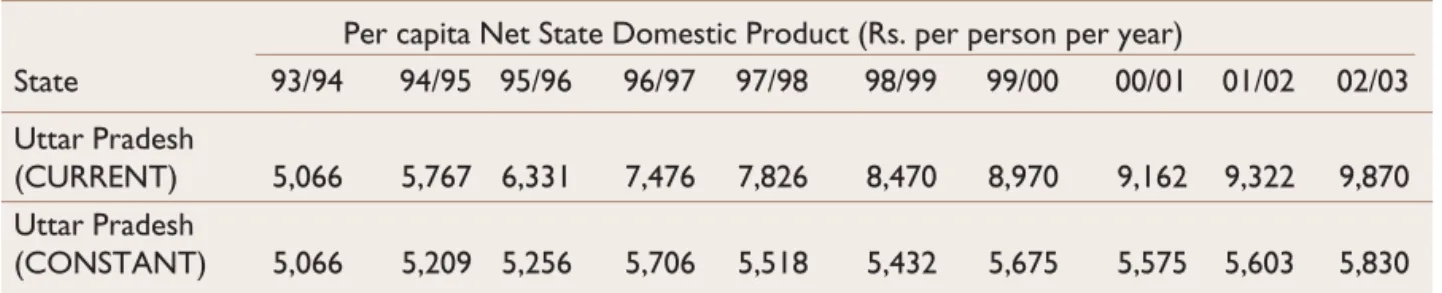
While during the 1980s UP’s economy grew at roughly the same rate as India overall (5.0 vs. 5.6 percent per annum growth of GSDP and GDP, respectively), its growth rate decelerated to 3 percent per annum over the 1990–95 period. Since then, the rate of growth of the state economy has picked up somewhat. As per data on State income provided by the UP DES, per capita net state domestic product for UP (UP NSDP) in current prices almost doubled from Rs. 5,066 in 1993/94 to Rs. 9,870 in 2002/03 (table 2.3).
2Taking into account the increase in price level over this period, the NSDP increased from Rs.
5,066 to Rs. 5,830, amounting to an increase of 1.4 percent per annum in real per capita terms—prima facie an indication of some improvement in average living standards in the state.
2.2 Per Capita Consumption
While data from the National Accounts provides
a useful indication of changes in average living standards over a given period, data from household surveys is needed to better ascertain how this increased aggregate output is distributed across the state’s population. In India, there is a longstanding tradition of using National Sample Survey data on consumer expenditure to assess changes over time in living conditions. An appropriate comparator for the 2002/03 PSMS Round II is the UP central sample of the 50
thround of NSS.
3To infer about the changes in living standards, the nominal monthly per capita expenditure MPCE needs to be adjusted for changes in the price level. This report uses the UP state-specific consumer price index for agricultural workers (CPIAL) for r ural households, and the state-specific consumer price index for industrial workers (CPIIW) for urban households to adjust 2002/03 expenditure
Poverty
Source: 2002/03 PSMS Round 2, 1993/94: NSS 50th Round central sample for UP.
2 http://indiabudget.nic.in/es2004-05/chapt2005/tab18.pdf.
3 The Central or State samples of the 55th NSS round conducted in 1999–2000 are not directly comparable with the 50th NSS round or with the PSMS-II because of the data recall issue in the consumption section. The 50th NSS round and PSMS-II are fully comparable.
0 200 400 600 800
Rupees per capita per month
1 2 3 4 5 6 7 8 9 10
2002/03 1993/94
Figure 2.1: Average MPCE in Uttar Pradesh by Decile Group
aggregates in rural and urban areas, respectively, into 1993/94 prices. Comparison of MPCE in real prices shows that average real MPCE has increased by 5 percent (5 percent in rural and by 4 percent in urban areas).
The patterns of increase in MPCE were pro-poor: data show that the MPCE for the poorest one-tenth of UP’s population increased by almost 30 percent from Rs. 118 per capita per month in 1993/94 to Rs. 151 in 2002/03. At the same time, real MPCE of the richest one-tenth of the population in UP had actually declined by 5 percent from Rs. 746 to Rs. 705 per capita per month over the same period (table 2.2).
2.3 Poverty Incidence
As per the official methodology of the GoI Planning Commission, the population with MPCE (as estimated by the NSS household consumption surveys) below the level defined by the official poverty line is counted as poor. The ratio of the population below the poverty line to the total population is called the poverty ratio, also known as the headcount ratio.
4Based on the official poverty line of Rs. 213.01 and Rs. 258.65 for rural and urban areas of UP respectively, official estimates placed
headcount poverty ratio in 1993/94 at 40.9 percent of UP’s population (42.3 percent rural, 35.1 percent urban).
5For the purposes of this report, the poverty line for 2002/03 has been derived using the procedure recently prescribed by the GoI Planning Commission. The procedure entails taking the Lakdawala Committee poverty line for UP and updating it by using the state-specific consumer price index for agricultural workers (CPIAL) for rural households, and the state-specific consumer price index for industrial workers (CPIIW) for urban households (Table 2.3).
6These updated poverty lines were then used in conjunction with the 2002/03 MPCE distribution to estimate the headcount poverty rate for this year.
Following this procedure, 29.2 percent of UP’s population (28.5 percent rural, 32.3 percent urban) was found to be below the poverty line in 2002/03 (Figure 2.2). A stronger fall in rural poverty as compared to urban poverty resulted in the pattern that urban poverty rate in the state now surpasses the rural poverty rate.
7Other measures of the depth and severity of poverty, such as the poverty gap and squared poverty gap measure, also show a clear fall
0 5 10 15 20 25 30 35 40 45
OVERALL RURAL URBAN
1993/94 2002/03
Figure 2.2: Headcount Poverty Rate in UP
(percent) Figure 2.3: Absolute Number of Poor in UP (million)
0 10 20 30 40 50 60
OVERALL RURAL URBAN
1993/94 2002/03
4 Report of the Expert Group on Estimation of Proportion and Number of Poor, Perspective Planning Division, Planning Commission, Government of India, New Delhi, July 1993.
5 Indian Planning Experience: A Statistical Profile. Please see http://www.planningcommission.nic.in/data/dataf.htm.
6 Poverty Estimates for 1999–00, Government of India Planning Commission Press Release: 22 February 2001.
7 Following the recommendations of the Lakdawala Committee, this report used CPIAL and CPIIW published by the Reserve Bank of India to update, respectively, rural and urban poverty lines. During the period between 1993/94 and 2002/03 these indexes showed a faster change in the price level for urban (78 percent) as compared to rural (62 percent) areas. Work is underway to calculate alternative rural and urban price indexes based on the data collected by the UP DES.
between 1993/94 and 2002/03, both in rural as well as in urban areas of Uttar Pradesh (Table 2.4).
Based on the poverty headcount rates derived above and population estimates for the two years, the change in the absolute number of people below the poverty line (in addition to the headcount poverty rate) can be estimated from the two survey rounds.
These data show that the absolute number of poor in UP fell from an estimated 59.3 million in 1993/
94 to 48.8 million in 2002/03 (table 2.4), with most of this decrease taking place in rural areas (see Figure 2.3).
2.4 Inequality and Distribution of Expenditures
Consistent with the trends in change in real MPCE across expenditure deciles, the Gini coefficient in UP overall declined from 0.305 to 0.282 between 1993–94 and 2002–03. Gini in rural areas declined from 0.293 to 0.221, while Gini in urban areas increased from 0.287 to 0.311. These patterns of similar growth in average MPCE across rural and urban areas and declining inequality in rural areas, with increasing inequality in urban areas explain the patterns of poverty trends across urban and rural areas.
Another measure of inequality, i.e., the distribution of total MPCE across deciles (table 2.5), confirms the patterns already seen: a decline in concentration
of wealth in the upper deciles of the distribution in rural areas, and the increased concentration in urban areas.
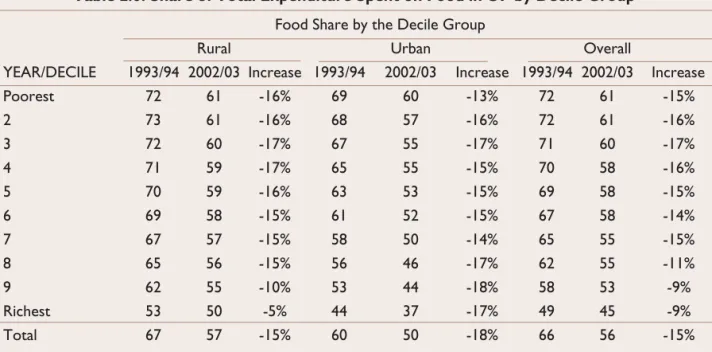
There has been a decline in the proportion of expenditure spent on food for both rural and urban areas, which according to the Engel’s law is consistent with the increase in income in UP (Engel’s law states that as incomes increase, the proportion of income spent on food falls). As expected, the food shares are higher in rural areas compared to urban areas (Table 2.6), but the magnitude of decline was lower in rural compared to urban areas. In terms of the change in the proportion of expenditure spent on food across expenditure deciles, in rural areas the decline was somewhat higher for the low-income households, while in urban areas the decline was higher for the higher-income households (Table 2.6).
Figure 2.4 shows the poverty incidence curves for the two surveys—i.e., the headcount poverty rate on the y-axis and different poverty lines on the x- axis. In other words, for every possible poverty line drawn up from the x-axis to the poverty incidence curve, the corresponding point of intersection on the y-axis gives the poverty headcount rate for this particular poverty line. The poverty incidence curve for rural UP for 2002/03 is everywhere to the right of that for 1993/94, indicating that no matter where the poverty line is drawn, the headcount rate is unambiguously lower in 2002/03 than in 1993/94.
Using a poverty line of Rs. 213.01 in 1993/94 prices,
Source: 1993/94: NSS 50th Round central sample for UP, 2002/03: PSMS Round 2
0.2.4.6.8 1
Headcount Rate
0 200 400 600 800 1000
Poverty Line (1993/94 prices) 2002/03 1993/94 UP Poverty Incidence Curves (Rural)
0.2.4.6.8 1
Headcount Rate
0 200 400 600 800 1000
Poverty Line (1993/94 prices) 2002/03 1993/94 UP Poverty Incidence Curves (Urban)
Figure 2.4: UP Poverty Incidence (rural and urban)
the headcount rate in rural UP fell from 42.3 percent in 1993/94 to 28.5 percent in 2002/03. However the urban poverty incidence curves for 1993/94 and 2002/03 are quite close to one another (especially in comparison to the rural poverty incidence curves).
Using a poverty line of Rs. 258.65 in 1993/94 prices, the decline in urban poverty between the two data points is therefore lower—from 35.4 percent in 1993/94 to 32.3 percent in 2002/03—than that observed in rural areas of UP.
Table 2.1: Per Capita Net State Domestic Product at Current/Constant Prices Per capita Net State Domestic Product (Rs. per person per year)
State 93/94 94/95 95/96 96/97 97/98 98/99 99/00 00/01 01/02 02/03 Uttar Pradesh
(CURRENT) 5,066 5,767 6,331 7,476 7,826 8,470 8,970 9,162 9,322 9,870 Uttar Pradesh
(CONSTANT) 5,066 5,209 5,256 5,706 5,518 5,432 5,675 5,575 5,603 5,830
Source: Revised Bulletin Number 292 “Estimates of State Income 1993/94–2003/04”, DES, UP. Summer 2004.
Source: NSS 50th round Central sample & PSMS-II.
Table 2.3: Poverty Estimates for Uttar Pradesh: 1993/94 and 2002/03 POVERTY ESTIMATES
1993/94 (50TH ROUND) 2002/03 (PSMS-II)
POVERTY MEASURE OVERALL RURAL URBAN OVERALL RURAL URBAN
Poverty Line (in nominal rupees) - 213.01 258.65 - 346.37 460.21
Headcount Poverty Rate (%) 40.9 42.3 35.1 29.2 28.5 32.3
Poverty Gap 10.1 10.4 9.0 5.1 4.7 6.5
Squared Poverty Gap 3.5 3.5 3.3 1.3 1.2 1.9
Source: NSS 50th round Central sample & PSMS-II.
Table 2.2: Average Monthly Real Per Capita Expenditures in UP by Decile Group Mean MPCE (Rs./person per month) by Decile Group
Rural Urban Overall
YEAR/DECILE 93/94 02/03 Increase 93/94 02/03 Increase 93/94 02/03 Increase
Poorest 118 152 29% 118 138 17% 118 151 28%
2 154 190 24% 154 174 13% 154 188 23%
3 179 212 19% 180 196 9% 179 210 18%
4 204 236 16% 204 215 5% 204 234 15%
5 231 257 11% 231 234 1% 231 253 10%
6 260 282 9% 261 258 -1% 260 279 7%
7 296 313 6% 295 286 -3% 295 308 4%
8 345 360 4% 345 331 -4% 345 353 2%
9 429 437 2% 432 403 -7% 430 428 0%
Richest 717 672 -6% 787 735 -7% 746 705 -5%
Average 274 289 5% 389 404 4% 296 311 5%
Table 2.4: Absolute Number of Poor in Uttar Pradesh: 1993/94 and 2002/03 POVERTY ESTIMATES
1993/94 (50
thROUND) 2002/03 (PSMS-II)
POVERTY MEASURE OVERALL RURAL URBAN OVERALL RURAL URBAN
Headcount Poverty Rate (%) 40.9 42.3 35.1 29.2 28.5 32.3
Number of Poor (millions) 59.3 49.5 9.9 48.8 38.4 10.3
Source: NSS 50th round Central sample & PSMS-II.
Table 2.6: Share of Total Expenditure Spent on Food in UP by Decile Group Food Share by the Decile Group
Rural Urban Overall
YEAR/DECILE 1993/94 2002/03 Increase 1993/94 2002/03 Increase 1993/94 2002/03 Increase
Poorest 72 61 -16% 69 60 -13% 72 61 -15%
2 73 61 -16% 68 57 -16% 72 61 -16%
3 72 60 -17% 67 55 -17% 71 60 -17%
4 71 59 -17% 65 55 -15% 70 58 -16%
5 70 59 -16% 63 53 -15% 69 58 -15%
6 69 58 -15% 61 52 -15% 67 58 -14%
7 67 57 -15% 58 50 -14% 65 55 -15%
8 65 56 -15% 56 46 -17% 62 55 -11%
9 62 55 -10% 53 44 -18% 58 53 -9%
Richest 53 50 -5% 44 37 -17% 49 45 -9%
Total 67 57 -15% 60 50 -18% 66 56 -15%
Source: NSS 50th round Central sample & PSMS-II.
Table 2.5: Distribution of Real Per Capita Expenditures in UP by Decile Group Distribution of MPCE (share of the total MPC in the sample) by Decile Group
Rural Urban Overall
YEAR/DECILE 1993/94 2002/03 Increase 1993/94 2002/03 Increase 1993/94 2002/03 Increase
Poorest 4.4 5.2 17% 4.3 4.1 -5% 4.4 4.9 11%
2 5.6 6.4 14% 5.4 5.2 -4% 5.6 6.1 9%
3 6.5 7.2 11% 6.2 5.9 -5% 6.4 6.9 7%
4 7.0 7.7 9% 7.0 6.6 -6% 7.0 7.4 5%
5 8.0 8.6 7% 7.8 7.5 -4% 7.9 8.3 4%
6 8.8 9.4 7% 8.8 8.4 -4% 8.8 9.1 4%
7 9.5 10.2 8% 10.1 9.8 -3% 9.6 10.1 5%
8 10.8 11.4 6% 11.7 11.7 0% 11.0 11.5 5%
9 12.6 13.7 8% 14.7 14.9 1% 13.1 14.0 7%
Richest 26.8 20.2 -25% 23.9 25.9 8% 26.1 21.7 -17%
Total 100.0 100.0 100.0 100.0 100.0 100.0
Source: NSS 50th round Central sample & PSMS-II.
3.1 Introduction
In terms of human development indicators, Uttar Pradesh lags behind most Indian states. As per the 2001 Population Census, UP’s literacy rate (57 percent) was lower than the national average (65 percent), and female literacy (43 percent) in particular was lower than all major states of India, except Bihar. At the same time, however, a comparison of the 1991 and 2001 census findings provides some grounds for optimism, as literacy rates in UP have been increasing faster than in India overall. The two PSMS survey rounds corroborate these findings of rising literacy among the population. Data from these surveys show that the literacy rate in Uttar Pradesh among the population aged 7 years and older rose from around 55 percent in PSMS-I to almost 60 percent in Round II (Table 3.1). Moreover, the rise observed in rural areas was slightly higher than that in urban areas, thus leading to a reduction overall in the rural-urban gap in literacy rates.
The Sar va Shiksha Abhiyan (SSA) is the Government of India’s flagship program to universalize Elementary Education in the country, and is being implemented in partnership with state governments. The program seeks to open new schools in those habitations which do not have schooling facilities and strengthen existing school infrastructure through the provision of additional class rooms, toilets, drinking water, maintenance grants and school improvement grants. Existing schools with inadequate teacher strength are provided additional teachers, while the capacity of existing teachers is being strengthened by extensive training, grants for developing teaching- learning materials and strengthening of the academic support structure at the cluster, block and district levels. The SSA has a special focus on girl’s education and children with special needs,
and seeks to bridge social, regional and gender gaps in educational attainments.
8Important objectives of the program include ensuring:
that all children complete five years of primary schooling by 2007
that all children complete eight years of elementary schooling by 2010
a bridging of all gender and social gaps at the primary stage by 2007, and
universal retention by 2010.
This chapter presents education data for Uttar Pradesh with respect to: literacy, school attendance, drop-outs and non-attendance, and general school characteristics. While most state education departments typically maintain elaborate education management information systems (EMIS) to track such information, household survey-based estimates provide a very useful means to cross-check the accuracy of reported statistics. In fact, the latter estimates have three main advantages over the former with respect to overall quality. First, unlike most EMIS where the coverage of private school tends to be much poorer than that of government schools, the survey-based estimates include data on private as well as government schools. Second, because EMIS use school-based data, they can only guess the number of children who ought to be in school, but who are not (typically using projections based on census data). Third, since departmental and school budgets tend to be linked to the total number of children in the system, lower-level government officials have an incentive to exaggerate the number of enrolled children when reporting to the EMIS (household survey interviewers don’t have any such adverse incentive).
8 For more details on the SSA, please see http://ssa.nic.in/.
3.2 School Attendance, Completion and Drop-out Rates
Data from the two PSMS rounds provide some encouraging findings with regard to rising school enrollment among the target-age children at the primary, middle and secondary levels in Uttar Pradesh (Figure 3.1).
9School enrollment among children aged 6–10 years increased by about 12 percentage points, from 67 percent in Round I to 79 percent in Round II. Similarly, school enrollment among 11–13-year-olds increased from 71 to 77 percent, while that for children aged 14–15 years crept up from 58 to 60 percent over the same period.
School enrollment rates have increased in both urban and rural areas, and for both boys and for girls (Table 3.2).
The pattern of rising school enrollment in the state is supported by evidence of the improved educational attainment of the population as a whole (Figure 3.2). For instance, among UP’s overall population aged 18 years and older, the share that has never attended school fell from 54 percent to 49 percent between Rounds I and II. Similarly, the proportion of the adult population that has completed secondary or higher (i.e., class 10 and above) increased from 20.3 percent to 21.5 percent (Table 3.3) during this period.
Prominent among the various monitoring targets set by the GoI Planning Commission for the 10th Plan period is the goal of ensuring that all children in
India complete at least five years of schooling by the year 2007 (i.e., that they attain at least a primary school level of education). Clearly getting all children to enroll in school is an important first step towards achieving this goal, but is not enough by itself: all children who start school must be retained in the schooling system until they have completed the requisite primary school cycle. Data from both PSMS rounds indicates that the educational system in UP is doing quite well in this respect. Defining the primary school drop-out rate as the proportion of school-starters who leave school before completing primary school, the primary school drop-out rate among children aged 11–15 years was found to be 4.8 and 7.2 percent in PSMS I and II respectively (Table 3.4). Accordingly, to achieve universal primary school completion rates by 2007, the key policy challenge for GoUP policymakers is not necessarily school retention per se, but rather one of ensuring that all children in the state start school.
0 10 20 30 40 50 60 70 80
6 -10 yea rs 11 -13 years 14 -15 years PSM S -I PSMS -II
Figure 3.1: Children’s School Enrollment in UP (percent)
PSMS-I 20.3
10.4 10.0 5.8 53.6
Never Attended < Primary Primary Middle Secondary or Higher
PSMS-II 21.5
6.3
49.3 12.5 10.4
Never Attended < Primary Primary Middle Secondary or Higher
Figure 3.2: Highest Educational Attainment for Population Aged 18 and Above
9 As per the official definitions, the target age groups at the primary, middle and secondary level are taken to be children aged 6–10 years, 11–13 years, and 14–15 years, respectively.
Do enrollment rates of 78–79 percent among 6–
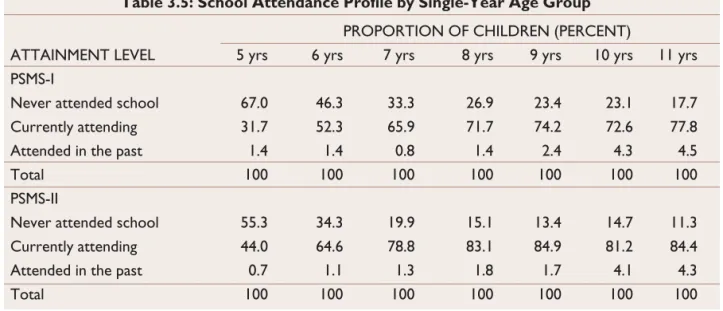
10-year-olds mean that one-fifth of all children in UP receive no schooling? Not necessarily—as Figure 3.3 shows, the age of entry into schooling in the state appears to be a bit higher than the six year target of policymakers. By age 9, roughly 85 percent of children in UP enroll in school (Table 3.5).
Why do 15 percent of children in UP never attend schools? In the PSMS-II round, all children aged 5 to 18 years who never attended school were asked the two main reasons why they did not. ‘Cannot afford it’ (59.7 percent) and ‘education not useful’
(14.4 percent) were the two main reasons cited for not attending school (Table 3.6).
3.3 Characteristics of School Enrollment by Region, Income and Gender
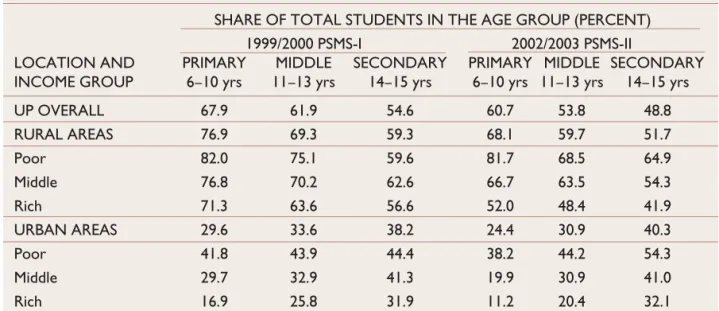
An encouraging finding of PSMS-II has been the virtual elimination of the rural-urban gap in enrollment rates in UP among children aged 6–10 years (i.e., from a 9 percent gap in Round I to less than one percent in Round II). Similarly, the rural- urban enrollment gap for children aged 11–13 years
has also narrowed somewhat over this period (Figure 3.4). Finally, while the rural-urban gap in enrollment has actually risen for children aged 14–15 years during the two rounds, this is mainly because of a sharp rise in enrollment in urban areas rather than due to a decline in enrollment in rural areas (Table 3.7).
As one might expect, the survey data from both rounds clearly show that there is a strong positive relationship in UP between school attendance and household income (see Figure 3.5). In other words, the richer the household, the more likely it is that its members are attending school. For example, on dividing the overall population of rural Uttar Pradesh into three equal groups ranked by income level,
100%
20%
40%
60%
80%
100%
5 yrs 6 yrs 7 yrs 8 yrs 9 yrs 10 yrs 11 yrs
Currently attending Attended in the past Never attended school
Figure 3.3: School Attendance Profile by Age (PSMS-II)
-1 1 3 5 7 9 11 13 15
6-10 years 11-13 years 14-15 years
PSMS -I PSMS - II
Figure 3.4: Rural-Urban Gap in Enrollment (percent)
10 Throughout this report, per capita monthly household expenditures derived from the NSS schedule 1.0 are used as the preferred welfare metric to rank households by income level in rural and urban areas separately.