Circumstellar Disks: the cases of HD 179218 and Epsilon Eridani
INAUGURAL-DISSERTATION
zur
Erlangung des Doktorgrades
der Mathematisch-Naturwissenschaftlichen Fakult¨at der Universit¨at zu K¨oln
vorgelegt von
Anas Salman Taha AL-Maothani aus Bagdad, Irak
K¨oln 2019
Tag der letzten m¨undlichen Pr¨ufung: Januar 2018
beloved wife “Shaymaa”, my daughters “Qabas, Elaf”, and my little son
“Sadeem–(Nebula in Arabic)”.
Seit Kurzem erlauben uns große erdgebundene Teleskope und die neue Genera- tion von astronomischen Instrumenten die Umgebung von jungen Sternen mit hoher r¨aumlicher Aufl¨osung zu untersuchen. Detektoren im mittleren Infrarot (MIR) (7.5 - 25 Mikrometer) an Teleskopen mit Spiegeldurchmessern in der Gr¨oßenordnung von 10m wurden ausgiebig genutzt, um die Eigenschaften protoplanetarer und Tr¨ummer- scheiben durch ihre vom Staub erzeugte thermische Emission zu untersuchen.
Diese Instrumente k¨onnen die ben¨otigten Aufl¨osungen unter einer Bogensekunde mit einem ausreichenden Gesichtsfeld erreichen, um die Scheibenstrukturen auf unter- schiedlichen Skalen von wenigen bis zu einigen zehn astronomischen Einheiten (AE) zu untersuchen.
Solche Beobachtungen werden benutzt, um die Entwicklung der zirkumstellaren Scheiben zu untersuchen, die Existenz von L¨ucken in protoplanetaren Scheiben um Herbig Sterne zu best¨atigen und den evolution¨aren Zusammenhang zwischen flachen und sich aufgeweiteten Scheiben zu studieren. Dar¨uber hinaus k¨onnen sie uns mit mehr Details ¨uber die Geometrie der Scheibe, Staubeigenschaften und die Entstehung von Planeten versorgen. Auch k¨onnen diese Beobachtungen dazu verwendet werden, die Tr¨ummerscheiben um Hauptreihensterne zu analysieren und den Ursprung der Staube- mission in Tr¨ummerscheiben zu lokalisieren, um die Beziehung zwischen dieser Emis- sion und Planeten zu kl¨aren.
Diese Dissertation besteht aus den folgenden zwei Teilbereichen:
Erstes Projekt: Das Hauptziel dieses Projektes ist es, die Eigenschaften der Poly- cyclic Aromatic Hydrocarbons (PAH) Emission und die physikalische Struktur der Scheibe um den Herbig Stern HD 179218 zu untersuchen. Ich habe hierzu MIR Bilder im PAH1(8.6µm), PAH2(11.3µm), and Si6(12.5 µm) Filter sowie niedrig aufgel¨oste spektroskopische Daten im N-Band von HD 179218 benutzt, die mit dem CanariCam Instrument am 10.4 m grossen Gran Telescopio Canarias (GTC) aufgenommen worden sind.
Die FWHM der Bilder wurde in jedem der drei Filter gemessen. Durch gute Beobachtungsbedingungen w¨ahrend der Datennahme konnten stabile Messungen mit durchschnittlichen FWHM Werten von 0.23200, 0.28000, und 0.9300in den PAH1, PAH2 beziehungsweise Si6 Filtern erhalten werden. Diese Daten zeigen, dass die Emission der Scheibe in den PAH Filtern r¨aumlich aufgel¨ost ist, w¨ahrend sie im Si6 Filter nicht
Subtraktion der PSF f¨ur das Objekt und den Kalibrator durchgef¨uhrt habe.
Die photometrischen Messungen sind mit bereits ver¨offentlichten Flussdichten auch ohne große Variabilit¨at bei den Unsicherheiten konsistent. Dar¨uber hinaus ist die Form des Spektrums mit niedriger Aufl¨osung, außer in dem Bereich des Ozonbandes der Erde, vergleichbar mit den vorheriger Beobachtungen der Spitzer und ISO Weltraumte- leskope.
Zus¨atzlich habe ich ein 3D Strahlungstransportmodell der Kontinuumsemission der protoplanetaren Scheibe mit Hilfe des Codes RADMC3D erstellt. Das Modell basiert auf einer Scheibe mit einer L¨ucke, um die spektrale Energieverteilung und das ra- diale Helligkeitsprofil von HD 179218 bei 12.5 Mikrometern zu reproduzieren. Die physikalischen Eigenschaften wie Masse, Gr¨oße und chemische Zusammensetzung der Vor- ¨Ubergangsscheibe wurden aus diesem Modell erhalten. Dies ist das erste Mal dass HD 179218 in einem PAH Filter beobachtet und r¨aumlich aufgel¨ost wurde.
Schließlich diskutiere ich den Ursprung der PAH Emission in der protoplanetaren Scheibe von HD 179218, indem ich die Bilder und spektroskopischen Daten mit IRS 48 und HD 97048 vergleiche. Die wahrscheinlichste Erkl¨arung ist, dass die PAH Emis- sion aus einem ¨außeren Radius der aufgeweiteten Scheibe stammt, welches sich auf- grund der starken UV-Strahlung des Zentralsterns (180 L) zumeist in einem ion- isierten Zustand befindet.
Zweites Projekt: Der Hauptzweck dieses Projekts is die Untersuchung des war- men Staubs in der Tr¨ummerscheibe und dem exozdiokalen Staub um den Hauptreihen- stern Epsilon Erdiani.
Hochaufl¨osende Bilder im Q-Band wurden mit dem GTC/CanariCam aufgenom- men. Um die Unterscheidung zwischen Stern und Scheibe zu verst¨arken und Beugungs- limitierte Beobachtungen zu erhalten haben wir den Q4 Filter (20.5 Mikrometer) gew¨ahlt.
Die MIR Bilder von Epsilon Eridani wurden mit einem Kalibratorstern (Gamma Eri- dani) verglichen. Wegen schlechter Seeing Bedingungen (> 100) ist die FWHM sehr unsicher.
Daraus folgend sind mehr als die H¨alfte der FWHM Messungen des Sterns un- terhalb des Beugungslimits des Teleskops im Q4 Filter. Ich habe daher verschiedene Techniken benutzt um die Qualit¨at der Frames zu begutachten.
Die erste Technik ist der Vergleich der FWHM jedes “Savesets” des Kalibrationssterns
3σ Unsicherheit besitzt. Anschließend habe ich eine visuelle Selektionstechnik ver- wendet, um gute und schlechte “Nodsets” zu unterscheiden und damit die Auswahl elongierter Punktspreizfunktion (PSF) zu vermeiden. Mit dieser Technik best¨atigen sich die mit den anderen Techniken erzielten Resultate: die ausgedehnte Emission der Tr¨ummerscheibe von Epsilon Erdiani ist mit ∼ 180 mas mit einer Unsicherheit von 3σ berechnet. Ein Temperaturgradientenmodell wurde kreirt, um ein synthetisches Bild von Epsilon Erdiani zu erzeugen, es mit dem Kalibrationsbild zu falten und es schließlich mit dem radialen Helligkeitsprofil des wissenschaftlichen Bildes zu vergle- ichen.
Nach der Durchfhrung photometrischer Berechnungen erhilte ich einen Flusswert von 2.5 Jy im Q4 Filter, welcher mit Literaturwerten vergleichbar ist. Die Resultate der Beobachtungen lassen vermuten, dass die radiale Position des Staubs vergleichbar mit dem Planetenorbit ist und dass die Staubverteilung durch die Interaktion mit dem Planeten entscheidend beeinflusst wird.
Recently, large ground-based telescopes and the new generation of astro- nomical instrumentation have allowed us to examine the environments of young stellar objects with high angular resolution. Mid-infrared (MIR) (7.5 - 25 micron) detectors mounted on 10 m class telescopes have been used extensively to study the properties of protoplanetary and debris disks through their thermal emission that comes from the dust.
These instruments can achieve sub-arcsec resolution with a suitable field- of-view for investigating the disk structures on different scales from few to tens of astronomical units (AU).
Such observations are used to study the evolution of the circumstellar disk, confirm the presence of gaps in the protoplanetary disks, and investigate the evolutionary connection between flared and flat disks. Moreover, they can provide us with more details about the geometry of the disk, dust prop- erties, and how planets form. These observations can also be used to ana- lyze the debris disk around main sequence stars and trace the origin of the dust emission to clarify the relation between the dust emission and planets in debris disks.
There are two main projects in this dissertation:
First project: The main goal of this project is to investigate in the MIR the properties of the Polycyclic Aromatic Hydrocarbons (PAH) emission and the physical structure of the disk of the Herbig star HD 179218. I used MIR images in the PAH1(8.6µm), PAH2(11.3µm), and Si6(12.5µm) fil- ters, and N-band low-resolution spectra of HD 179218, using the Canari- Cam instrument on the 10.4 m Grand Telescopio Canarias (GTC).
The FWHM of the images was measured in each of the three filters. Good observing conditions led to very stable measurements during the observa- tion with average FWHM values of 0.23200, 0.28000, and 0.29300 in filters
filter. I have extracted a lower limit for the angular diameter of the emis- sion in the PAH band of∼ 100 mas, (or 40 AU) by applying a quadratic subtraction of the PSF for the science and calibrator.
The photometric measurements are consistent with published flux densi- ties and without noticeable variability in the uncertainty. Besides that, the low-resolution spectrum result is comparable with the shape of the previ- ous result using Spitzer and ISO space telescopes, except in the region of the Earth ozone band.
Additionally, I built a 3-D radiative transfer model of the continuum emis- sion of the protoplanetary disk using the code RADMC3D. The model is based on a disk with a gap to fit the observational spectral energy dis- tribution and the radial brightness profile of HD 179218 at 12.5µm. The physical properties such as the mass, size and chemical composition of the pre-transitional disk were derived from the model. This is the first time that HD 179218 is observed in the PAH filter and is spatially resolved.
Finally, I discuss the origin of the PAH emission in the protoplanetary disk of HD 179218 by comparing the images and spectroscopic data with IRS 48 and HD 97048. The most likely explanation is that the PAH emis- sion originates in the outer radius of the flared disk surface, and is mostly in an ionized charged state due to the strong UV radiation of the central star (180 L).
Second project: The main purpose of this project is to investigate the origin of the warm dust in the debris disk and of the exozodiacal dust around the main-sequence star Epsilon Eridani.
High-resolution direct imaging in the Q-band using GTC/CanariCam in- strument was performed to enhance the star-to-disk distinction and obtain diffraction limited observations, we select the Q4 filter (20.5 µm). The MIR images of Epsilon Eridani were compared with a calibration star (Gamma Eridani). Due to poor seeing condition (> 100) the FWHM is very unstable.
filter. Therefore, I used different techniques to examine the quality of good frames.
The first technique is to compare the FWHM of each saveset of the cali- bration star and science star to the 1σ, 2σ, and 3σlevels. The result of this technique shows that the extended emission around Epsilon Eridani mea- sures 200 mas with 3σuncertainty. The second technique is to compare the FWHM measurements of each nodset (instead of the saveset) for the science star with a limit of 1σ, which shows a resolved disk emission with a diameter of 120 mas with 3σuncertainty. Then, I used a visual selection technique to separate the good and bad nodsets to avoid electing elongated point-spread function with this technique and other two techniques are confirmed the results of found extend emission around Epsilon Eridani.
The extended emission is estimated to be∼180 mas with 3σuncertainty.
A temperature gradient model has been built to create a synthetic image of Epsilon Eridani, convolve it with the calibration image and then fit it with a radial brightness profile of the science image.
Photometric calculations were performed and I obtain a flux value com- parable to literature value in the Q4 filter of∼ 2.5 Jy. The observational result suggests that the radial position of the dust is comparable with the planetary orbit and that the dust distribution is significantly shaped by the interaction with the planet.
List of Figures xi
List of Tables xv
1 Motivations and structure of the thesis 1
2 Introduction and Background 3
2.1 Introduction to Star Formation . . . 3
2.2 Protoplanetary Disk . . . 10
2.3 Debris Disk . . . 17
2.4 Planet Formation . . . 25
3 Observation and Data Reduction 27 3.1 Atmospheric Transparency . . . 27
3.2 Precipitable Water Vapour . . . 28
3.3 Sky and Telescope Emission . . . 29
3.4 Point Spread Function . . . 31
3.5 High Angular Resolution . . . 32
3.6 Diffraction and Seeing Limit . . . 34
3.7 Ground-Based Telescope . . . 34
3.7.1 The CanariCam Instrument . . . 36
3.7.2 Observing Modes of the Telescope . . . 37
3.7.2.1 Imaging Mode . . . 37
3.7.2.2 Spectroscopy Mode . . . 39
3.7.2.3 Polarimetry Mode (Dual-beam polarimetry) . . . . 41
3.7.2.4 Coronagraph Mode . . . 42
3.8 Observation Technique . . . 43
3.8.1 Chop - Nod . . . 43
3.9 Data Reduction . . . 44
3.10 Calibration Stars . . . 45
4 Characterization of the Pre-transitional Disk for HD 179218 47 4.1 Introduction . . . 47
4.2 HD 179218 Target . . . 49
4.3 Observation and Data Reduction . . . 51
4.4 Statistics of the Full Width at Half Maximum . . . 53
4.5 Centering the images and a cumulative of the PSF . . . 57
4.6 Photometry and Spectroscopy of HD 179218 . . . 64
4.7 Radiative Transfer Model RADMC3D Code . . . 67
4.7.1 Stellar Parameters . . . 70
4.7.2 The Disk Structure . . . 72
4.7.3 The Inner Disk . . . 73
4.7.4 The Outer Disk . . . 75
4.7.5 The Gap . . . 79
4.8 Best Models Fitting . . . 81
4.8.1 Model-1 . . . 82
4.8.2 Model-2 . . . 87
4.9 The Radial Brightness Profile Model Fitting . . . 89
4.10 Comparing HD 179218 with HD 97048 . . . 91
4.11 PAHs Charge State in the HD 179218 . . . 93
5 Spatially Resolved Imaging of the Debris Disk for Epsilon Eridani 95 5.1 Introduction . . . 95
5.2 Epsilon Eridani Target . . . 96
5.3 Observation and Data Reduction . . . 98
5.4 Full-Width-at-Half-Maximum . . . 99
5.4.1 FWHM Measurements of Savesets . . . 99
5.4.2 FWHM Measurements of Nodsets . . . 103
5.4.3 FWHM Measurements of Ellipticity Selection . . . 108
5.4.4 FWHM Measurements of Visual Selection . . . 108
5.5 MIR Data Reduction . . . 113
5.6 Radial Profiles . . . 115 5.7 Disk Model . . . 116 5.8 Photometry Measurements for Epsilon Eridani . . . 118
6 Conclusions and Prospects 121
6.1 Introduction . . . 121 6.2 Characterization of the Pre-transitional Disk for HD 179218 . . . 121 6.3 Spatially Resolved Imaging of the Debris Disk for Epsilon Eridani . . 127 6.4 Prospects . . . 130
References 131
2.1 Orion Nebula . . . 5
2.2 Diagram of Star Formation Process . . . 7
2.3 Scheme of the Spectral Energy Distribution for the Young Stellar Objects. 9 2.4 Scheme illustrates the protoplanetary disk structure and the different high angular resolution telescopes. . . 11
2.5 Spectral Energy Distribution of the Herbig system. . . 13
2.6 Image of HD 97048 in the PAH filter and IR spectrum of the PAH molecular in the Iris nebula. . . 15
2.7 Dust emission in the debris disk. . . 17
2.8 Spectral Energy distribution of the Fabulous four. . . 18
2.9 Beta Pictoris images from different telescopes. . . 19
2.10 The relation between the mass and the age of the debris disk. . . 20
2.11 The fractional lminosity of the debris disk. . . 21
3.1 The sky transmission model for the MIR wavelengths. . . 28
3.2 The water vapour effect on the sky transmission for N and Q bands. . 28
3.3 Sky emission and telescope emission for CanariCam instrument. . . . 30
3.4 Light wavefront progression. . . 31
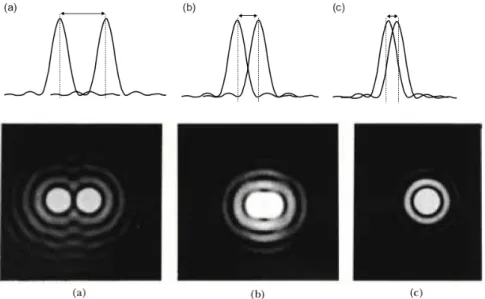
3.5 Plot the PSF of two sources. . . 33
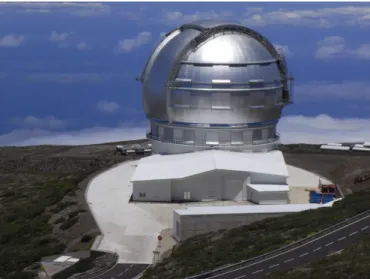
3.6 Image of the GTC telescope in La Palma, Spain. . . 35
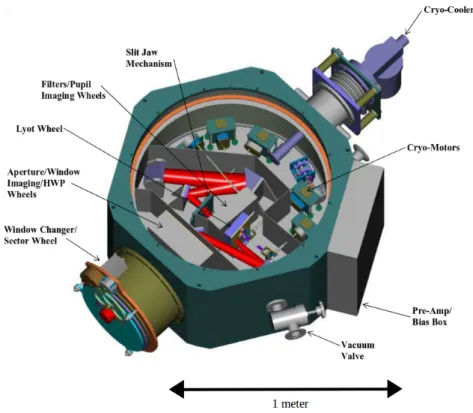
3.7 CanariCam dewar. . . 37
3.8 Optical system for CanariCam in the imaging mode. Image credit: GTChttp://www.gtc.iac.es/instruments/canaricam/canaricam. php. . . 38
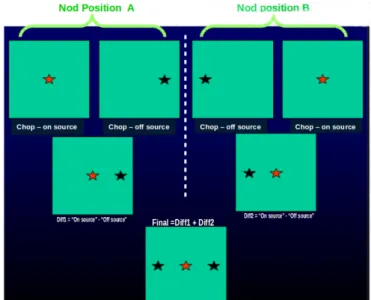
3.9 Illustration of chop-nod technique in the GTC telescope. Image credit:
GTChttp://www.gtc.iac.es/instruments/canaricam/canaricam.
php . . . 44
3.10 Interface window for the iDealCam . . . 46
4.1 Scheme for the HD 179218 protoplanetary disk . . . 50
4.2 FWHM measurements for all savesets for science and calibration stars in PAH1, PAH2 and Si6 filters. . . 54
4.3 Accumulative of the FWHM for both calibration stars and science star (HD 179218) in PAH1, PAH2 and Si6 filters. . . 60
4.4 The final images of the HD 179218 in PAH1, PAH2, and Si6 filters. . 61
4.5 Radial brightness profiles plots for science and two calibration stars in three filters. . . 63
4.6 Stability of the flux for science and calibrator stars in the three filters. 65 4.7 HD 179218 spectrum by GTC/CanariCam, Spitzer and ISO. . . 67
4.8 Plots of the absorption and scattering cross section mass of graphite and silicate. . . 70
4.9 HD 179218 pre-transitional disk components. . . 72
4.10 The model of the SED for HD 179218 and change the inner disk pa- rameters. . . 74
4.11 The influence of the crystalline enstatite abundance on the shape of the SED. . . 75
4.12 Change the outer disk size. . . 76
4.13 Change the power law of the surface density for the outer disk. . . 76
4.14 Change the dust scale height of the outer disk. . . 77
4.15 Change the mass in the outer disk. . . 78
4.16 The two type of flaring influences on the outer disk. . . 78
4.17 The influence of the inner radius of the outer disk on the shape of the SED and the radial brightness profile of the convolved image. . . 79
4.18 The influence of the mass in the gap on the shape of the SED. . . 80
4.19 The influence of the power law of the gap on the shape of the SED. . . 80
4.20 The model of the SED for HD 179218 with and without one of its components. . . 81
4.21 Non-reduced Chi-square table to fit the SED with different values of
parameters p, Rin, Rout. . . 84
4.22 The model-1 SED fitting and synthetic image for the HD 179218 system. 85 4.23 The radial integrated optical depth at 12.5µmfor the HD 179218 system. 85 4.24 The model-2 SED fitting and synthetic image for the HD 179218 system. 87 4.25 The radial profile of the science, calibrator stars and the model in three filters PAH1, PAH2 and Si6. . . 90
4.26 Hybird model based on a Gasussian disk and an uniform disk model. . 91
4.27 Normalized intensity profiles of HD 97048 in the PAH2 and SIV bands. 92 4.28 PAH spectrum for ionized and neutral state charge. . . 93
4.29 PAH emission models for IRS 48 and HD 179218. . . 94
5.1 Model of the debris disk, SED and image for Epsilon Eridani . . . 97
(a) . . . 97
(b) . . . 97
(c) . . . 97
5.2 The FWHM for each savesets for Epsilon Eridani . . . 99
5.3 FWHM savesete smeasurements 1, 2, 3 Sigma for Epsilon Eridani. . . 101
5.4 Images for one nodset and one savesets . . . 103
5.5 FWHM measurements for each savesets-nodsets-savesets for Epsilon Eridani . . . 104
5.6 FWHM measurements nodsets 1, 2 and 3 sigma for Epsilon Eridani . 106 5.7 Visual selection for a good savesets and nodsets. . . 109
5.8 The final FWHM average for Gamma and Epsilon Eridani. . . 110
5.9 Final image after stacking for Epsilon Eridani . . . 113
5.10 Frame-2 crop image before and after removed stripes . . . 114
(a) . . . 115
5.11 Radial profiles of the Epsilon Eridani and Gamma Eridani in the Q4-filter.116 (b) . . . 116
5.12 Epsilon Eridani disk model and plot of profiles. . . 117
5.13 Photometry variation during observation for Epsilon Eridani and two reference stars. . . 120
5.14 Final photometry calibration result for Epsilon Eridani. . . 120
2.1 Debris disk detection rate with wavelength. . . 23 3.1 Theoretical of the diffraction limit of GTC in each filter FWHM, sen-
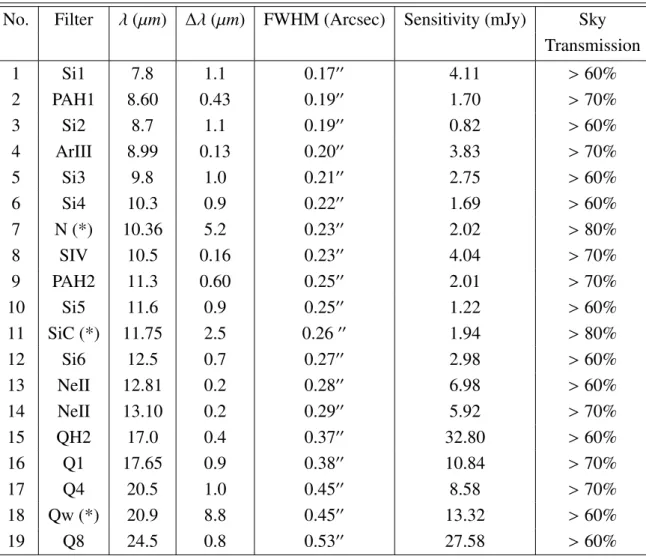
sitivity, and sky transmission. . . 39 3.2 CanariCam instrument filters and FWHM of observed object HD 3712. 40 3.3 Slit width and wavelength for CanariCam. . . 41 3.4 Polarization efficiency for Silicate filters . . . 42 4.1 Summery of previous observations for HD 179218 using different wave-
lengths and different ground-based telescopes. . . 51 4.2 Observing log. for the science target and for the two calibration stars
in the PAH1, PAH2 and Si6 filters. . . 52 4.3 The mean of FWHM and 3 sigma uncertainty for science and calibrator
stars from Lorentzian fit. . . 55 4.4 The criteria for resolve the disk around HD 179218. . . 56 4.5 Disk emission diameter . . . 57 4.6 The FWHM and 3 sigma uncertainty for science and calibrator stars
from the radial profile plot. . . 58 4.7 The criteria for resolve disk around HD 179218 after stacking all good
savesets. . . 58 4.8 Disk emission diameter after re-centering and stacking savesets. . . . 59 4.9 Percentage of flux stability for calibrator and science stars during ob-
servation. . . 64 4.10 Photometric measurements for science and calibrator stars in three filters. 66 4.11 Stellar parameters for HD 179218 used to fit two models of the disk. . 71 4.12 The disk parameters for the Model-1 fitting. . . 86
4.13 Table of the disk parameters for the Model-2 fitting. . . 88
5.1 Summary of observations of the science target Epsilon Eridani and reference stars Gamma Eridani on 6thof January 2013. . . 98
5.2 FWHM measurements for savesets before and after applying a condition.100 5.3 FWHM measurements for savesets 1-Sigma. . . 102
5.4 FWHM measurements for savesets 2-Sigma. . . 102
5.5 FWHM measurements for savesets 3-Sigma. . . 103
5.6 FWHM measurements for nodsets before and after discarding frames. 105 5.7 FWHM measurements for 1-Sigma. . . 107
5.8 FWHM measurements for 2-Sigma. . . 107
5.9 FWHM measurements for 3-Sigma. . . 107
5.10 FWHM measurements selected by Ellipticity criteria. . . 108
5.11 FWHM measurements selected by visual. . . 110
5.12 Resolved and unresolved disk around Epsilon Eridani. . . 111
5.13 The radius of the disk at around Epsilon Eridani in Q4 filter. . . 112
GMC Giant Molecular Clouds SFR Star Forming Regions HST Hubble Space Telescope ZAMS Zero-Age Main Sequence YSOs Young Stellar Objects SED Spectral Energy Distribution IR Infrared
NIR Near-Infrared MIR Mid-Infrared FIR Far-Infrared
CTTs Classical T-Tauri Stars WTTs Weak T-Tauri Stars PMS Pre-Main Sequence
PAH Polycyclic Aromatic Hydrocarbons ISM Interstellar Medium
VLT Very Large Telescope
VISIR VLT Imager and Spectrometer for mid Infrared
STIS Space Telescope Imaging Spectrograph
COMICS Cooled Mid-Infrared Camera and Spectrometer T-ReCS Thermal-Region Camera Spectrograph
EKB Edgeworth-Kuiper Belt
IRAS Infrared Astronomical Satellite WISE Wide-field Infrared Survey Explorer
FEPS Formation and Evolution of Planetary Systems
DEBRIS Disk Emission via a Bias Free Reconnaissance in the Infrared/Sub-millimeter
DUNES DUst around NEarby Stars APEX Atacama Pathfinder Experiment
SONS SCUBA-2 Observation of Nearby Stars JCMT James Clerk Maxwell Telescope
CHARA Center for High Angular Resolution Astronomy PWV Precipitable Water Vapor
GPS Global Positioning System
ORM Observatorio del Roque de los Muchachos GTC Gran Telescope Canarias
PSF Point Spread Function
OSIRIS Optical System for Imaging and low-Intermediate-Resolution Integrated Spectroscopy
CIRCE Canarias InfraRed Camera Experiment EMIR Especrografo Multiobjecto Infra-Rojo
IBC Impurity Band Conduction BIB Blocked Impurity Band FPA Focal Plan Array
FWHM Full Width Half Maximum HWP half-wave plate
FITS Flexible Image Transport System IDL Interactive Data Language HR Hertzsprung-Russell
ISO Infrared Space Observatory
MIPS Multi-Band Imaging Photometer for Spitzer SCUBA Submillimeter Common-User Bolometer Array VLTI Very Large Telescope Interferometer
DIMM Differential Image Motion Monitor
MATISSE Multi AperTure mid-Infrared SpectroScopic Experiment ALMA Atacama Large Millimeter Array
ELT Extremely Large Telescope TMT Thirty Meter Telescope
JWST James Webb Space Telescope
SPICA Space Infrared Telescope for Cosmology and Astrophysics LBT Large Binocular Telescope
Motivations and structure of the thesis
At the time of writing, more than 3000 confirmed exoplanets1 have been detected around stars using a variety of direct and indirect methods such as the radial veloc- ities technique, planetary transits or direct imaging. The interested reader may refer to the thorough review ofWright and Gaudi(2013) for an overview of such techniques.
Every year, the number of detected planetary companions is increased due to the refine- ment and improved accuracy of these techniques, which allows astronomers to reach more robustly the range of Earth-mass planets: a spectacular result has been obtained in this direction byAnglada-Escud´eet al. (2016) with the detection of Proxima b a possibly terrestrial planet in a temperate orbit around the nearby red dwarf Proxima Centauri located at 1.3 pc.
Interestingly, the relatively large sample available to date points out a strong di- versity in the exoplanetary systems in terms of size, mass, density, separation, com- position (Rauer, 2013) and questions in a profound way the supposed unicity of our Solar System as a standard model. Since the first detection of 51-Peg-b byMayor and Queloz(1995) more than twenty years ago, the field of exoplanets has now become a new and vigorous area of research in modern astrophysics. New questions arise on the statistically relevant physical and chemical properties of these new worlds. On the long-term, the spectroscopic characterization at optical and infrared wavelengths of planetary companions remains a major goal for the next decade (Madhusudhanet al., 2014).
1www.exoplanet.eu/catalog/
Considering the diversity of the aforementioned population of exoplanets, an im- portant question regards their mechanism of formation and evolution across the stellar lifetime. The current models of planet and star formation suggest that a better under- standing of these processes require to focus on thecircumstellar diskaround pre-main sequence and main-sequence stars, which the focus of this thesis. Circumstellar disks produce a noticeable infrared excess, which is seen in the spectral energy distribution of the object (see Chapter 2). However, the morphological complexity of the spatial structure of the disk can be ideally traced employing high-angular resolution tech- niques that make use of large telescopes and interferometerAbsil and Mawet(2010).
In many cases, an estimate of the characteristic size of the disk allows to derive the circumstellar region where the bulk of the infrared excess emission is concentrated. In this thesis, I have used spatially resolved mid-infrared imaging for this purpose. The objective of this thesis is to study with Mid-Infrared (MIR) direct imaging the circum- stellar disk around stars at two different evolutionary stages, namely in thepre-main sequence phaseand in themain-sequence phase. The thesis is organized as follows:
In chapter2, I introduce the context of star and planet formation and the observa- tional diagnostic tracers that can be investigated in the study of circumstellar material.
In chapter 3, It inculdes the information about the atmosphere transparency, water vapour and emissivity for the{MIR observation. Then I have explained What is the diffraction limit and the relation between the diffraction and the seeing?. The GTC telescope properties, CanariCam instrument details, How the observation and data re- duction works? all those subjects are aslo descibed in the chapter 3. In chapter4, I present in detail the science case of HD 179218, a A-type pre-main sequence object, the emission of which I investigated in the Polycyclic Aromatic Hydrocarbons (PAH) bands in theMIR spectral range, between 8 and 13 microns. I focus on determining the spatial extent of the disk emission in the PAH bands and in the continuum, and attempt to correlate it with the charge state of thePAHmolecules as derived from the spectrum of the object.
In chapter 5, I concentrate on the challenging case of the direct imaging of the debris disk around Epsilon Eridani, one of the famous object exhibiting the Vega phenomenon and hosting at the same time a possible Jupiter-like planet Hatzeset al.
(2000). The flux contrast between the central star and the fainter exozodiacal emission makes the observation difficult from the ground, although not impossible if sufficient collecting area is used. The conclusions and the prospects are presented in chapter6.
Introduction and Background
2.1 Introduction to Star Formation
Circumstellar disks are a well-known byproduct of star formation. I shortly review hereafter some important aspects of the field. Star formation takes place in molecu- lar clouds. These are very dense regions of gas and dust where stars form through accretion processes.
The nearest molecular clouds to our solar system are Orion, Ophiuchus, Taurus- Auriga, Chamaeleon, and Serpens. Those molecular clouds have been studied for extensively as they are known to be rich and nearby forming region star, and therefore ideal laboratories for observational studies. Hydrogen is the most abundant element in a molecular cloud (75%). Helium is the second most abundant element with an abundance of (25%), which is then followed by fewer heavier elements such as carbon, nitrogen, oxygen, calcium, and sodium (Seeds and Backman,2011). Molecular clouds are classified according to different constituting properties:
1. Diffuse Molecular Cloudsor(Translucent Molecular Cloud):Diffuse molec- ular clouds are low dense clouds with number densities ranging from 5×10⁸- 5×10⁹m−3, with temperature of 50 K and masses up to 50 M. A good example of such a diffuse molecular cloud isOphiuchus. It lies at a distance of approximately 140 pc from our solar system with a size of about 6 pc in diameter and a mass of circa 104 M. Star formation rates in such clouds are relatively low, which mainly results the in formation of low-mass stars.
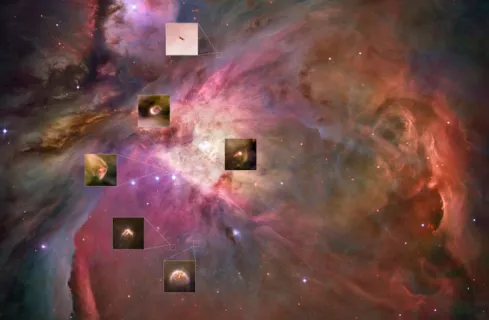
2. Giant Molecular Clouds (GMC): These are more dense clouds and exhibit a rich variety of dust and gas. They have number densities in the range of 1×10⁸−3×10⁸ m−3 and temperature of approximately 15 K. The size of the cloud is in the range of 50 pc in diameter and masses of the clouds are between 105 and 106M. Orionis one of the most interesting giant molecular cloud. It lies at a distance of 400 pc with a diamtere of nearly 60 pc. The mass of the cloud is about 106 M. It contains massive O-type stars at its center which affects the nearly low mass star formation, as illustrated in Figure2.1.
3. Dark Clouds: Dark clouds exhibit very high densities. They are divided into two types: complex and individual clouds. Complex clouds have a density of 5×10⁸ m−3 and a temperature of around 10 K. The size of complex clouds is about 10 pc in diameter with a mass of 104M. Taurus-Aurigabelongs to the complexes dark cloud at a distance of 140 pc. Individual dark clouds are denser and smaller than complex dark cloud with densities around 109 m−3 and with typical sizes of about 2 pc in diameter.
The temperature of the cloud is about 10 K with a mass of circa 50 M. The B1 cloud is an example for such an individual dark cloud.
4. Dense Core Clouds: Dense core clouds are small clouds in the galaxy with diameter 0.1 pc. The mass of such clouds is 10 Mwith a temperature of about 10 K.
They have densities of circa 1010m−3 as found in the archetypical objectTMC-1/B335 (Stahler and Palla,2008).
5. Hot Core Clouds: Hot core clouds are the smallest clouds in the galaxy with diameter in the range of 0.05 - 0.1 pc. They are denser than other molecular clouds with densities between 1013- 1015m−3and also exhibit higher temperatures and larger masses in comparison to other two molecular clouds (Drak clouds and Dense clouds) (T∼100 - 300 K, M∼10 - 3000 M).
6. Bok Globules Cloud: The center of the cloud is the place for low mass stars formation and hosts a very dense core. Bok globules have a roughly spherical shape and a temperature of circa 10 K. The density of such a cloud is larger than 1010m−3and its size is smaller than 1 pc in diameter. The mass of bok globules is in the range of 1 - 1000 M. A well-known Bok Globule isBarnard 68. The regions in molecular clouds where the conditions are suitable to form stars are calledStar Forming Regions (SFR) (Carroll and Ostlie,2007;Stahler and Palla,2008).
Figure 2.1: Orion nebula was captured by Hubble Space Telescope HST in 2009. As noticed from the image, Orion consists of gas and dust, many of stars born surrounded by materials. Image credit: NASA, ESA, M. Robberto (Space Telescope Science Insti- tute/ESA), the Hubble Space Telescope Orion Treasury Project Team and L. Ricci (ESO)”
https://www.spacetelescope.org/images/heic0917ab/.
The collapse of the molecular cloud is initiated when the mass of the cloud exceeds the Jeans criterion, or Jean’s mass. This criterion was proposed by Sir James Jeans in 1902. When the gravitational pull overtakes the radiative gas pressure, then the molecular cloud starts to collapse inwardly. The Jeans mass is calculated following Carroll and Ostlie(2007) according to:
MJ ' 5kT GµmH
!3/2
3 4πρ0
!1/2
(2.1) wherekis theBoltzmann’s Constant(k= 1.38×10⁻⁸J k−1),Tis the temperature of the cloud andGis theGravitational Constant(G =6.674×10⁻¹¹m3kg−1s−2),µis the mean molecular weight,mHis the mass of the hydrogen atom (mH =1.6735×10⁻²⁷kg), ρis the density of the cloud in unit (kg/m3).
There are two scenarios of collapse in a giant molecular cloud. The homologous collapse is a scenario where the uniform density across the molecular cloud makes the different regions of the cloud to collapse in about the same amount of time. The
inside-out collapse describes a scenario where, if the cloud center is denser than the outer regions, the time of collapse in the center will be shorter.
That means the material which is close to the center will require a shorter time to collapse than the material which is far from the center. The time of cloud collapse is calledFree-Falltime-scale and can be determined by (Carroll and Ostlie,2007):
tf f = 3π 32Gρ0
!1/2
(2.2) For example, let’s assume the density of the cloud was (ρ0= 3×10⁻¹⁷kgm−3) then the free fall time is (tf f = 3.8×10⁵) yr.
The consequence of the collapse of the molecular cloud is to increase the density during the free fall. The Jeans mass decreases, whereas the temperature of the cloud is not changing throughout the collapse. This means the cloud collapse is isothermal.
After that, any inhomogeneities in the density of the cloud will be the reason for pro- ducing smaller features of clouds from the large cloud. This sequences of the collapse is calledfragmentationand tends to form group of stars.
This fragmentation can not be continuous until infinity, it will stop at a specific point. What does make this fragmentation process to stop? It depends on the assump- tion that the collapse of the cloud is isothermal. The gravitational collapse produces energy increase of the optical depth and this energy is sustained in the cloud, then the temperature must increase. This increase in temperature will convert the state of col- lapse cloud from isothermal to adiabatic (relation between temperature and density).
Eventually, the core of the cloud becomes quasi-static equilibrium.
The inner dense core in the center of the collapsed cloud is called protostar. The cloud has non-zero angular momentum, hence any initial rotation of the cloud will cause the in-falling material to build up a disc around the protostar.
The phase when the nuclear reactions start inside the core of the star is known as Zero-Age Main Sequence (ZAMS) star phase. The time scale for this duration called Kelvin-Helmholtztime scale and can be estimated through this formula (Bodenheimer, 2011):
tkh ≈ GM2
RL (2.3)
where R is the radius of the protostar and Lis the average luminosity. The time scale (tkh) for one solar masses is (≈4×10⁷ yr).
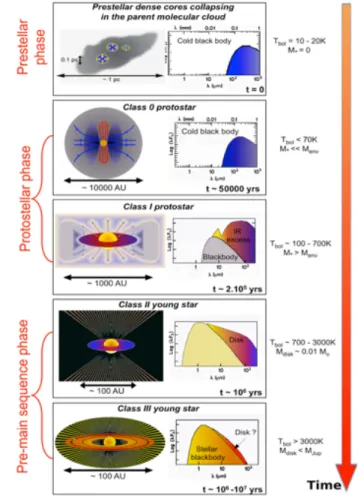
Figure 2.2: Diagram of star formation process through time. It starts from the molecular cloud collapse in the center which is represented by Class 0. As a result of this collapse, the protostar form in the center of the collapse and surrounded by massive protoplanetary disk Class I. Protoplantery disk begins to dissipate material by forming planets Class II.
After that, all the material which has been dissipated will form solar system with planets in Class III (Ward-Thompson and Whitworth,2011).
Young Stellar Objects (YSOs) in the pre-main sequence phase are classified into four classes by Lada (1987) and modified by Andre et al. (1993) who added the Class 0 to the classification. This classification based on the Spectral Energy Distribu- tion (SED) shape. SEDs were found to have different shapes classification association withYSOsevolution. The origin ofSEDemission of theYSOscomes from two com- ponents. The first component is the protostar which emits as a black body radiation in theSEDand the second component is the thermal emission comes mainly from the dust in the protoplanetary disk. For more clarification, the material closest to the pro- tostar can be emitted in the Near-Infrared (NIR) wavelengths range (0.7 µm- 5 µm), material a little farther would emit in the MIR wavelengths range between (5 µm - 20µm) and for material more farther distance from the protostar are colder and emit in the Far-Infrared (FIR) wavelengths range (20µm- 1 mm), sub-millimetre wavelengths.
The classifications can be extracted from the slope of theSEDby using this formula (Stahler and Palla,2008):
α≈ dlog(λFλ)
dlogλ (2.4)
Whereλis the wavelength andFλ is the observed flux.
Class 0: It represents the earlier stage of young stellar objects formation. It was not found in the first classification fromLada(1987), but it was added later byAndre et al. (1993). In this class, protostar forming is embedded by accreting an envelope and has a very strong emission in the sub-millimetre wavelength and it is not visible in the optical. Some objects can be observed in theMIRandFIR.
Class I(α >0):When the value of the slope is positive. Young stellar objects are forming a star with very strong outflows or called (bipolar jets) and surrounded by the potoplanetary disk. The envelope in this stage starts to dissipate and a star becomes partially observed in the optical. The SED has a rising in the MIR emission which mostly comes from the protoplanetary disk.
Class II (−1.5 < α < 0):The star in this class is called Pre-Main sequence star.
Where most of the materials in the envelope have been dissipated and the star becomes observed completely in the optical wavelength. The SED of Class II has combined emission from the star and the disk has a very less strong Infrared (IR)-emission from Class 0 and I. This emission comes from the dust and the gas in the protoplanetary disk. The protostars in this class can be divided into three types according to their masses. Pre-Main-Sequence stars with masses less than 2 M are called Low Mass Stars. Low Mass Stars are classified to Classical T-Tauri Stars (CTTs) and Weak T- Tauri Stars (WTTs) which has weakerIRemission thanCTTs. The protostar has mass larger than 2 M or in the range (2 M - 8 M) known as Intermediate Mass Stars
“Herbig Ae/Be stars”, as shown in Figure2.3.
Massive starsprotostars which have masses greater than (8 M- 10 M) are called
“Massive stars”. The massive stars can not be observed during Class II because they are evolved much quicker than low mass stars.
Class III (α < 0): The young stellar object reaches to the stage of the main se- quence stars and the disk around the star is called “Debris Disk”. The SED of the Class III stage has lessIR emission and the debris disk is optically thin. The reason behind theIRemission of theSEDin Class III is less than Class II due to use of all dust and gas in the protoplanetary disk to form planets. This smallIRemission originates
from the collision of the giant planets with residual small grains, comets, planetesimals Williams and Cieza(2011). The sketch below show the young stellar object evolution through four Classes with time.
Figure 2.3: Scheme to show Infrared emission in spectral energy distribution changes with young stellar objects evolution http://irfu.cea.fr/Pisp/anaelle.maury/
Research.html.
This classification can be fitted for most of young stellar objects. But, not necessary all of them. There are different factors that works on the shape of the SED as the dust grains size and edge-on protoplanetary disk. In this thesis, I have studied both cases protoplanetary disk where the Exo-planet form then the debris disk where the Exoplanet spends the rest of the time after being formed.
2.2 Protoplanetary Disk
Protoplanetary disks are large reservoirs of dust and gas. There are evidenced to be the birthplace of exoplanets, which form out of the disk material. This primordial disk, which is a byproduct of star formation, is typically detected in the Class II phase, more rarely in the Class I phase (see Figure2.3).
For low- and intermediate-mass pre-main sequence stars, this is in part due to the fact that the object spends a longer lifetime (106−107yr) in the Class II phase than in the Class I phase (105 yr).
Protoplanetary disks are observed around Pre-Main Sequence (PMS) stars, before the ignition of the nuclear reactions in the stellar core. Based on their mass,PMSstars are classified as T-Tauri stars (<2 M) and Herbig stars (between 2 and 10 M). Disks have also been observed around brown-dwarfs (Riaz et al., 2009) and even around planetary-mass objects (Zapatero Osorioet al.,2007).
While the model of formation of high-mass stars theorized the low-probability of disk survival around stars more massive than 10 M on time scales longer than 105 years, observational evidence of this transient phase was revealed by high-angular res- olution observations (Chiniet al.,2004;Krauset al.,2010).
The highly complex structure of a protoplanetary disk results from different phys- ical properties in different regions of the disk. One of the first and powerful method to study pre-main sequence objects is through the analysis of the SED, as illustrated in Figure2.3. Global properties of the disk, such as for instance the level of infrared to millimeter excess, can be derived from the SEDof the disk. But this method may lead also to degenerated results as in the case of binary stars, where a low-mass cool companion may mimic the blackbody-like spectrum of the circumstellar disk (Dutrey et al.,2004).
Protoplanetary disks are mostly formed of molecular hydrogen gas (circa 99 % of the disk’s mass) and of dust particles (circa 1 % of the disk’s mass). The dust contributes significantly to the overall emission budget. On a first approximation, dust grains behave as black body emitters and therefore have a temperature-dependent emis- sion peak. However, actual grains have a wavelength-dependent emissivity and can be better described by a modified blackbody. A good approximation of the grain emissiv- ity is that ∼a/λ, where a is the grain radius. This means that small grains are poor radiators at long wavelengths, which influences the overallSEDshape.
Sub-millimeter observations of the dust will essentially probe the larger mm-size grains. Finally, dust emission will depend on the opacity law of the grains, which is determined by the intrinsic physico-chemical properties of the matter.
Considering the dependence of the grains emission with temperature, different ob- serving wavelengths will probe different regions of the disk: at optical /NIR wave- lengths, the observer mainly senses the stellar light scattered by dust grains at the surface of the disk; in the range of distances (0.1 AU - 1 AU) from the star, warm dust continuum can be better studied at NIR wavelengths; longer MIR wavelengths are ideal to explore the 10 AU regions of protoplanetary disks where dust has a tem- perature of∼300 K; moving towards lower temperatures at larger distances (∼100 AU from the central star),FIRand millimeter emission originates from colder (∼50 K) and larger (mm- to cm-size) grains in the outer regions of the protoplanetary disk, as shown in Figure2.4.
Figure 2.4:This scheme illustrates the protoplanetary disk structure, dust grain evolution and observation. The right side shows which observation technique is suitable with differ- ent parts of the disk. The left side shows different mechanisms of dust grain with different positions in the disk (Testiet al.,2014).
Noteworthy, if the gas in the disk is in Keplerian rotation (e.g. in the case of HD 34282, Pi´etuet al. (2003)), the collision velocity increases from the outer to the inner regions, therefore the dynamical timescale is shorter for the inner disk in com- parison to the outer disk (Williams and Cieza, 2011). Two types of model are typi- cally foreseen for protoplanetary disks: the passively irradiated disk (Dullemondet al., 2001) absorbs the stellar photons of the central star and re-emits the light at infrared wavelengths, depending on the opacity of the disk’s dust. On the other hand, active accretion disks produce a significant fraction of their emission budget via viscous dis- sipation (i.e. friction between the gas molecules of the disk).
Most spectral energy distributions in Herbig stars exhibit a NIR“emission bump”
in the (2 µmto 4 µm) region, which has been initially difficult to model (Nattaet al., 2001). This emission is proposed to originate close to the dust sublimation radius, where dust grains are being sublimated at around 1500 K. InDullemondet al.(2001), the authors suggest a “puffed-up” structure of the inner disk with a locally increased vertical scale height. This results into a larger vertical surface being directly irradiated by the central star, hence producing higher flux in (2 µm - 3 µm) peak region of a 1500 K blackbody. The puffed-up structure, when optically thick, may also induce shadowing of the disk region immediately behind it.
Different mechanisms can be invoked to explain the dispersal of the circumstellar material in protoplanetary disks (Armitage, 2010): photo-evaporation results, for in- stance, onto the formation of a gap that separates the inner and outer disk regions. The direct irradiation of the gas by UV photons results in an increase of the gas temper- ature, and consequently in an increase of the thermal velocity (vth) of the gas (vth ∝
√
T). At the radius rg where the thermal velocity of the gas is larger than its Keplerian velocity, the gas becomes unbounded and is expelled in the form of a wind. The for- mation of planets is a second scenario classically invoked to explain the disk dispersal.
Rapid grain growth and gas accretion onto the forming planetesimals can disperse the disk in few Myr. This timescale also depends on different factors such as the stellar mass and the grain opacity (Mason,2008).
In multiple systems where the dynamical influence of the companion can be strong, the disk can be further truncated and sees its lifetime typically reduced with respect to the single star system (McCabeet al.,2006). Disk evolution in multiple systems is still poorly understood (Duchˆene and Kraus, 2013), despite rapid progress on the side of hydrodynamical simulations (Thebault and Haghighipour,2014).
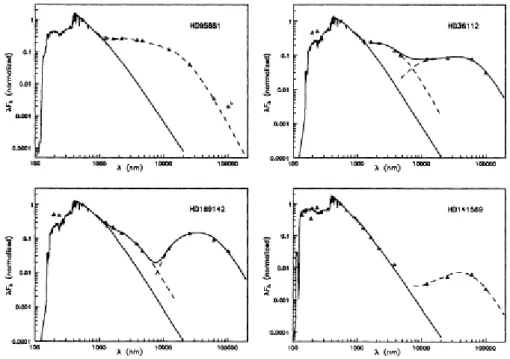
A first classification of intermediate-mass Herbig stars was proposed byWaelkens et al.(1994) and collaborators in 1994 based on the shape of the spectral energy distri- bution of the system. The classification is based on the observation of a double-peaked versus single-peaked SED as shown in Figure2.5. This was interpreted as the presence of a large dust gap in the disk possibly resulting from the process of planet formation.
Figure 2.5: Four spectral energy distribution of the Herbig stars with Infrared emission which extracted from IRAS data (Waelkenset al.,1994).
In Meeus et al. (2001), the authors proposed a more sophisticated classification among Herbig’s disks. Still based on the analysis of theSED, the classification makes essentially the difference between flared and flat geometries. Meeuset al.(2001) iden- tifies two populations of so-called Group I and Group II disks. In Group I disks, the MIRexcess is prominent and can be modeled by a blackbody function. In Group II source theMIRexcess is flatter and can only be modeled with a power-law function.
The classification interprets Group I disks as flared structure capable of intercepting a wider fraction of the flux coming from the central star. In thermodynamic equilibrium, a larger surface of the disk re-emits the absorbed radiation at mid- and far-infrared wavelengths. At the contrary, Group II disks are essentially geometrically flat – with a flaring index equal to zero – resulting in partial of total self-shadowing of the disk.
A scenario proposed byDullemond and Dominik(2004a) to explain the differences between Groups I and II is the phenomenon of grain growth: during the disk’s lifetime, sub-micrometer dust grains coagulate in larger and heavier particles that will tend to settle towards the midplane under the effect of gravitation. Larger grains also have a smaller emissivity at infrared wavelengths than at sub-millimeter wavelengths. Being inefficient emitters in the 10µmrange, the disk brightness is reduced in this wavelength range. In this scenario Group I protoplanetary disks are therefore the progenitors of Group II disks.
Concluding that most Group I disks are gapped disks,Maaskantet al.(2013) later suggested that Group I (gapped) disks and Group II disks represent two distinct rather than subsequent evolutionary stages from a common flared primordial disk. However, establishing a firm evolutionary connection between the different disks groups still remains speculative: in the light of recent interferometric results,Menuet al. (2015) actually proposes the hypothesis that Group II disks evolve in Group I disks with flared geometries.
An important feature observed in circumstellar disks is the presence of PAHs.
They are considered to be very tiny dust grains or large molecular and can be de- tected in the spectrum of many astronomical objects: they are found in the Interstellar Medium (ISM), HII regions, reflection nebulae, young stellar objects, cometary mate- rial, protoplanetary disk, planetary nebulae and nuclei of galaxies. The PAHs can be easily ionized by a UV radiation field and are suggested to largely contribute to the heating of the disks gas - hence influencing the structure of the disk itself - via the photoelectric heating (Habartet al.,2001;Weingartner and Draine,2001).
A small size of the PAHs molecular is making them able to widespread in the protoplanetary disk and escape from the settling as the dust grains in the mid-plane.
Therefore, PAHemission can be a good sign for the relation between the strength of the stellar radiation and the size of thePAH. According to some studies, the analysis of theMIRemission for 12 sources using Spitzer space telescope has proved that there is a relation between the size of thePAHand strength of the stellar radiation stronger emission. The very smallPAHs is survived when the radiation from the stellar radiation is strong (Bern´eet al.,2009;Visseret al.,2007).
In the last few years,Lagageet al.(2006) andDoucetet al.(2006) imaging of the HD 97048 using Very Large Telescope (VLT) telescope/VLT Imager and Spectrom- eter for mid Infrared (VISIR) in the PAH filter. They found that the PAH emission comes from the surface of the outer disk. This result supports the idea that thePAHis being gas more than being dust grains. The left Figure2.6 shows the PAH emission from the surface of the HD 97048 and right Figure2.6shows twoIRspectrums of the PAHemission from two different positions in the Iris nebula.
Figure 2.6: Left-figure: Image of HD 97048 in the PAH filter using VLT / VISIR and shows the PAH surface emission in the MIR wavelength (Lagage et al., 2006). Right- figure: IR spectrum of the PAH molecular from a different position in the Iris nebula (Laboratory,8 24)
(Geerset al.,2007) observed one of the Herbig stars which is IRS 48 (A dwarf) in different wavelength 8.6, 9, 11.3, 11.9 and 18.7µmfilters. The image of the protoplan- etary disk around IRS 48 shows a gap with the size of 30 AU in the 18.7µmfilter. So, this object could be observed in the phase of the transitional disk. Another example for tracingPAHin the protoplanetary disk are 14 Herbig stars that are observed using Space Telescope Imaging Spectrograph (STIS) coronagraphic imaging byGradyet al.
(2005). They found that the visibility of the object is related to the strength ofPAH emission at 6.2µmand those small grains have to be photoed.
Most recently,Maaskantet al.(2013) has traced thePAHand silicate emission in the surface of the four of Herbig stars Group Ib HD 79048, HD 169142, HD 135344B, and IRS 48 by using Subaru/Cooled Mid-Infrared Camera and Spectrometer (COMICS),
Gemini South / Thermal-Region Camera Spectrograph (T-ReCS) and VLT / VISIR telescopes at N and Q bands to compare the observations with radiative transfer model and to get more details a bout the geometry of disks. From the continuum emission and Polycyclic Aromatic Hydrocarbons Emission had managed to know the geometry of the disk. When emission from thePAHdominate in the protoplantery disk than the silicate, that means the emission comes from the surface of the outer disk. On the other hand, when the PAH emission comes from the inner region of disk, means thePAH emission is equal or less than silicate emission.
Other studies have been done by Maaskantet al. (2014) for the same targets by tracing thePAHionization in the disk to tell more about the size of the gap. The base of this study is to measure the maximum of the ratio (I6.2/I11.3) forPAHs features. Where the neutral PAHs has stronger emission in the 11.3 µm and ionized PAHs has less emission. While the inverse situation at 6.2µm, ionizedPAHs has stronger emission than the neutral emission. The neutral PAH emission comes from the region of the disk where it is optically thick, electron density higher and UV radiation is low. The ionization PAH emission originates from the region in the disk where it is optically thin, electron density is low and UV radiation is high. In chapter (4), there are more details and a practical case about how the PAH emission can be used to obtain the physical properties and to describe of the protoplanetary disk around HD 179218.
2.3 Debris Disk
Debris disks correspond to an evolutionary phase of the circumstellar material that fol- lows the gas-rich protoplanetary disk, during which the quasi-entirety of the primordial dust and gas is being accreted in a few million years into the star and into the forming planets - at least in the core accretion model of planet formation (Hayashiet al.,1985), (Pollacket al., 1996)- or being photo-evaporated. At the end of this phase, main se- quence stars older than few tens of millions year may lost such gas-poor “remnant”
disks. Debris disks dust is also present in our own Solar System, which influence is observed through the phenomenon of the Zodiacal light.
It is established that debris disks consist of second-generation, i.e. not primordial, dust that does not come from the protoplanetary-disk phase (Lagrangeet al., 2000).
This can be explained by the fact that the lifetime for the dust grains to be removed via radiation pressure and Poynting-Robertson drag is much shorter than the age of the system (Dutreyet al., 2004). Therefore, exozodiacal dust must then be regenerated in-situ by mechanisms such as collisions between planetesimals or cometary activity.
These second generation “debris” disks result in a modest but detectable infrared ex- cess, which level declines with increasing age of the system (Riekeet al.,2005).
Most main sequence stars are found to be surrounded by those debris disks. Two noticeable debris disk components in our solar system are the asteroid belt in the terres- trial planet region between 2 AU and 3.5 AU, and the Edgeworth-Kuiper Belt (EKB) which contains the coldest dust at distances larger than 30 AU from the Sun (Matthews et al.,2014), as shown in Figure2.7.
Figure 2.7: Dust emission on the debris disks with different wavelengths with typical temperature and regions from the star (Matthewset al.,2014).
The clearest evidence of the presence of cold circumstellar material around main sequence stars comes from the detection of an infrared excess, which intensity peaks in different regions of the infrared and submillimetre spectrum, depending on the tem- perature of the grain population.
Observationally, the first evidence of debris disks was obtained by Aumannet al.
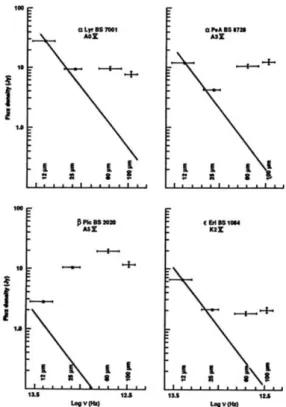
(1984) using the Infrared Astronomical Satellite (IRAS)1. Aumannet al.(1984) de- tected a strong infrared excess at 25 µm, 60 µm and 100 µm almost ten times larger than the photospheric flux, which they attributed to cold and solid material orbiting the star. This discovery led to the expression of “Vega phenomenon” to describe debris disk-like observational properties. Further work by theIRASinvestigators team led to the identification and confirmation of four debris disk stars, namely Vega (also known as Alpha Lyr), Fomalhaut, Beta Pictoris and Epsilon Eridani, as shown in Figure2.8.
Figure 2.8: The Spectral Energy Distribution for Vega, Fomalhaut, Beta Pictoris and Ep- silon Eridani from IRAS data (Backman,2004).
1Infrared Astronomical Satellite-It is space telescope with diamtere 60 cm built by the United States, the United Kingdom, and the Netherlands to map the sky at infrared wavelengths of 12, 25, 60, and 100 micrometres.
In Figure2.8is shown the original plot by F. Gillett, co-discover of the Vega phe- nomenon, of the spectral energy distribution of these four objects. It is noticeable to observe that the excess at 60 µmfor Beta Pictoris is about 400 times larger than the photospheric contribution (Backman,2004).
Few months later, the first scattered light image of the disk around Beta Pictoris was obtained with a ground-based telescope bySmith and Terrile (1984). Note that, although classified as a debris disk, the case of Beta Pictoris is somehow peculiar:
the young age system (∼8 - 10 Myr) and its large fractional excess (see below) could qualify this system as a transitional disk (Calvetet al.,2002) between a young, classical protoplanetary disk and a Vega-like debris disk, as shown in Figure2.9.
Figure 2.9: The left image is taken 1984 using optical telescope for Beta Pictoris star with debris disk (Smith and Terrile,1984). The right image is for the same source as seen at 3.6µm with NACO on the Very Large Telescope in 1996. Image credit: ESO/A.-M.
Lagrange et al.https://www.eso.org/public/images/eso0842b/.
Consisting of regenerated second-generation dust, debris disks are significantly less massive than PMS protoplanetary disks. Being optically thin at practically all wavelengths, their total mass can be directly and reliably estimated in the infrared spectral range. The trend of decrease in mass with increasing age of the system is visible in Figure2.10.
Figure 2.10: The plot shows the relation between the mass of the debris disk and the age of the system. The disk mass decreases linearly with increasing the age of host stars (Robsonet al.,2017).
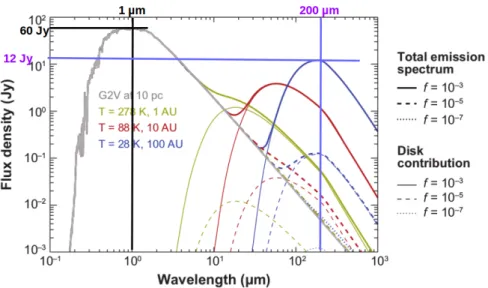
Two parameters are essential to characterise the evolution of debris disks with stel- lar age. These are the dust temperature T and the fractional luminosity f. As a rule of thumb, these two parameters can be estimated from the wavelength and the flux of the maxima of the emission spectra of the disk and of the star through (Wyatt,2008):
T = 5100
λdisk,max (2.5)
f = Fλdisk,max
Fλ∗,max
λ∗,max
λdisk,max
(2.6)
An example on how the fractional luminosity is estimated is presented in Figure 2.11. The concept of fractional luminosity can be used for a quantitative evaluation of the nature of the circumstellar emission. Debris disks will typically exhibit frac- tional luminosities f < 10−2....10−3, whereas protoplanetary disks present fractional luminosities f>10−2. With this criterion, we better understand why Beta Pictoris, with a fractional excess f>1 has a controversial debris disk nature.
Figure 2.11: The figure represents the spectrum of the star type G2V at distance 10 pc and it has a debris disk. The disk consists of the dust at temperatures 278 k, 88 k, 28 k as shown in the yellow, red and blue. These temperatures correspond to the distance 1 AU, 10 AU and 100 AU. The fraction luminosity of the disk is 10−3after extracting the maximum values of the flux and wavelengths for the star and the disk from the plot then substituted in the equation2.6(Wyatt,2008).
Statistical studies of the infrared excess in debris disks, primarily with the Spitzer telescope, have been conducted to characterize the time evolution of debris disk excess around A-type stars for ages spanning between 5 and 850 Myr. These observations have been conducted at 24µmand 70 µmwavelengths by Riekeet al.(2005) andSu et al.(2005), respectively. In line with the disk evolutionary scenario, the authors find that younger stars have stronger infrared excess and higher fractional luminosity than older main-seqance stars, with a decay of the fractional luminosity proportional to t
t0, with t0∼10 Myr. Analog studies have been conducted around Sun-like stars of spectral type F, G, K byCarpenteret al.(2009). It is found that about 15 % of the stars younger than 300 Myr exhibit an infrared excess at 24µmwhereas the rate falls to 2.7 % for older ages.
As most of the stars in the galaxy are of spectral type M, it is interesting to consider the Vega phenomenon in this stellar population. The general trend is that the rate of M dwarfs with debris disks is lower in comparison to the earlier spectral types.
Rheeet al.(2007) cross-correlated theIRASand Hipparcos catalog to photometri- cally search forMIRtoFIRexcess around main-sequence stars with identified spectral type. They only detect one M star with infrared excess out of the∼ 900 M dwarfs of the Hipparcos catalog, namely the 10 Myr star AU Mic, which edge-on debris disk has been revealed byLiuet al.(2004) using the Keck adaptive optics system.
The small-size Keck MIR (10 microns) survey of Plavchan et al. (2005) for M dwarfs older than 10 Myr did not report any detection. Further surveys using the Spitzer space telescope has shown no detection of infrared excess for a sample of 62 M dwarfs (Gautier IIIet al.,2007). At sub-millimeter wavelengths where cold dust is detectable and the stellar photosphere almost undetectable, Lestrade et al. (2006) reported a new detection of excess in the M dwarf GJ842.2 in addition to the already known excess in the young AU Mic. This result allowed the authors to derive a first estimate of 13 % detection rate in M dwarf in the age range of 20 to 200 Myr, which is comparable to the detection rate derived for A- to K-type stars (10 - 20 %). It remains unclear if the scarcity of debris disks around M dwarfs is an intrinsic property of these under-luminous dwarfs population or rather a sensitivity bias. However, the fact that the process of removal of the small grains is very fast around M-dwarf could explain in part this situation.
In his Spitzer study of the young open cluster NGC2547, (Forbrich et al., 2008) detect debris disk emission at 24 microns around eleven M-type stars with ages 30 - 50 Myr. Finally. no excess emission was found for M-type stars older than 300 Myr as evidenced byHeng and Malik(2013) in theirMIRWide-field Infrared Survey Explorer (WISE) survey. Similarly to the earlier type stars, the age of the system plays an important role in the strength of an infrared excess in M dwarfs: three young stars among 18 M stars have debris disk emission around them at the age of 8 Myr at 24µm (Lowet al.,2005;Matthewset al.,2007).
In order to observe debris disk dust with temperatures lower than 100 K, it is ad- visable to operate at longer wavelengths than 60 µm. Most detections at FIR and sub-millimetre wavelength were based on observations fromIRASand Spitzer space telescopes (Matthewset al.,2014). In this way,Aumannet al.(1984) detected debris disk around 15 % of main sequence stars. Recent studies based on observations from Spitzer and Herschel telescopes found a higher detection rate of 20 % of debris disk around main sequence stars of spectral type A to M (Eiroaet al.,2013;Matthewset al., 2014;Meyeret al.,2008; Rheeet al.,2007). Main sequence stars of spectral type A
exhibit larger rates of debris disk detection of 33 % and 25 % at wavelength 70µmand 100µm, respectively (Suet al.,2006;Thureauet al.,2014).
According to the Formation and Evolution of Planetary Systems (FEPS) survey and Disk Emission via a Bias Free Reconnaissance in the Infrared/Sub-millimeter (DEBRIS) surveys, the detection rate of debris disks is about 10 to 17 % for stars with spectral type F, G, K (Matthewset al.,2014).
However, the DUst around NEarby Stars (DUNES) survey detected a higher rate of circa 20 % of debris disks around F-, G-, and K-type stars (Eiroa et al., 2013).
In the sub-millimeter Atacama Pathfinder Experiment (APEX) survey of 22 stars by Nilsson et al. (2010) with an age span from 5 Myr to 3 Gyr – i.e. including also younger systems such as HD 141569 or HD 152404 – reliable detections of cold dust is obtained around 10 stars (∼50 %) but, again, with a bias towards the younger objects.
The SCUBA-2 Observation of Nearby Stars (SONS) survey using the James Clerk Maxwell Telescope (JCMT) at 850 µm obtained a detection rate of the cold dust of
∼ 40 %, with new candidates not previously detected at sub-millimetre wavelengths (Thureauet al.,2014). With respect to the age, one exception is found with the nearby solar-type star eta Corvi of∼1 Gyr age, for which both (Wyattet al.,2005) in the sub- millimeter and (Mennesson et al., 2014) at MIR wavelengths detect a strong excess indicative of the presence of a large warm dust disk at a distance of 1 - 2 AU from the central star. Considering the scarcity of strong excess detections in systems as old as 1 Gyr suggest that a transient Late-Heavy Bombardment phenomenon could be at work in eta Corvi.
Wavelengths [µm] Rate of Detection [%]
8.5 - 12 1
24 4
30-34 11.8
70 16
Table 2.1:The rate of the debris disk detection against wavelengths.
From a spectroscopic point of view, debris disk spectra may appear featureless as in the case of HR 4796, or show advanced signposts of dust processing with the evidence of strong crystallization of the silicate grains. A spectacular example of comet-like debris disk dust is seen in HD 69830 (Beichmanet al., 2005), and 2 Gyr old K-type star observed at aMIRwavelength with Spitzer.
This raises also the question of tracing second-generation dust in the inner regions of a debris disk, where smaller rocky planets may have formed. In addition to the problematic of the attainable angular resolution to probe these regions, the faintness of the debris disk emission with respect to the parent star makes the question of the dynamical range a central point. Long-baseline interferometry operating in the H (1.65 microns) and K (2.2 microns) bands has been successful in tracing the location of the hot dust in the disk, i.e grains with a temperature of circa 1000 K (Absilet al., 2006;
Ertel et al., 2014). As these high temperatures only occur in the very inner regions of the disk, interferometric observations remain as a major requirement. Recently, a study conducted with the Center for High Angular Resolution Astronomy (CHARA) interferometer was able to detect warm dust around A-type stars with higher frequency than around F-, G-, K-type stars for the 42 closest stars to our system (Absil et al., 2013).