diversity
Article
Changes in Heterotrophic Picoplankton Community Structure after Induction of a Phytoplankton Bloom under Di ff erent Light Regimes
Hera Karayanni1,* , Konstantinos A. Kormas2 , Maria Moustaka-Gouni3and Ulrich Sommer4
1 Department of Biological Applications and Technology, University of Ioannina, 45110 Ioannina, Greece
2 Department of Ichthyology and Aquatic Environment, School of Agricultural Sciences, University of Thessaly, 38446 Volos, Greece; kkormas@uth.gr
3 School of Biology, Department of Botany, Aristotle University of Thessaloniki, 54124 Thessaloniki, Greece;
mmustaka@bio.auth.gr
4 Helmholtz Center for Ocean Research (GEOMAR), Dusternbrooker Weg 20, 24105 Kiel, Germany;
usommer@geomar.de
* Correspondence: hkaray@uoi.gr; Tel.:+30-2651-007341
Received: 20 September 2019; Accepted: 11 October 2019; Published: 15 October 2019
Abstract:Bacterial and archaeal diversity and succession were studied during a mesocosm experiment that investigated whether changing light regimes could affect the onset of phytoplankton blooms.
For this, 454-pyrosequencing of the bacterial V1–V3 and archaeal V3–V9 16S rRNA regions was performed in samples collected from four mesocosms receiving different light irradiances at the beginning and the end of the experiment and during phytoplankton growth. In total, 46 bacterial operational taxonomic units (OTUs) with≥1% relative abundance occurred (22–34 OTUs per mesocosm). OTUs were affiliated mainly with Rhodobacteraceae, Flavobacteriaceae and Alteromonadaceae. The four mesocosms shared 11 abundant OTUs. Dominance increased at the beginning of phytoplankton growth in all treatments and decreased thereafter. Maximum dominance was found in the mesocosms with high irradiances. Overall, specific bacterial OTUs had different responses in terms of relative abundance under in situ and high light intensities, and an early phytoplankton bloom resulted in different bacterial community structures both at high (family) and low (OTU) taxonomic levels. Thus, bacterial community structure and succession are affected by light regime, both directly and indirectly, which may have implications for an ecosystem’s response to environmental changes.
Keywords: bacterial and archaea diversity; light; climate change; phytoplankton blooms;
454-pyrosequencing
1. Introduction
It is well known today that one of the most important pools of dissolved organic matter (DOM) in the euphotic layer is of phytoplankton origin. Heterotrophic bacteria are considered to be highly responsive to environmental perturbations that affect phytoplankton growth and, subsequently, DOM release [1] due to their small size, life cycle, dispersal potential and metabolic capabilities [2,3].
However, interactions are amphidromous—the composition of the DOM released by phytoplankton may affect bacterial growth and community structure, but bacteria will also affect its amount and composition [4]. The influence of phytoplankton on bacteria may be also exerted through other mechanisms like competition for nutrients and release of antibiotic compounds [5], and effects can be taxon specific (i.e., different phytoplankton taxa may affect positively or negatively specific
Diversity2019,11, 195; doi:10.3390/d11100195 www.mdpi.com/journal/diversity
bacteria [6,7]). Thus, in a changing ocean it is important to understand the complex interactions between phytoplankton and bacteria that affect the fate of organic carbon in the biosphere.
Bacterial community structure and succession during bloom events has been previously studied both in microcosm/mesocosm experiments [8] and in situ [9]. These studies have indicated that certain bacterial groups such as Rhodobacterales, SAR11, Alteromonadales and Bacteroidetes [8–10]
are often associated with algal blooms or the degradation of the derived organic matter. The use of microcosms and mesocosms is maybe the most suitable experimental methodology available to date when intending to study the impact of environmental factors and climate change on plankton communities [11–13]. Experimental approaches seem to be more informative in terms of species-specific responses to environmental perturbations for the majority of the studied marine [14] and freshwater [5]
habitats as compared with field studies. Whether it is about pulse-like events such as extreme meteorological activity, or press-like disturbances such ongoing climatic changes (e.g., CO2increase and ocean acidification), prokaryotic communities are expected to respond, either directly or indirectly, and show some degree of resilience both at the structural and functional levels [14,15] in facilitating ecosystem recovery [16].
Light as a driver of ecosystem dynamics has been explored in a number of studies, but has generally received less attention compared to other environmental factors like temperature and nutrients.
It has been shown, however, that light may have direct or indirect effects at cellular to community levels [17–20]. For instance, stimulation of bacterial clades containing aerobic anoxygenic phototrophs (Rhodobacteraceaeand NOR5) and inhibition of SAR11 [21–23] have been shown. Although this is considered to be a general trend, members of the aforementioned clades may exhibit differential responses to light manipulation [24]. Similarly, exposure of marine isolates to sea surface solar irradiance has indicated a large interspecific variability of resistance [25]. Indirect effects of light on prokaryotes are mainly associated with their role as major consumers of dissolved organic matter (DOM) [26]. The exudates released by phytoplankton can differ based on light availability [27], while photoalterations to DOM may change its bioavailability [28].
In a mesocosm experiment carried out with natural plankton assemblages from the Western Baltic Sea, it was shown that a phytoplankton bloom can be induced by intermittent high-light periods as early as in January [19]. Additionally, these authors found pronounced changes in the taxonomic response of phytoplankton and copepods nauplii. However, when it comes to heterotrophic prokaryotic members of the food web, there is a knowledge gap. Thus, in this paper, using the same mesocosms as in Sommer et al. [19], we investigated whether changes in the onset of the phytoplankton bloom and the succession of phytoplankton may also be followed by changes in heterotrophic prokaryoplankton community composition due to alterations in light regime. For this, we investigated prokaryoplankton abundance (epifluorescence microscopy) and diversity (16S rDNA 454 pyrosequencing) during the above mentioned 24-day indoor mesocosm experiment simulating climate-driven changes in light intensity. In particular, bacterial community dynamics were studied in two control mesocosms simulating the in situ conditions and light intensity that occur in January and February in coastal North Central Europe. Climate-driven changes (i.e., changes in cloudiness) were simulated by a ~2 fold increase in solar radiation in two additional mesocosms. A phytoplankton bloom occurred in all mesocosms except in the January control, and diatom contribution to total biomass increased with the light dose, a response driven by the predominance ofSkeletonema costatum.
Although it is difficult to disentangle all the factors that may influence the structure of the bacterial community in the mesocosms, we expect that different light regimes will affect bacterial/archaeal communities directly or indirectly. A previous study dealing with the role of temperature showed a faster bloom development at warmer temperatures as well as a shift of bacterial community structure (BCS) towards the appearance of additional taxa [29]. Interestingly, a simultaneous study of temperature and light effects on bacterial communities’ composition indicated that light effects are more likely to be direct, while those of temperature are mediated by phytoplankton [20]. We expect that although prokaryoplankton communities are initially similar in all mesocosms, they will subsequently
Diversity2019,11, 195 3 of 12
diverge, and specific taxa are likely to emerge following the quantitative and qualitative changes of phytoplankton assemblages or due to direct effects of light.
2. Materials and Methods
The experimental set-up has been described previously in full [19]. In brief, plankton succession was induced in mesocosms of ~1.5 m3containing whole water natural phytoplankton and mesozooplankton communities from the Kiel Bight (Baltic Sea) at in situ temperature conditions (4◦C).
The mesocosms were subjected to simulated high-light episodes: five days after the experiment started light intensity increased two-fold over controls for 10 days. Controls simulated January and February under in situ conditions and light intensity. They received a light regime based on natural seasonal irradiance dimmed to 43%E0of cloudless days. The initial daily light dose was ~2 and 3 mol photons PAR m−2d−1corresponding to mid-January and mid-February values.
Samples for the current study were retrieved from one mesocosm from each treatment, designated as JC, JH, FC, FH and corresponding to January (J) or February (F), control (C) or high-light (H) conditions. The collection of replicated samples was not feasible in order to minimize the removal of excess water volume for all the samples of the project. The dynamics of bacterioplankton were monitored for a total of 24 days. The whole experiment took place at the indoor mesocosm premises of GEOMAR, Kiel, Germany, in January/February 2010.
2.1. Sampling and Cell Counts
Heterotrophic prokaryotic cell counts were determined at two- to three-day intervals throughout the whole incubation experiment. From each mesocosm, 10–15 mL of water was fixed at a final concentration of 2% formaldehyde and kept at 4◦C in the dark for no more than two days. A subsample of 2–10 mL was filtered on black pore-sized PTFE filters of 0.2µm (Millipore, MA, USA) and stained with DAPI (40,6-diamidino-2-phenylindole). After mounting the filters on glass slides, the cells were counted with an Axiostar (Zeiss) epifluorescence microscope at 1000×magnification.
Water samples were collected from each mesocosm at the beginning of the experiment (day 1), at the beginning (day 11) and the end (day 15) of the exponential growth phase of phytoplankton and a few days (day 19) before the end of the incubation period. At each sampling point, a total of 500–1000 mL was collected in sterile glass bottles, screened through a 20-µm nylon mesh net (Millipore, MA, USA) then filtered on a 47-mm diameter 0.2µm pore-sized polycarbonate filter (Millipore, MA, USA), under low vacuum pressure (≤150 mm Hg). The filters were stored at−80◦C in sterile cryovials until DNA extraction.
2.2. Molecular Analysis
DNA was extracted using the PowerSoil DNA isolation kit (MoBio Laboratories, CA, USA) according to the manufacturer’s protocol after slicing the filters under sterile conditions. DNA concentrations ranged from 2.9–113.7 ng µL−1, based on NanoDrop measurements (A260/A280 ratios 1.60–2.01). DNA was amplified with the primers 27F (50-AGRGTTTGATCMTGGCTCAG-30) and 519R (50-GTNTTACNGCGGCKGCTG-30) targeting the V1–V3 region of the bacterial 16S rRNA gene and with primers 349f (50-GYGCASCAGKCGMGAAW-30) and 915r (50-GTGCTCCCCCGCCAATTCCT-30) targeting the V3–V9 region of the archaeal 16S rRNA gene (MRDNA, TX, USA). Amplicon pyrosequencing (bTEFAP) was performed as described in [30].
In brief, a one-step 30-cycle PCR was applied using HotStarTaq Plus Master Mix Kit (Qiagen, Valencia, CA). PCR conditions included: 94◦C for 3 min, then followed by 28 cycles of 94◦C for 30 s; 53◦C for 40 s; 72◦C for 1 min; and a final elongation step at 72◦C for 5 min. Following PCR, all amplicon products from different samples were mixed in equal concentrations and purified using Agencourt Ampure beads (Agencourt Bioscience Corporation, MA, USA). Samples were sequenced utilizing Roche 454 FLX titanium instruments and reagents following the manufacturer’s guidelines.
2.3. Data Processing and Analysis
Sequencing data were analyzed using MOTHUR 1.28.0 software [31]. In brief, flowgrams from the individual samples were separated according to their TAG, then denoised using PyroNoise software [32]. After removing primer sequences, TAG and key fragments, only sequences≥200 bp long with homopolymers shorter than 8 bp were considered for further analysis. Chimeric sequences were recognized and removed using the UCHIME software [33]. A 97% similarity cut-offlimit was used for clustering the remaining sequences into operational taxonomic units (OTU). Singletons (i.e., sequences that occurred only once in the whole dataset) were removed from downstream analyses, as they were considered most likely sequencing artifacts [34–36]. The data were standardized based on the smallest sample with permutation [37] in order to minimize differences in sequencing depths between samples.
Taxonomic affiliation was assigned according to the SILVA 123 SSU RNA database [38]. Sequences from this study have been submitted to the GenBank BioProject (PRJNA238858).
Diversity indices (Dominance and Shannon H) in the four mesocosms during the course of the experiment were calculated using PAST software v3.25 [39]. Dominance calculated as the 1-Simpson diversity index ranges between 0 (when all OTUs are equally presented) and 1 (dominance of one OTU). The Shannon index accounts for both abundance and evenness. Thus, high Shannon index values characterize communities with many taxa equally distributed. The relative abundance of OTUs in all mesocosms were correlated with the biomass of the dominant phytoplankton groups retrieved from [19]. Correlation analysis based on the Spearman coefficient was also performed using the PAST v3.25 software.
Relationships of the 10 OTUs that occurred in all samples (i.e., for all four mesocosms and at all sampling points) were visualized by constructing association networks based on the Spearman correlation coefficient of their log-transformed relative abundances. Only the statistically significant correlations (p<0.02) were used for the network matrix. Network visualization was performed with Cytoscape 2.8.3 software [40]. Positive correlations between OTUs are indicative of non-competitive relationships as a response to the different mesocosm treatments.
3. Results
3.1. Heterotrophic Prokaryotescell Abundance
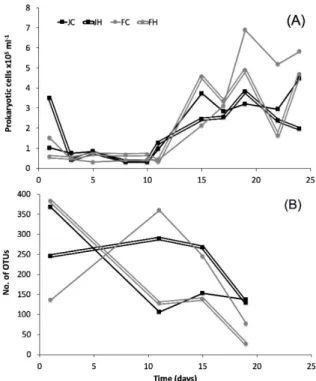
Total bacterial and archaeal abundance (Figure 1) on day 1 ranged from 0.57 × 10⁵ to 3.49×10⁵cells mL−1. From that point and until day 11 of the experiment, the prokaryotic cell counts remained fairly constant (0.30×10⁵to 1.26×10⁵cells mL−1). Maximum cell abundance ranged between 3.82×10⁵and 6.90×10⁵cells mL−1and occurred on day 19 for all but the JC mesocosm, where peak abundance was monitored on day 24. In both cases peak abundance occurred during the post-bloom period.
3.2. Diversity and Dynamics of Bacteria and Archaea
A total of 120,003 reads met the quality control standards and corresponded to 1,432 unique bacterial OTUs (97% similarity). In the whole dataset, 629 of the unique OTUs appeared only once (i.e., singletons), and were excluded due to the possibility of sequencing errors [34,36], leaving 803 bacterial OTUs for further analysis. Rarefaction curves (Figure S1) varied among samples and only in a few cases did they start to plateau. Archaeal amplifiable DNA and a high total number of reads (i.e.,
>2000 per sample, after quality processing) were feasible only for one sample from low light and three samples from high light intensities. Thus archaea were excluded from further analysis. The number of unique bacterial OTUs in each mesocosm (Figure1) decreased from day 1 (136–368) to day 19 (26–137), but followed different patterns in each mesocosm. Maximum dominance (D) occurred at day 11 in all mesoscosms (Figure2). Diversity was high at day 1 in all treatments, decreased afterwards and increased again to the initial levels towards the end of the experiment, except for FH (Figure2).
Diversity2019,11, 195 5 of 12
Diversity 2019, 11, 195 4 of 12
long with homopolymers shorter than 8 bp were considered for further analysis. Chimeric sequences were recognized and removed using the UCHIME software [33]. A 97% similarity cut-off limit was used for clustering the remaining sequences into operational taxonomic units (OTU).
Singletons (i.e., sequences that occurred only once in the whole dataset) were removed from downstream analyses, as they were considered most likely sequencing artifacts [34–36]. The data were standardized based on the smallest sample with permutation [37] in order to minimize differences in sequencing depths between samples. Taxonomic affiliation was assigned according to the SILVA 123 SSU RNA database [38]. Sequences from this study have been submitted to the GenBank BioProject (PRJNA238858).
Diversity indices (Dominance and Shannon H) in the four mesocosms during the course of the experiment were calculated using PAST software v3.25 [39]. Dominance calculated as the 1-Simpson diversity index ranges between 0 (when all OTUs are equally presented) and 1 (dominance of one OTU). The Shannon index accounts for both abundance and evenness. Thus, high Shannon index values characterize communities with many taxa equally distributed. The relative abundance of OTUs in all mesocosms were correlated with the biomass of the dominant phytoplankton groups retrieved from [19]. Correlation analysis based on the Spearman coefficient was also performed using the PAST v3.25 software.
Relationships of the 10 OTUs that occurred in all samples (i.e., for all four mesocosms and at all sampling points) were visualized by constructing association networks based on the Spearman correlation coefficient of their log-transformed relative abundances. Only the statistically significant correlations (p < 0.02) were used for the network matrix. Network visualization was performed with Cytoscape 2.8.3 software [40]. Positive correlations between OTUs are indicative of non-competitive relationships as a response to the different mesocosm treatments.
3. Results
3.1. Heterotrophic Prokaryotescell Abundance
Total bacterial and archaeal abundance (Figure 1) on day 1 ranged from 0.57 × 10⁵ to 3.49 × 10⁵ cells ml-1. From that point and until day 11 of the experiment, the prokaryotic cell counts remained fairly constant (0.30 × 10⁵ to 1.26 × 10⁵ cells ml–1). Maximum cell abundance ranged between 3.82 × 10⁵ and 6.90 × 10⁵ cells ml–1 and occurred on day 19 for all but the JC mesocosm, where peak abundance was monitored on day 24. In both cases peak abundance occurred during the post-bloom period.
Figure 1.(A) Abundance of prokaryotic cells and (B) number of unique bacterial operational taxonomic units (OTU) per sample in the studied mesocosms. J: January, F: February, C: control (baseline light intensity), H: high light intensity.
Diversity 2019, 11, 195 5 of 12
Figure 1. (A) Abundance of prokaryotic cells and (B) number of unique bacterial operational taxonomic units (OTU) per sample in the studied mesocosms. J: January, F: February, C: control (baseline light intensity), H: high light intensity.
3.2. Diversity and Dynamics of Bacteria and Archaea
A total of 120,003 reads met the quality control standards and corresponded to 1,432 unique bacterial OTUs (97% similarity). In the whole dataset, 629 of the unique OTUs appeared only once (i.e., singletons), and were excluded due to the possibility of sequencing errors [34,36], leaving 803 bacterial OTUs for further analysis. Rarefaction curves (Figure S1) varied among samples and only in a few cases did they start to plateau. Archaeal amplifiable DNA and a high total number of reads (i.e., >2000 per sample, after quality processing) were feasible only for one sample from low light and three samples from high light intensities. Thus archaea were excluded from further analysis. The number of unique bacterial OTUs in each mesocosm (Figure 1) decreased from day 1 (136–368) to day 19 (26–137), but followed different patterns in each mesocosm. Maximum dominance (D) occurred at day 11 in all mesoscosms (Figure 2). Diversity was high at day 1 in all treatments, decreased afterwards and increased again to the initial levels towards the end of the experiment, except for FH (Figure 2).
Figure 2. Dominance (D, top) and diversity (Shannon H, bottom) indices of bacterial OTUs in the four mesocosms during the course of the experiment (days 1 to 19). J: January, F: February, C:
control, H: high light intensity.
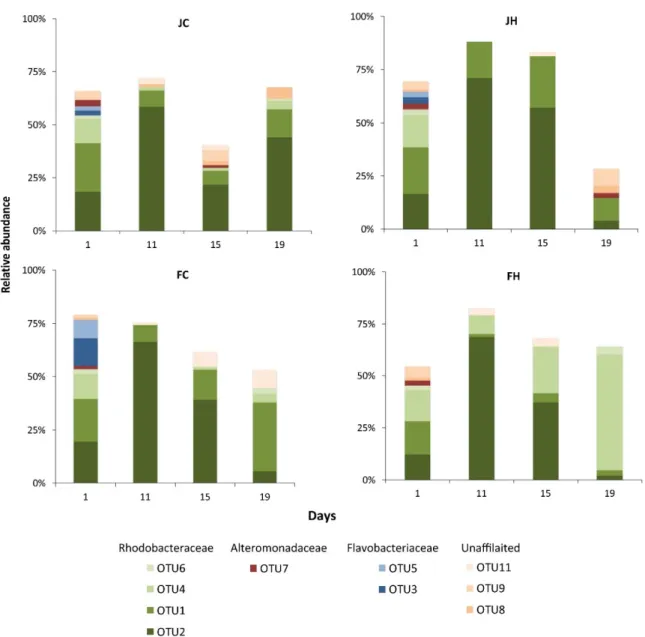
In each mesocosm, 22–34 bacterial OTUs comprised ≥1% of the total abundance. In total, 46 OTUs with ≥1% relative abundance occurred from all mesocosms considered. Analysis was focused on these OTUs, considered as the most abundant ones (Table S1). Eleven of these 46 OTUs appeared in all mesocosms (Figure 3) at various time points. In most of the mesocosms and at most sampling points, the majority of the found OTUs were affiliated to Rhodobacteraceae (Figure S4), with Flavobacteriaceae and Alteromonadaceae being the second-most abundant. The rest of the OTUs belonged to the Verrucomicrobiaceae, Microbacteraceae, Actinomycetales and a few unaffiliated taxa.
Of the 11 OTUs that appeared in all mesocosms, OTU2 and OTU1 were present in all mesocosms at all sampling points and exhibited distinguished temporal patterns (Figure 3). These OTUs belonged to the Rhodobacteraceae family and were related to environmental sequences from coastal waters (Figure S2). The abundance of OTU2 peaked at day 11 in all mesocosms and then declined, with the exception of mesocosm JC, where an increase took place at day 19. On the
Figure 2.Dominance (D, top) and diversity (Shannon H, bottom) indices of bacterial OTUs in the four mesocosms during the course of the experiment (days 1 to 19). J: January, F: February, C: control, H:
high light intensity.
In each mesocosm, 22–34 bacterial OTUs comprised≥1% of the total abundance. In total, 46 OTUs with≥1% relative abundance occurred from all mesocosms considered. Analysis was focused on these OTUs, considered as the most abundant ones (Table S1). Eleven of these 46 OTUs appeared in all mesocosms (Figure3) at various time points. In most of the mesocosms and at most sampling points, the majority of the found OTUs were affiliated to Rhodobacteraceae (Figure S4), with Flavobacteriaceae
and Alteromonadaceae being the second-most abundant. The rest of the OTUs belonged to the Verrucomicrobiaceae, Microbacteraceae, Actinomycetales and a few unaffiliated taxa.
Of the 11 OTUs that appeared in all mesocosms, OTU2 and OTU1 were present in all mesocosms at all sampling points and exhibited distinguished temporal patterns (Figure3). These OTUs belonged to the Rhodobacteraceae family and were related to environmental sequences from coastal waters (Figure S2). The abundance of OTU2 peaked at day 11 in all mesocosms and then declined, with the exception of mesocosm JC, where an increase took place at day 19. On the contrary, the abundance of OTU1 in all mesocosms decreased slightly from the beginning of the experiment and started to increase at the end of the experiment, with the exception of mesocosm JH. The rest of the nine OTUs showed practically no changes in their relative abundance. Another 15 and 5 OTUs were common in three and two mesocosms, respectively, while the last 15 OTUs appeared only in one of the mesocosms (Table S1 and Figure3).
Diversity 2019, 11, 195 6 of 12
contrary, the abundance of OTU1 in all mesocosms decreased slightly from the beginning of the experiment and started to increase at the end of the experiment, with the exception of mesocosm JH.
The rest of the nine OTUs showed practically no changes in their relative abundance. Another 15 and 5 OTUs were common in three and two mesocosms, respectively, while the last 15 OTUs appeared only in one of the mesocosms (Table S1 and Figure 3).
Figure 3. Temporal variation of the relative abundance of the 10 most abundant bacterial OTUs (>70%
of the whole dataset). J: January, F: February, C: control (baseline light intensity), H: high light intensity.
The relative abundance of only two OTUs showed statistically significant correlations with the biomass of a specific phytoplankton species. OTU1 was positively correlated (p = 0.007, r2 = 0.648) with the biomass of Chaetoceros decipiens, while OTU2 was negatively correlated (p = 0.017, r2 = 0.587) with the same organism.
4. Discussion
We investigated changes of heterotrophic prokaryoplankton community composition during experimentally induced coastal phytoplankton blooms, based on OTU diversity determined by 454 pyrosequencing of the bacterial V1-V3 and archaeal V3-V9 16S rRNA regions. In particular, we aimed to detect whether changes in community composition are uniform, or if a divergence in OTUs occurs across different treatments. True replication [41] was not feasible at this time due to experimental
Figure 3.Temporal variation of the relative abundance of the 10 most abundant bacterial OTUs (>70%
of the whole dataset). J: January, F: February, C: control (baseline light intensity), H: high light intensity.
The relative abundance of only two OTUs showed statistically significant correlations with the biomass of a specific phytoplankton species. OTU1 was positively correlated (p=0.007, r2=0.648)
Diversity2019,11, 195 7 of 12
with the biomass ofChaetoceros decipiens, while OTU2 was negatively correlated (p=0.017, r2=0.587) with the same organism.
4. Discussion
We investigated changes of heterotrophic prokaryoplankton community composition during experimentally induced coastal phytoplankton blooms, based on OTU diversity determined by 454 pyrosequencing of the bacterial V1–V3 and archaeal V3–V9 16S rRNA regions. In particular, we aimed to detect whether changes in community composition are uniform, or if a divergence in OTUs occurs across different treatments. True replication [41] was not feasible at this time due to experimental design limitations (e.g., removal of excess water could disturb the mesocosms’ stability), but our analysis included four different types of phytoplankton succession induced by different light regimes.
However, considering that Sommer et al. [19] did not find clear differences between replicated mesocosms for various biological parameters studied (e.g., phytoplankton biomass, relative biomass of phytoplankton groups, relative abundance of nauplii) but only between treatments, we believe that although we cannot make strong statistical conclusions, our results give insights into microbial processes that occur under different light conditions. It should be mentioned that in the January mesocosms, a phytoplankton bloom developed only in the treatment with the increased irradiance, whereas in the February mesocosms a phytoplankton bloom also developed in the control (Figure S3).
Positive phytoplankton growth rates also occurred in the January control mesocosm, but their values, as well as the phytoplankton biomass, were far below the limits characterizing a bloom event [19].
For most of the analyzed samples, the sequencing depth (Figure S1) was satisfactory for revealing at least the dominant OTUs, and here we focus on these dominant operational taxonomic units (OTUs) and not at revealing the exhaustive species richness of the mesocosms.
The decrease of unique OTUs during the course and/or towards the end of the growth phase in all mesocosms depicts that some kind of selection took place at the OTU level, resulting in an increase of dominance [42]. The most frequent and abundant OTUs (i.e., those found in all mesocosms and all sampling points), belonged to Rhodobacteraceae. This taxon includes some of the most important marine Bacteria, like theRoseobacterclade, which is known to have a positive response to increases in chlorophyll a [43,44] and is associated with phytoplankton blooms in marine waters [7,45,46].
Additionally,Roseobacterspp. prevail in meso-eutrophic systems [47]. The Rhodobacteraceae-related OTU2 found in our study persisted in all mesocosms despite the different light regimes and subsequent changes in the plankton community. The peak of this OTU coincided with the initiation or peak of the phytoplankton biomass (Figures S3 and S4). It is likely that this OTU represents a bacterium that not only outcompetes the rest of the bacterial OTUs, but is also resistant to grazing pressure (not investigated here). The metabolic plasticity of several members of the Rhodobacteraceae [23,48,49]
could support a bottom-up advantage for these microorganisms by using multiple and/or complex organic carbon resources and, thus, benefit from phytoplankton blooms [3,8,50] like the ones that occurred in our mesocosm. Actually, between the onset of the phytoplankton bloom and the end of the incubation (post-bloom period), DOC increasingly reached a factor of>3 [51], suggesting that bulk carbon sources were not limiting. However, further research is necessary in order to investigate the impact of different DOC compounds on specific Bacteria [52,53].
The second most frequent and abundant microorganism was OTU1, also a member of Rhodobacteraceae. However, although its initial relative abundance was similar to that of OTU2, it increased only in February mesocosms at the end of the experiment when phytoplankton biomass decreased (post-bloom period with senescent and dead phytoplankton cells) and phosphate concentration minima occurred (Figure S3). This pattern indicates a possible suppression of OTU1 abundance by OTU2 and a possible antagonistic relationship between the two microorganisms. OTU1 was a better competitor under the low phosphate concentrations recorded in February mesocosms.
Furthermore, these two OTUs were the only ones that showed statistically significant correlations with the biomass of a specific phytoplankter. In particular, OTU1 was positively and OTU2 was
negatively correlated to theC. decipiensbiomass. Since Bacteria species may use DOM originating from multiple phytoplankton species [44,54] and other sources [52], these statistically significant correlations should not be considered as one-on-one relationships but might indicate the differential impact of phytoplankton exudates to specific Bacteria. Similarly to the OTU2 and OTU1 correlations, contradictory responses to phytoplankton exudates of two Rhodobacteraeae strains have also been observed previously [55]. Finally, a third type of OTU relative abundance response was common for the rest of the nine dominant OTUs. The abundance of these microorganisms always remained low, as has been the case for many bacteria in several mesocosm experiments, mostly due to competition [5].
Other important bacterial families included were two that are well known from the marine environment, Flavobacteriaceae and Alteromonadaceae, which have also been found in previous Baltic Sea mesocosm experiments [29,56]. Flavobacteriaceae have been found to respond to enrichment in particulate or dissolved organic carbon [42]. However, in the current experiment their relative abundance increased only in the January treatments. We suggest that in the February mesocosms, Actinomycetales acted antagonistically to Flavobacteriaceae and played a significant role in the breakdown and recycling of organic matter [57]. The lag of the Alteromonadaceae-related OTU relative abundance in all treatments might have been related to their grazing susceptibility, as has been suggested in previous mesocosm experiments [8] and natural marine environments [58]. Interestingly, a previous study [29] using CARD-FISH found a Gammaproteobacteria-related OTU (Glaciecola) to dominate during diatom blooms in low temperature (<8◦C) mesocosm experiments with whole plankton communities in the Baltic Sea. According to these authors, dominant diatom (S. costatumand Thalassiosira rotula)exudates favoredGlaciecolaspp. In our experiment, we found aGlaciecola-related OTU (OTU7) in all mesocosms, but it never proliferated (even thoughS. costatum was one of the dominant phytoplankters) [19]. S. costatum sensu latoharbors cryptic species [59], and this feature could probably explain the discrepancies between studies. Members of Verrucomicrobia also occurred in noticeable relative abundance towards the end of the phytoplankton blooms in the FH mesocosms.
Verrucomicrobia are found in freshwater blooms of eutrophic systems [60,61], while a recent report couples the constant presence of Verrucomicrobia with enzymatic degradation of polysaccharides in Arctic waters [62], inferring a tight link of this group to organic matter originating from phytoplankton blooms. Although direct comparisons of the BCS between our results and those of other mesocosm studies from the Baltic Sea [29,56] and other aquatic habitats [5,8,63] are not directly feasible due to different experimental setups and fingerprinting methods used (e.g., tag pyrosequencing vs DGGE), some common major groups, such as those at the family level, can been seen. Overall, the dynamics of different families hint at the competitive advantage of Rhodobacteraceae against Flavobacteriaceae and Alteromonadaceae in our mesocosms, which is probably related to their resistance to grazing as well as to their ability to use multiple and/or complex organic carbon resources, as stated earlier.
In order to investigate if and how the associations of the 11 OTUs found in all mesocosms changed as a result of the different treatments, we used association network analysis of co-occurrence patterns.
We found that the interrelationships of these OTUs varied between the four different mesocosms (OTU6 did not show any correlations, see Figures S5 and S6). For example, the high-light period in February mesocosms led to higher growth and production rates for phytoplankton, as well as to a higher peak of biomass [19]. Under these conditions, only a few nodes (OTU7, OTU9, OTU20) made most of the interactions, presumably as a result of being the ones best adapted to the most specific conditions of the highest phytoplankton biomass and irradiance, and because several other OTUs need to associate with them to grow. During DOC degradation, intermediate compounds are formed [52,64], providing more available niches [48] that could be occupied by a variety of OTUs (Figure3). It seems, thus, that as light increases, more specific bacterial relationships are formed in terms of OTU relative abundance.
Although it is known that whole prokaryoplankton communities in the Baltic Sea are responsive to climate-induced changes [65,66], it remains unknown whether such responses are due to specific taxa of bacteria and/or archaea. Moreover, the effect of temperature increase on bacteria community composition can be direct or indirect [29], but far less is known of the effect of changes in light intensity
Diversity2019,11, 195 9 of 12
and duration [51]. In this study, we found that specific bacteria had different responses in terms of OTU abundance in mesocosms under in situ and high light intensities, and also that an early phytoplankton bloom [19] can result in a different bacterial community structure. Since different light conditions resulted in different phytoplankton biomass and community structure patterns, further investigation is needed based on factorial experimental design and replication to make safe conclusions about the
“significance” of different parameters on BCS. Our study shows that just as the distinct members of phytoplankton communities have responded distinctively in successive studies induced by simulated climate change effects, prokaryoplankton should not be considered as a “black box”, since it also exhibits distinct temporal patterns and interrelationships as a result of such environmental changes.
Supplementary Materials:The following are available online athttp://www.mdpi.com/1424-2818/11/10/195/s1:
Figure S1. Rarefaction curves of Operational Taxonomic Units (OTUs) numbers against the number of high-quality reads, at≥97 similarity, in the studied mesocosms; Figure S2. Maximum likelihood phylogenetic tree of the Bacteria most dominant operational taxonomic units (OTU) and the ones found in all four mesocosms all sampling points. Figure S3. Temporal dynamics of phosphate, nitrate to total dissolved inorganic nitrogen (DIN) ration and phytoplankton biomass in the studied mesocosms; Figure S4. Taxonomic composition of the most abundant (>1%) bacterial OTUs in the studied mesocosms. Figure S5. Association network diagram of Spearman’s correlations (edges) between the 10 operational taxonomic units (numbers in nodes) shared among the four mesocosms (yellow nodes); Table S1. Relative abundance (%) of the most abundant (≥1%) OTUs. J: January, F: February, C: control (baseline light intensity), H: high light intensity.
Author Contributions: Conceptualization, K.A.K. and U.S.; Data curation, H.K. and K.A.K.; Formal analysis, H.K., K.A.K. and U.S.; Funding acquisition, K.A.K. and U.S.; Methodology, H.K., K.A.K, M.M.-G. and U.S.;
Writing—original draft, H.K. and K.A.K.; Writing—review & editing, H.K., K.A.K., M.M.-G. and U.S.
Acknowledgments:“This research was funded by European Union Seventh Framework Program (FP7/2007–2013), grant number 228224, MESOAQUA” Antje Biermann is fully acknowledged for sharing DOC measurements, and Antonis Michas is acknowledged for assistance during DNA extraction.
Conflicts of Interest:The authors declare no conflict of interest.
References
1. Tada, Y.; Nakaya, R.; Goto, S.; Yamashita, Y.; Suzuki, K. Distinct bacterial community and diversity shifts after phytoplankton-derived dissolved organic matter addition in a coastal environment.J. Exp. Mar. Biol.
Ecol.2017,495, 119–128. [CrossRef]
2. Fenchel, T. Biogeography for Bacteria.Science2003,301, 925–926. [CrossRef] [PubMed]
3. Hanson, C.A.; Fuhrman, J.A.; Horner-Devine, M.C.; Martiny, J.B.H. Beyond biogeographic patterns: Processes shaping the microbial landscape.Nat. Rev. Microbiol.2012,10, 497–506. [CrossRef] [PubMed]
4. Thorton, D.C.O. Dissolved organic matter (DOM) release by phytoplankton in the contemporary and future ocean.Eur. J. Phycol. 2014,49, 20–46. [CrossRef]
5. Paver, S.F.; Hayek, K.R.; Crabb, D.B.; Davis-Richardson, A.G.; Rosario-Passapera, R.; Gano, K.A.; Fagen, J.R.;
Brown, C.T.; Giongo, A.; Triplett, E.W.; et al. Interactions between specific phytoplankton and bacteria affect lake bacterial community succession.Environ. Microbiol.2013,15, 2489–2504. [CrossRef]
6. Bagatini, I.L.; Eiler, A.; Bertilsson, S.; Klaveness, D.; Tessarolli, L.P.; Vieira, A.A.H. Host-Specificity and Dynamics in Bacterial Communities Associated with Bloom-Forming Freshwater Phytoplankton.PLoS ONE 2014,9, e85950. [CrossRef]
7. Pinhassi, J.; Winding, A.; Binnerup, S.; Zweifel, U.; Riemann, B.; Hagström, A. Spatial variability in bacterioplankton community composition at the Skagerrak-Kattegat Front.Mar. Ecol. Prog. Ser.2003,255, 1–13. [CrossRef]
8. Tada, Y.; Taniguchi, A.; Sato-Takabe, Y.; Hamasaki, K. Growth and succession patterns of major phylogenetic groups of marine bacteria during a mesocosm diatom bloom.J. Oceanogr.2012,68, 509–519. [CrossRef]
9. Zhou, J.; Richlen, M.L.; Sehein, T.R.; Kulis, D.M.; Anderson, D.M.; Cai, Z. Microbial Community Structure and Associations During a Marine Dinoflagellate Bloom.Front. Microbiol.2018,9, 1201. [CrossRef]
10. Meziti, A.; Kormas, K.A.; Moustaka-Gouni, M.; Karayanni, H. Spatially uniform but temporally variable bacterioplankton in a semi-enclosed coastal area.Syst. Appl. Microbiol.2015,38, 358–367. [CrossRef]
11. Hoppe, H.G.; Giesenhagen, H.C.; Köppe, R.; Hansen, H.P.; Göcke, K. Impact of change in climate and policy from 1988 to 2007 on environmental and microbial variables at the time series station Boknis Eck, Baltic Sea.
Biogeosciences2013,10, 4529–4546. [CrossRef]
12. Tsiola, A.; Tsagaraki, T.M.; Giannakourou, A.; Nikolioudakis, N.; Yücel, N.; Herut, B.; Pitta, P. Bacterial Growth and Mortality after Deposition of Saharan Dustand Mixed Aerosols in the Eastern Mediterranean Sea: A Mesocosm Experiment.Front. Mar. Sci.2017,3, 281. [CrossRef]
13. Stefanidou, N.; Genitsaris, S.; Lopez-Bautista, J.; Sommer, U.; Moustaka-Gouni, M. Effects of heat shock and salinity changes on coastal Mediterranean phytoplankton in a mesocosm experiment.Mar. Biol.2018,165, 154. [CrossRef]
14. Shade, A.; Read, J.S.; Youngblut, N.D.; Fierer, N.; Knight, R.; Kratz, T.K.; Lottig, N.R.; Roden, E.E.; Stanley, E.H.;
Stombaugh, J.; et al. Lake microbial communities are resilient after a whole-ecosystem disturbance.ISME J.
2012,6, 2153–2167. [CrossRef] [PubMed]
15. Allison, S.D.; Martiny, J.B.H. Resistance, resilience, and redundancy in microbial communities.Proc. Natl.
Acad. Sci. USA2008,105, 11512–11519. [CrossRef] [PubMed]
16. Downing, A.L.; Leibold, M.A. Species richness facilitates ecosystem resilience in aquatic food webs.Freshw.
Biol.2010,55, 2123–2137. [CrossRef]
17. Ruiz-González, C.; Simó, R.; Sommaruga, R.; Gasol, J.M. Away from darkness: A review on the effects of solar radiation on heterotrophic bacterioplankton activity.Front. Microbiol.2013,4, 131. [CrossRef]
18. Yamamichi, M.; Kazama, T.; Tokita, K.; Katano, I.; Doi, H.; Yoshida, T.; Hairston, N.G., Jr.; Urabe, J. A shady phytoplankton paradox: When phytoplankton increases under low light.Proc. R. Soc. B2018,285, 20181067.
[CrossRef]
19. Sommer, U.; Lengfellner, K.; Lewandowska, A. Experimental induction of a coastal spring bloom early in the year by intermittent high-light episodes.Mar. Ecol. Prog. Ser.2012,446, 61–71. [CrossRef]
20. Paver, S.F.; Kent, A.D. Direct and Context-dependent effects of light, temperature, and phytoplankton shape bacterial community composition.Ecosphere2017,8, e01948. [CrossRef]
21. Alonso-Sáez, L.; Gasol, J.M.; Lefort, T.; Hofer, J.; Sommaruga, R. Effect of Natural Sunlight on Bacterial Activity and Differential Sensitivity of Natural Bacterioplankton Groups in Northwestern Mediterranean Coastal Waters.Appl. Environ. Microbiol.2006,72, 5806–5813. [CrossRef] [PubMed]
22. Ruiz-González, C.; Lefort, T.; Massana, R.; Simó, R.; Gasol, J.M. Diel changes in bulk and single-cell bacterial heterotrophic activity in winter surface waters of the northwestern Mediterranean Sea.Limnol. Oceanogr.
2012,57, 29–42. [CrossRef]
23. Sánchez, O.; Koblížek, M.; Gasol, J.M.; Ferrera, I. Effects of grazing, phosphorus and light on the growth rates of major bacterioplankton taxa in the coastal NW Mediterranean.Environ. Microbiol. Rep.2017,9, 300–309.
[CrossRef] [PubMed]
24. Schwalbach, M.S.; Brown, M.; Fuhrman, J.A. Impact of light on marine bacterioplankton community structure.
Aquat. Microb. Ecol.2005,39, 235–245. [CrossRef]
25. Agogué, H.; Joux, F.; Obernosterer, I.; LeBaron, P. Resistance of Marine Bacterioneuston to Solar Radiation.
Appl. Environ. Microbiol.2005,71, 5282–5289. [CrossRef]
26. Schlesinger, W.H.Biogeochemistry: Treatise on Geochemistry, 1st ed.; Elsevier: Amsterdam, The Netherlands, 2005; Volume 8.
27. Parker, M.S.; Armbrust, E.V. Synergistic effects of light, temperature, and nitrogen source on transcription of genes for carbon and nitrogen metabolism in the centric diatomThalassiosira pseudonana(Bacillariophyceae).
J. Phycol.2005,41, 1142–1153. [CrossRef]
28. Blanchet, M.; Fernandez, C.; Joux, F. Photoreactivity of riverine and phytoplanktonic dissolved organic matter and its effects on the dynamics of a bacterial community from the coastal Mediterranean Sea.Prog.
Oceanogr.2018,163, 82–93. [CrossRef]
29. Von Scheibner, M.; Dörge, P.; Biermann, A.; Sommer, U.; Hoppe, H.G.; Jürgens, K. Impact of warming on phyto-bacterioplankton coupling and bacterial community composition in experimental mesocosms.
Environ. Microbiol.2014,16, 718–733. [CrossRef]
30. Dowd, S.; Callaway, T.R.; Wolcott, R.D.; Sun, Y.; McKeehan, T.; Hagevoort, R.G.; Edrington, T.S. Evaluation of the bacterial diversity in the feces of cattle using 16S rDNA bacterial tag-encoded FLX amplicon pyrosequencing (bTEFAP).BMC Microbiol.2008,8, 125. [CrossRef]
Diversity2019,11, 195 11 of 12
31. Schloss, P.D.; Westcott, S.L.; Ryabin, T.; Hall, J.R.; Hartmann, M.; Hollister, E.B.; Lesniewski, R.A.;
Oakley, B.B.; Parks, D.H.; Robinson, C.J.; et al. Introducing mothur: Open-Source, Platform-Independent, Community-Supported Software for Describing and Comparing Microbial Communities.Appl. Environ.
Microbiol.2009,75, 7537–7541. [CrossRef]
32. Quince, C.; Lanzén, A.; Curtis, T.P.; Davenport, R.J.; Hall, N.; Head, I.M.; Read, L.F.; Sloan, W.T. Accurate determination of microbial diversity from 454 pyrosequencing data.Nat. Methods2009,6, 639–641. [CrossRef]
33. Edgar, R.C. Search and clustering orders of magnitude faster than BLAST.Bioinformatics2010,26, 2460–2461.
[CrossRef] [PubMed]
34. Reeder, J.; Knight, R. The ‘rare biosphere’: A reality check.Nat. Rev. Microbiol.2009,6, 636–637. [CrossRef]
[PubMed]
35. Behnke, A.; Engel, M.; Christen, R.; Nebel, M.; Klein, R.R.; Stoeck, T. Depicting more accurate pictures of protistan community complexity using pyrosequencing of hypervariable SSU rRNA gene regions.Environ.
Microbiol.2010,13, 340–349. [CrossRef] [PubMed]
36. Kunin, V.; Engelbrektson, A.; Ochman, H.; Hugenholtz, P. Wrinkles in the rare biosphere: Pyrosequencing errors can lead to artificial inflation of diversity estimates.Environ. Microbiol.2010,12, 118–123. [CrossRef]
[PubMed]
37. Lemos, L.N.; Fulthorpe, R.R.; Triplett, E.W.; Roesch, L.F. Rethinking microbial diversity analysis in the high throughput sequencing era.J. Microbiol. Methods2011,86, 42–51. [CrossRef] [PubMed]
38. Pruesse, E.; Quast, C.; Knittel, K.; Fuchs, B.M.; Ludwig, W.; Peplies, J.; Glöckner, F.O. SILVA: A comprehensive online resource for quality checked and aligned ribosomal RNA sequence data compatible with ARB.Nucleic Acids Res.2007,35, 7188–7196. [CrossRef]
39. Hammer, Ø.; Harper, D.A.T.; Ryan, P.D. PAST: Paleontological statistics software package for education and data analysis.Palaeontol. Electron.2001,4, 9.
40. Smoot, M.E.; Ono, K.; Ruscheinski, J.; Wang, P.L.; Ideker, T. Cytoscape 2.8: New features for data integration and network visualization.Bioinformatics2011,27, 431–432. [CrossRef]
41. Prosser, J.I. Replicate or lie.Environ. Microbiol.2010,12, 1806–1810. [CrossRef]
42. Karayanni, H.; Meziti, A.; Spatharis, S.; Genitsaris, S.; Courties, C.; Kormas, K.A. Changes in Microbial (Bacteria and Archaea) Plankton Community Structure after Artificial Dispersal in Grazer-Free Microcosms.
Microorganisms2017,5, 31. [CrossRef] [PubMed]
43. Brinkhoff, T.; Giebel, H.A.; Simon, M. Diversity, ecology, and genomics of the Roseobacter clade: A short overview.Arch. Microbiol.2008,189, 531–539. [CrossRef] [PubMed]
44. Lefort, T.; Gasol, J.M. Global-scale distributions of marine surface bacterioplankton groups along gradients of salinity, temperature, and chlorophyll: A meta-analysis of fluorescence in situ hybridization studies.Aquat.
Microb. Ecol.2013,70, 111–130. [CrossRef]
45. Fandino, L.; Riemann, L.; Steward, G.; Long, R.; Azam, F. Variations in bacterial community structure during a dinoflagellate bloom analyzed by DGGE and 16S rDNA sequencing.Aquat. Microb. Ecol.2001,23, 119–130.
[CrossRef]
46. Zubkov, M.V.; Fuchs, B.M.; Archer, S.D.; Kiene, R.P.; Amann, R.; Burkill, P.H. Linking the composition of bacterioplankton to rapid turnover of dissolved dimethylsulphoniopropionate in an algal bloom in the North Sea.Environ. Microbiol.2001,3, 304–311. [CrossRef] [PubMed]
47. Fuhrman, J.A.; Hagström, A. Bacterial and archaeal community structure and its patterns. InMicrobial Ecology of the Oceans, 2nd ed.; Kirchman, D.L., Ed.; Wiley-Blackwell: Hoboken, NJ, USA, 2008; pp. 45–90.
48. Newton, R.J.; Griffin, L.E.; Bowles, K.M.; Meile, C.; Gifford, S.; Givens, C.E.; Howard, E.C.; King, E.;
Oakley, C.A.; Reisch, C.R.; et al. Genome characteristics of a generalist marine bacterial lineage. ISME J.
2010,4, 784–798. [CrossRef] [PubMed]
49. Brenner, D.J.; Krieg, N.R.; Staley, J.T. The Proteobacteria: Part C: The Alpha-, Beta-, Delta-, and Epsilonproteobacteria. InBergey’s Manual of Systematic Bacteriology, 2nd ed.; Garriy, G.M., Ed.; Springer: New York, NY, USA, 2005; pp. 161–229.
50. Allers, E.; Pinhassi, J.; Gasol, J.M.; Šimek, K.; Pernthaler, J.; Gómez-Consarnau, L.; Gómez-Consarnau, L.
Response of Alteromonadaceae and Rhodobacteriaceae to glucose and phosphorus manipulation in marine mesocosms.Environ. Microbiol.2007,9, 2417–2429. [CrossRef]
51. Biermann, A.; Engel, A.; Riebesell, U. Changes in organic matter cycling in a plankton community exposed to warming under different light intensities.J. Plankton Res.2014,36, 658–671. [CrossRef]
52. Hansell, D.A.; Carlson, C.A.Biogeochemistry of Marine Dissolved Organic Matter, 1st ed.; Academic Press: San Diego, CA, USA, 2002.
53. Jiao, N.; Herndl, G.J.; Hansell, D.A.; Benner, R.; Kattner, G.; Wilhelm, S.W.; Kirchman, D.L.; Weinbauer, M.G.;
Luo, T.; Chen, F.; et al. Microbial production of recalcitrant dissolved organic matter: Long-term carbon storage in the global ocean.Nat. Rev. Microbiol.2010,8, 593–599. [CrossRef]
54. Sarmento, H.; Gasol, J.M. Use of phytoplankton-derived dissolved organic carbon by different types of bacterioplankton.Environ. Microbiol.2012,14, 2348–2360. [CrossRef]
55. Grossart, H.; Simon, M. Interactions of planktonic algae and bacteria: Effects on algal growth and organic matter dynamics.Aquat. Microb. Ecol.2007,47, 163–176. [CrossRef]
56. Lindh, M.V.; Riemann, L.; Baltar, F.; Romero-Oliva, C.; Salomon, P.S.; Granéli, E.; Pinhassi, J. Consequences of increased temperature and acidification on bacterioplankton community composition during a mesocosm spring bloom in the Baltic Sea.Environ. Microbiol. Rep.2013,5, 252–262. [CrossRef]
57. Subramani, R.; Aalbersberg, W. Marine actinomycetes: An ongoing source of novel bioactive metabolites.
Microbiol. Res.2012,167, 571–580. [CrossRef] [PubMed]
58. Beardsley, C.; Pernthaler, J.; Wosniok, W.; Amann, R. Are Readily Culturable Bacteria in Coastal North Sea Waters Suppressed by Selective Grazing Mortality?Appl. Environ. Microbiol.2003,69, 2624–2630. [CrossRef]
[PubMed]
59. Smayda, T.J. Cryptic planktonic diatom challenges phytoplankton ecologists.Proc. Natl. Acad. Sci. USA 2011,108, 4269–4270. [CrossRef]
60. Ye, W.; Liu, X.; Lin, S.; Tan, J.; Pan, J.; Li, D.; Yang, H. The vertical distribution of bacterial and archaeal communities in the water and sediment of Lake Taihu.FEMS Microbiol. Ecol.2009,70, 263–276. [CrossRef]
[PubMed]
61. Kormas, K.A.; Vardaka, E.; Moustaka-Gouni, M.; Kontoyanni, V.; Petridou, E.; Gkelis, S.; Neofitou, C.
Molecular detection of potentially toxic cyanobacteria and their associated bacteria in lake water column and sediment.World J. Microbiol. Biotechnol.2010,26, 1473–1482. [CrossRef]
62. Cardman, Z.; Arnosti, C.; Durbin, A.; Ziervogel, K.; Cox, C.; Steen, A.D.; Teske, A. Verrucomicrobia Are Candidates for Polysaccharide-Degrading Bacterioplankton in an Arctic Fjord of Svalbard.Appl. Environ.
Microbiol.2014,80, 3749–3756. [CrossRef]
63. Teira, E.; Gasol, J.M.; Aranguren-Gassis, M.; Fernández, A.; González, J.; Lekunberri, I.; Aranguren-Gassis, M.;
Fernández-Carrera, A.; Álvarez-Salgado, X.A.; Aranguren-Gassis, M.; et al. Linkages between bacterioplankton community composition, heterotrophic carbon cycling and environmental conditions in a highly dynamic coastal ecosystem.Environ. Microbiol.2008,10, 906–917. [CrossRef]
64. Murray, A.; Arnosti, C.; De La Rocha, C.; Grossart, H.; Passow, U. Microbial dynamics in autotrophic and heterotrophic seawater mesocosms. II. Bacterioplankton community structure and hydrolytic enzyme activities.Aquat. Microb. Ecol.2007,49, 123–141. [CrossRef]
65. Nydahl, A.; Panigrahi, S.; Wikner, J. Increased microbial activity in a warmer and wetter climate enhances the risk of coastal hypoxia.FEMS Microbiol. Ecol.2013,85, 338–347. [CrossRef] [PubMed]
66. Panigrahi, S.; Nydahl, A.; Anton, P.; Wikner, J. Strong seasonal effect of moderate experimental warming on plankton respiration in a temperate estuarine plankton community.Estuar. Coast. Shelf Sci.2013,135, 269–279. [CrossRef]
©2019 by the authors. Licensee MDPI, Basel, Switzerland. This article is an open access article distributed under the terms and conditions of the Creative Commons Attribution (CC BY) license (http://creativecommons.org/licenses/by/4.0/).