Phytoplankton community responses to temperature fluctuations under different nutrient concentrations and stoichiometry
MIRIAMGERHARD ,1,5APOSTOLOSMANUELKOUSSOROPLIS ,2,3HELMUTHILLEBRAND ,1,4AND
MARENSTRIEBEL 1
1Institute for Chemistry and Biology of the Marine Environment (ICBM), University of Oldenburg, Schleusenstrsse 1, 26382, Wilhelmshaven, Germany
2Laboratoire Microorganismes Genome et Environnement (LMGE), UMR CNRS 6023, Universite Clermont Auvergne, 1 ImpasseAmelie Murat, F-63178, Aubiere cedex, France
3Theoretical Aquatic Ecology and Ecophysiology Group, Institute of Biochemistry and Biology, University of Potsdam, Am Neuen Palais 10, Maulbeerallee 2, D-14469, Potsdam, Germany
4Helmholtz Institute for Functional Marine Biodiversity (HIFMB), University of Oldenburg, Ammerl€ander Heerstraße 231, 26129, Oldenburg, Germany
Citation:Gerhard, M., A. M. Koussoroplis, H. Hillebrand, and M. Striebel. 2019. Phytoplank- ton community responses to temperature fluctuations under different nutrient concentrations and stoichiometry. Ecology 100(11):e02834. 10.1002/ecy.2834
Abstract. Nutrient availability and temperature are important drivers of phytoplankton growth and stoichiometry. However, the interactive effects of nutrients and temperature on phytoplankton have been analyzed mostly by addressing changes in average temperature, whereas recent evidence suggests an important role of temperature fluctuations. In a labora- tory experiment, we grew a natural phytoplankton community under fluctuating and constant temperature regimes across 25 combinations of nitrogen (N) and phosphorus (P) supply. Tem- perature fluctuations decreased phytoplankton growth rate (rmax), as predicted by nonlinear averaging along the temperature–growth relationship.rmaxincreased with increasing P supply, and a significant temperature9P9N interaction reflected that the shape of the thermal reaction norm depended on nutrients. By contrast, phytoplankton carrying capacity increased with N supply and in fluctuating rather than constant temperature. Higher phytoplankton N:P ratios under constant temperature showed that temperature regimes affected cellular nutrient incorporation. Minor differences in species diversity and composition existed. Our results suggest that temperature variability interacts with nutrient supply to affect phytoplankton physiology and stoichiometry at the community level.
Key words: carrying capacity; growth rate; N:P ratios; phytoplankton composition; temperature variability;
thermal performance.
INTRODUCTION
Temperature and nutrients are among the strongest drivers of primary production, both at regional and global scales (Tadonleke 2010, Kraemer et al. 2017). In lentic ecosystems, phytoplankton biomass and growth can respond very rapidly to changes in nutrient and tem- perature conditions (Moss et al. 2011, Cross et al.
2015). Previous studies have either analyzed the temper- ature–nutrient interactions with regard to constant tem- peratures (Thomas et al. 2017, Thrane et al. 2017, Verbeek et al. 2018) or the effect of temperature variabil- ity independently (Vasseur et al. 2014, Bernhardt et al.
2018b). We provide an experimental test using a natural phytoplankton community subjected to 25 nutrient regimes, each under constant and fluctuating tempera- ture showing that temperature fluctuations have
nonneutral consequences for resource uptake, growth and standing stocks.
As for all ectotherms, temperature determines meta- bolic rates of phytoplankton, including growth rates (Brown et al. 2004). Phytoplankton thermal reaction norms (TRN) for growth are unimodal left-skewed func- tions of temperature (Thomas et al. 2012). Because TRN are skewed, small rises in average temperature above the thermal optimum can have strong detrimental effects on phytoplankton growth (Deutsch et al. 2008). Most stud- ies on the thermal dependence of biological rates focus on changes in mean temperature, but a steadily increasing number of studies demonstrates the importance of con- sidering thermal variability around the average (Ruel and Ayres 1999, Estay et al. 2011, Vasseur et al. 2014, Dowd et al. 2015, Schaum et al. 2018). Because of the nonlin- earity of the TRN, population growth in thermally fluctu- ating environments differs from estimates solely based on mean temperature (Estay et al. 2014, Bernhardt et al.
2018b), a mathematical phenomenon known as Jensen’s Manuscript received 26 April 2019; accepted 25 June 2019.
Corresponding Editor: Shelley E. Arnott.
5E-mail: miriam.libertad.gerhard@uni-oldenburg.de
Article e02834; page 1
inequality (Jensen 1906, Ruel and Ayres 1999). The direc- tion (positive or negative) of such variability effects depends on the curvature of the TRN at a given tempera- ture mean value: concavity decreases population growth, whereas convexity increases it. Hence, under fluctuating temperature conditions, the “realized” TRN for growth should strongly differ (e.g., lower maximum growth, ther- mal optimum or thermal breadth) from that inferred under constant conditions (Bernhardt et al. 2018b).
Currently, our knowledge on thermal variability effects on phytoplankton is solely based on a single spe- cies studies at high nutrient supply (Bernhardt et al.
2018b). Nutrient supply has empirically been shown to interact strongly with temperature (Thrane et al. 2017, Mara~non et al. 2018, Verbeek et al. 2018). Fundamen- tally, this means that at a given temperature, nutrients can change the height and the curvature of the popula- tion growth TRN (Thomas et al. 2017). In a thermally fluctuating environment, such changes of the TRN imply that the effect size of thermal variance might strongly depend on the nutritional context (Koussoroplis
et al. 2017; Fig. 1), a prediction that remains to be veri- fied. Furthermore, it is necessary to expand our under- standing of thermal variability effects from single species to natural phytoplankton communities, because species rarely occur alone in nature.
In addition to growth rate, other important traits such as phytoplankton maximal biomass (or yield) might also be affected by interactions between temperature regimes and nutrient availability. It has been demonstrated that in phytoplankton populations, the carrying capacity decreases with increasing temperature, presenting a con- vex relationship (Savage et al. 2004, Bernhardt et al.
2018a). In addition, combined effects of enhanced tem- perature and nutrient enrichment on phytoplankton communities show an increase in algal biomass, whereas this response is constrained when only one factor is pre- sent (de Senerpont Domis et al. 2014, Verbeek et al.
2018). Using worldwide time series data, Kraemer et al.
(2017) found that the correlation of phytoplankton bio- mass and temperature in lakes may be negative or posi- tive, depending on the lake trophic state. Nevertheless,
FIG. 1. Hypothetical community thermal reaction norms (TRN) and nutrient-dependent variance effect. Fluctuating tempera- tures (e.g., Tlow, Thigh) around the thermal optimum should decrease the average growth rate (r) of an algal community, rðTÞ ¼ ðrðTlowÞ þrðThighÞÞ=2, relative to that under constant temperature,rðT) (Jensen ’s inequality). Suboptimal nutrient supply (concentrations, ratios) could change the shape of the TRN in various ways (a)–(c). Depending on whether nutrient supply affects the different regions of the TRN proportionally or not (colored arrows), the effect size of variance onr(d) can either (a) remain unchanged (all regions of the TRN decrease proportionally), (b) decrease (proportionally higher decrease around the optimum than near the tolerance limits), or (c) increase (proportionally higher decrease of the upper tolerance limit).
how thermal fluctuations may affect maximal biomass under different nutrient conditions remains unknown and difficult to predict (as for growth).
The balance between nutrients, in addition to concentra- tions, is fundamental to primary producer’s development and plays an important role describing how organisms use the nutrients present in the environment (Sterner and Elser 2002). Phytoplankton stoichiometry (elemental nitrogen:
phosphorus, hereafter N:P ratio) generally reflects the environmental nutrient availability (Klausmeier et al.
2004a, b). However, a higher correspondence between phy- toplankton N:P and supply N:P ratios is expected under slow-growing conditions (stationary growth phase), whereas in fast-growing conditions the phytoplankton sto- ichiometry tends to be more restricted to a range of lower N:P ratios (Hillebrand et al. 2013). Thus, the growth rate hypothesis (GRH; Sterner and Elser 2002) links growth rate with stoichiometry, proposing that there is a greater allocation of resources to P-rich ribosomal RNA under high-growth-rate conditions (exponential growth phase) generating a decrease in cellular N:P ratios (Elser et al.
2000). Moreover, recent studies have analyzed the effect of temperature on the phytoplankton resource use and stoichiometry, showing that higher temperatures may cause an increase in the phytoplankton optimal N:P sup- ply ratio (Thrane et al. 2017) as in the phytoplankton intracellular N:P ratios (Yvon-Durocher et al. 2015). It has been proposed that fewer P-rich ribosomes are needed to maintain the protein synthesis under warmer tempera- tures, generating a decrease in demand for P relative to N (Toseland et al. 2013). Hessen et al. (2017) found higher RNA content in phytoplankton under lower temperature treatments, indicating a compensatory mechanism to maintain growth in colder ecosystems. However, the RNA content was not reflected in the phytoplankton N:P ratios (Hessen et al. 2017). Hence, mechanisms explaining phytoplankton stoichiometric responses to temperature are still not clear, but these responses might reflect the effect of nutrients and temperature regimes on the growth rate and biomass. Furthermore, species composition may change according to their optimal temperature (Paerl and Huisman 2008) and optimal nutrient conditions to grow (Dokulil et al. 2007, Hillebrand et al. 2013), influencing the community physiological responses to environmental conditions.
The aim of this study was to evaluate the responses of a natural phytoplankton community to different nutri- ent concentrations and ratios under constant and fluctu- ating temperature conditions. To address this topic, we tested separate hypotheses for maximum growth rate during the exponential phase (H1) and maximum bio- mass achieved in the stationary phase (H2).
H1: The nonneutral effect of temperature fluctuations on phytoplankton growth rate as expected based on Jen- sen’s inequality depends on the interactions with nutri- ent supply concentrations and ratios. We test this hypothesis at the community level, where we propose three possible scenarios based on different effects of
resource supply on the phytoplankton TRN (Fig. 1).
Depending on how suboptimal nutrient supply alters the TRN, the effect of thermal variability can increase, decrease, or stay neutral across a range of resource supply gradient.
H2: Phytoplankton maximum biomass (K) reflects the interactive effect of nutrient availability and temperature regime. Kwill increase with increasing nutrient supply, but also with fluctuating temperature, reflecting the con- vex relationship between K and temperature. As for growth, we expect nutrient supply to alter the effect size of fluctuations.
METHODS
Experimental setup
A laboratory experiment was conducted using a natu- ral freshwater phytoplankton community. The commu- nity was collected from the Grafschaftsee lake (Germany, 53°33005″N; 7°58049″ E) in January 2017.
We used a factorial design including 25 nutrient treat- ments and two temperature conditions (constant and fluctuating). Two replicates were generated for each treatment combination, resulting in a total of 100 experi- mental units. Nutrient treatments were performed using five N and five P levels, generating a wide gradient of N:
P ratios (Table 1). N and P were added to the lake water as a unique pulse of K2HPO4and NaNO3at the begin- ning of the experiment. The total dissolved nutrients (lake nutrient concentrations plus added nutrients) were considered as the nutrient supply and ranged from 0.76 to 3.33lmol P/L and 22.7 to 62.3lmol N/L (Table 1).
Nutrients (except N and P) were added using growth medium stock solutions to avoid the limitation by other elements (Guillard and Lorenzen 1972). The experimen- tal design involved a constant temperature treatment and a day–night fluctuating temperature treatment. The experimental units were incubated in a fridge under con- trolled conditions and a set of LED lamps was added to simulate the sunlight spectrum in a day–night cycle. The lamp cycle generated fluctuations in the air temperature,
TABLE1. Nutrient treatments.
N (lmol/L)
P (lmol/L)
0.76 1.37 1.99 2.69 3.33
62.3 82 45 31 23 19
52.7 69 38 26 20 16
43.3 57 32 22 16 13
33.1 43 24 17 12 10
22.7 30 17 11 8 7
Notes:Supplied concentrations of N (rows) and P (columns), and the resulting N:P supply ratios (in bold). The concentra- tions and ratios correspond to the lake dissolved nutrient content plus the nutrient addition.
influencing the temperature in the treatments. These fluctuations established the fluctuating temperature treatments. The constant temperature conditions were assured using a heat plate that maintained the treat- ment’s temperature at 9° 1°C. Hence, all the treat- ments had the same average temperature at 9°1°C, but the fluctuating treatments oscillated by 4°1°C around this average (around 5°C during the night and around 13°C during the day). This average temperature was chosen to allow phytoplankton growth but also to minimize potential effects of a very high sudden increase in temperature on the natural community (lake in situ temperature at the sampling moment was 2°C).
Cell culture flasks (250 mL) were used as experiment units and filled with 200 mL lake water, previously fil- tered through a 53-lm mesh to remove zooplankton grazers. The flasks were daily shaken by hand and ran- domly rearranged to avoid sinking losses and possible location effects. Light conditions were the same for all treatments with a 16:8 day–night cycle and a light inten- sity of about 250 lmol photonm2s1. Temperature and light conditions were monitored with continuous data loggers (HOBO Pendantâ, Onset, Bourne, MA, USA) and optical density measurements (wavelength 440–450 nm) were performed daily during the experi- ment to monitor the phytoplankton growth. The experi- ment was interrupted at day 18 when the phytoplankton communities were expected to be in stationary state, but before a decline in biomass occurred.
Samplings and laboratory analysis
Samples were taken before the beginning of the experi- ment (lake water and added nutrient medium), during the phytoplankton exponential growth phase and at the end of the experiment, during the phytoplankton stationary growth phase. For each sample, we removed 50 mL from each flask without refilling. In vivo chlorophyllawas mea- sured with a hand fluorometer (AquaFluorTM; TURNER DESIGNS, San Jose, CA, USA) and samples for particu- late organic carbon (C), N and P were filtered onto acid- washed precombusted glass-fiber filters (Whatman GF/C).
Filters for particulate organic C and N were dried at 60°C for 3 days, put in tin capsules, and measured using an ele- mental analyzer (Flash EA 1112; Thermo Scientific, Walthman, MA, USA). Particulate organic P was mea- sured by molybdate reaction after digestion with potas- sium peroxydisulfate (K2S2O8) solution (Wetzel and Likens 2003). The filtered water was collected and analyzed for dissolved nutrients (PO43, NO3) by a continuous- flow analyzer (Euro EA 3000; HEKAtech GmbH, Weg- berg, Germany). To analyze the phytoplankton commu- nity, a subsample (7 mL) was taken and fixed with lugol 1%. Counting and identifying was done using an inverted microscope (Leica) based on Uterm€ohl’s method (1958).
Phytoplankton was identified to the species level and mor- phospecies were used when clear assignment of a species name was not possible.
Bioassay
After the phytoplankton communities reached their stationary growth phase, N and P pulses were added to identify the limiting nutrient in each treatment. For that, the two replicates of each treatment were mixed and equally redistributed in two flasks to ensure homoge- neous conditions. One replicate received an N (1 mmol per 100 mL), the other a P (50lmol per 100 mL) pulse.
The response of phytoplankton biomass was measured daily (optical density) for 9 d.
Statistical analysis
Particulate organic C (hereafter particulate C), chloro- phyllaconcentrations and optical density measurements were used as phytoplankton biomass proxies. Spearman correlations showed that particulate C was highly corre- lated with optical density (r=0.93,P<0.001), but the correlation coefficient of particulate C and chlorophylla was low (r=0.46; P<0.001; Appendix S1: Fig. S1).
Because of that, we used the daily optical density mea- surements to determine the phytoplankton growth curves. Repeated-measures ANOVAs using the mean values of the two replicates (n=50) were performed to test the effects of treatments and their changes over time on the phytoplankton N:P ratios, chlorophylla, and par- ticulate C. N:P ratios were calculated as the molar ratios of dissolved and particulate nutrients, corresponding to the N:P supply and phytoplankton N:P ratios, respectively.
The potential maximum phytoplankton biomass in the stationary growth phase (carrying capacity, K) and the maximum growth rate of the community in the expo- nential growth phase (rmax) were estimated for each treatment using the daily optical density measurements of both replicates together (n=50) and following the logistic growth curve: OD~K/(1+((KN0)/N0) * exp(rmax*time)), where OD is the optical density, timeis the experiment day, and N0the start value (opti- cal density at Day 1 in this case). GLMs including two- and three-way interactions were performed to analyze the effect of the nutrient and temperature treatments on rmaxandK.F-tests andPvalues were calculated to iden- tify significant effects and residuals analyses were used to corroborate the test assumptions. Response surfaces ofrmaxandKto the treatments and the nutrient-depen- dent variance effects sizes between temperature regimes were visualized as nonparametric thin-plate splines gener- ated with the Tps function in the fields R package. The variance ofrmaxandKeffects sizes between temperature regimes were calculated based on the log10-response ratio.
Because not all treatments were totally saturated at the end of the experiment,Kwas overestimated by the logistic growth curve applied for these cases (Appendix S1:
Table S1). We excluded the maximalKvalue of the fluctu- ating temperature treatment identified as outlier, because this value was far above the observed optical density
values and might lead to overestimated effect sizes for fluctuations onKdue to this point.
To evaluate the effect of P and N pulses in the bioassay we calculated the log-response ratio (LRR) for each treatment as ln(ODf/ODi), where ODf is the optical density at the end of the bioassay and ODi is the initial optical density (after the nutrient addi- tion). Differences in the LRR between temperature treatments were analyzed performing one-way ANO- VAs considering the data for N and P addition sepa- rately. Because there were no differences between temperature treatments (F=0.0, P=0.994 for P addition; and F=0.0, P=0.891 for N addition), lin- ear regressions were used to analyze the N and P supply effect on the LRR.
The final experiment sampling was processed to ana- lyze the phytoplankton community (one of the two repli- cates were randomly selected and counted, n=50).
Richness and the inverse Simpson diversity (i.e., effective number of species) were calculated for each sample as diversity indices. GLMs including two- and three-way interactions were performed to analyze the effects of nutrient supply and temperature regimes on diversity.
Analysis of similarity (ANOSIM) using Bray-Curtis index with 999 permutations was conducted to test dif- ferences in the phytoplankton community composition between constant and fluctuating temperature. A Simper test was applied to identify species contribution to the dissimilarity. As phytoplankton abundance (number of individuals per liter) was positively correlated with par- ticulate C (Spearman correlation, r=0.75, P<0.001) we used the abundance of species for the composition analyses. Rare species, defined as species found in only one sample with less than five individuals, were excluded from the ANOSIM.
P and N supply concentrations were used as continu- ous variables and were log-transformed for the analyses to avoid an overestimation of the effect at the highest concentrations. All graphs and statistical analyses were performed using R version 3.5.0 (R Development Core Team 2018).
RESULTS
Growth rate
The phytoplankton growth rate (rmax) was affected by supplied nitrogen (N) and phosphorus (P) concentrations as well as the temperature condition (significant three-way interaction; Table 2). Phytoplankton rmax
increased with increasing P supply, but decreased slightly with increasing N supply (Fig. 2; significant log(N)9log (P), log(N) and log(P) effects, Table 2; Appendix S1:
Fig. S2). Furthermore, temperature fluctuations decreased rmax in comparison with constant conditions (Fig. 2, Table 2; Appendix S1: Fig. S2). The highestrmax values were found under constant conditions at the high- est P and intermediate N levels and an N:P supply ratio
~13 (optimal nutrient supply; Fig. 2a, significant temper- ature9log(P) interaction; Table 2). In the fluctuating temperature treatments,rmaxincreased with the P supply level, independent of the N concentrations (Fig. 2b).
Compared to optimal nutrient conditions (where rmax showed the highest values under constant temperature), we found that suboptimal nutrient supply changed the quantitative response ofrmax(effect size) to temperature fluctuations. The greatest relative decrease inrmaxbecause of temperature fluctuations was observed for optimal nutrient supply conditions, and remained high under intermediate N:P supply ratios (~16–30; Fig. 3a;
Appendix S1: Fig. S3). However, the effect size of temper- ature fluctuations onrmaxdeclined at extreme N:P supply ratios. Based on the relative change inrmaxwith tempera- ture regimes across the nutrient conditions, we inferred that in comparison with optimal nutrient supply: (1) sub- optimal nutrient supply decreased rmax and thermal breadth, maintaining similar effect size of temperature fluctuations under intermediate N:P supply ratios (Fig. 1a, d); and (2) suboptimal nutrient supply decreased rmaxbut thermal breadth remained unchanged, reducing temperature fluctuation effect size in extreme N:P supply ratios (Fig. 1b, d). The results did not show any case in which the temperature regime effect size on rmax was
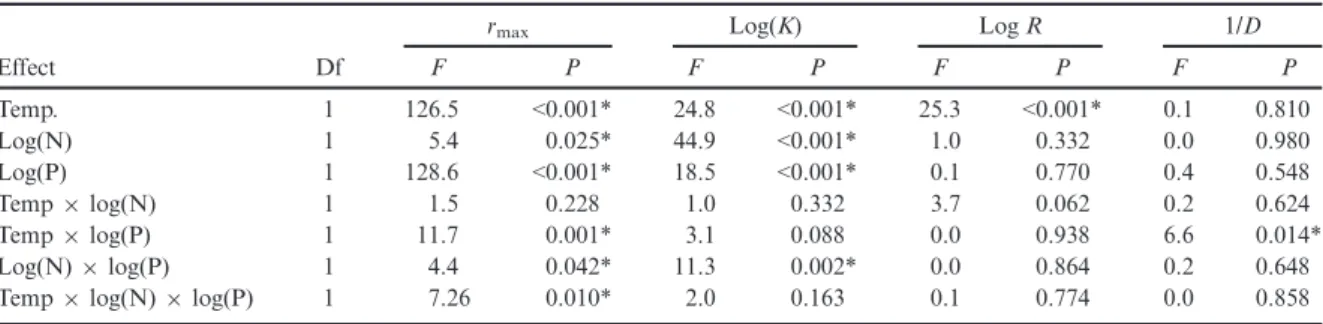
TABLE2. ANOVA of supply nutrient concentrations (N and P) and temperature (Temp) effects on phytoplankton growth rate (rmax), potential maximum biomass (K), richness (R) and the effective number of species (Inverse Simpson diversity, 1/D).
Effect
rmax Log(K) LogR 1/D
Df F P F P F P F P
Temp. 1 126.5 <0.001* 24.8 <0.001* 25.3 <0.001* 0.1 0.810
Log(N) 1 5.4 0.025* 44.9 <0.001* 1.0 0.332 0.0 0.980
Log(P) 1 128.6 <0.001* 18.5 <0.001* 0.1 0.770 0.4 0.548
Temp9log(N) 1 1.5 0.228 1.0 0.332 3.7 0.062 0.2 0.624
Temp9log(P) 1 11.7 0.001* 3.1 0.088 0.0 0.938 6.6 0.014*
Log(N)9log(P) 1 4.4 0.042* 11.3 0.002* 0.0 0.864 0.2 0.648
Temp9log(N)9log(P) 1 7.26 0.010* 2.0 0.163 0.1 0.774 0.0 0.858
Note:N, P,R, andKwere log-transformed for the analyses.
*Significant differences (P<0.05).
higher under suboptimal nutrient supply than under opti- mal nutrient conditions (Fig. 1c, d).
Potential maximum biomass
Increased N and P supply concentrations had a posi- tive effect on the potential maximum phytoplankton biomass (K), with the effect of N supply being more pro- nounced than P (Fig. 2; significant log(N)9log(P), log (N) and log(P) effects, Table 2; Appendix S1: Fig. S2).
For both temperature treatments, the highest K was found at similar nutrient concentrations (intermediate P and high N levels), but the N:P supply ratio resulting in maximum K was higher for constant temperature (Fig. 2c, d). Fluctuations in temperature increasedKin comparison with constant conditions, and noninterac- tive effects between temperature regimes and nutrient concentrations were found (Table 2). Greatest effect size of temperature fluctuations on Kwas found in similar nutrient conditions as for the maximalKvalues (Fig. 3b;
Appendix S1: Fig. S3). BecauseKwas overestimated in some of the treatments, we compared the results obtained forKwith the realized biomass during the sta- tionary growth phase measured as particulate C and
chlorophylla, which resulted in very similar conclusions than obtained for K (see Appendix S1: Table S2;
Appendix S1: Fig. S2, and Discussion).
Stoichiometry
The phytoplankton N:P ratios reflected the nutrient supply, increasing with increasing N concentration and decreasing with higher P concentration (Fig. 4;
Appendix S1: Table S2, Appendix S1: Fig. S4). However, stoichiometric responses of the phytoplankton community to nutrient concentrations were affected by temperature conditions and the growth phase (significant log(N)9log (P)9phase and temperature9log(P)9 phase interac- tions; Appendix S1: Table S2, Appendix S1: Fig. S4). In comparison to the exponential phase, phytoplankton N:P ratios were higher in the stationary growth phase, where the positive N effect and the inverse P effect were more pronounced (Fig. 4, significant log(N)9phase and log (P)9phase interactions; Appendix S1: Table S2). Conse- quently, the phytoplankton N:P ratios showed a higher mean and higher variance at the stationary than in the exponential phase (26.210.2 and 18.4 6.9, respec- tively). During the exponential phase, the phytoplankton FIG. 2. Thin-plate spline regression response surfaces of the effects of phosphorus and nitrogen on (a), (b) phytoplankton expo- nential growth rate (rmax, d1) and (c), (d) potential maximum biomass (K, based on optical density) under (a), (c) constant and (b), (d) fluctuating temperature regimes with equal mean temperature values. Circles: experimentally derived parameter estimates used for the thin-plate spline regressions. Crosses: nonsignificant parameter estimates (see Appendix S1: Table S1).
N:P ratios increased linearly with the N:P supply ratio;
however, the slope of this increase was below the 1:1 line (Fig. 4a). After reaching the stationary phase the phyto- plankton N:P equaled the supply ratio until a value of
~40, but remained relatively constant for higher values (Fig. 4b). The temperature fluctuations resulted in lower phytoplankton N:P ratios than at constant temperature in the exponential phase, but this difference decreased in stationary phase (Fig. 4, significant tempera- ture9phase interaction, Appendix S1: Table S2).
The additional bioassays we performed showed that the phytoplankton communities were N, P, and colim- ited according to the N:P supply ratios at the beginning of the experiment, but colimitation was present in a wide range of ratios. The effect (LRR) of nutrient pulses did not show differences among temperature conditions (F=0.0, P=0.994 for P addition; and F=0.0, P=0.891 for N addition). In the N-addition treatments, the LRR increased with P (log-transformed; t=4.7;
P<0.001) showing the highest values at lowest N and highest P levels (significant log(N)9log(P) effect, t=4.7;P<0.001; Appendix S1: Fig. S5). The oppo- site was found in the P-addition treatments, where the LRR increased with N (log-transformed, t=5.2;
P<0.001) and decreased with P (log-transformed, t=3.2;P=0.002 and significant log(N) 9log(P) inter- action,t =4.0;P<0.001; Appendix S1: Fig. S5).
Phytoplankton composition and diversity The phytoplankton abundance was dominated by chlorophytes, which represented between 88 and 98% of the total abundance across all treatments. Although the ANOSIM performed for the species abundance between
the temperature conditions showed significant effects, the dissimilarity was low (R=0.13;P=0.005) indicat- ing that the difference in temperature treatments had a FIG. 3. Thin-plate spline regression response surfaces of nutrient-dependent variance effect sizes (log10-response ratio, LRR) on (a) phytoplankton exponential growth rate (rmax, d1) and (b) maximum potential biomass (K, based on optical density). Circles:
experimentally derived parameter estimates used for the thin-plate spline regressions. Crosses: nonsignificant parameter estimates (see Appendix S1: Table S1).
FIG. 4. Phytoplankton cellular N:P ratios across the N:P supply ratios at (a) the exponential (t1) and (b) stationary (t2) growth phase for constant (CT, black) and fluctuating (FT, red) temperature conditions. The dotted lines indicate the 1:1 line in each case.
small effect on the species composition. Abundance vari- ations of the three dominant chlorophytes (Monoraphid- ium contortum,Dictyiosphaerium pulchellum, unicellular chlorophyta) explained 76% of the differences (Simper test; Appendix S1: Fig. S6).
The diversity indices of the phytoplankton community were affected by temperature treatments and P supply (Table 2). The effective number of species decreased with increasing P concentration at constant temperature (sig- nificant temperature9log(P) interaction, Table 2).
Richness increased with temperatures fluctuations but was not affected by nutrient concentrations (Table 2).
The mean richness was 35.1 (SD=4.01) for constant temperature treatments and 40.1 (SD =2.6) for fluctuat- ing temperature treatments, and the effective number of species mean was 3.7 (SD=0.5) and 3.7 (SD=0.6), respectively.
DISCUSSION
Our results showed that without changes in average temperature, fluctuating temperature alters phytoplank- ton growth rate, biomass, and stoichiometry. Phyto- plankton community rmax decreased under fluctuating temperature conditions, but the nutrient conditions influenced the effect size of thermal fluctuations onrmax, suggesting alterations of the community-wide TRN shape. Similarly, the nutrient context affectedKsensitiv- ity to thermal variability, but contrary to rmax,Kwas higher under fluctuating conditions. Responses to tem- perature treatments of phytoplankton stoichiometry supported the idea that cellular nutrient allocation can be adjusted according to the temperature regime.
Despite the physiological responses, small changes in phytoplankton species composition suggest that these responses cannot be explained to a large extent by varia- tion in species composition.
The observed decrease inrmaxwith temperature fluc- tuations suggests that variability in temperature implies a cost in performance (Vasseur et al. 2014). The charac- teristic nonlinear shape of TRNs causes temperature fluctuations to decrease an organism’s performance when the thermal variance reaches the concave region of the curve, which occurs above the inflection point and becomes stronger closer to and above the optimum (Bernhardt et al. 2018b). Our experiment was conducted at an average temperature of around 9°C, whereas the temperature at the initial sampling location was 2°C.
Given the difference between in situ and experimental temperature, we assume that our temperature treatments were above the inflection points of the community growth TRN where the convex low-temperature response switches to a concave response curve. Under this assumption, Jensen’s inequality (Jensen 1906, Ruel and Ayres 1999) predicts that temperature fluctuations should decrease the communityrmax compared to con- stant temperatures. Our experimental observations are in line with this prediction, suggesting that Jensen’s
inequality can predict the direction of thermal variability effects not only at the population level (Bernhardt et al.
2018b), but also at the community level.
It should be noted that temperature fluctuations do not necessarily have negative effects on rmax. Fluctua- tions can improvermaxif they lie within the lower convex region the TRN (Bernhardt et al. 2018b). Alternatively, fluctuations might be neutral forrmax if they lie within the linear region around the inflexion point or at the upper end of the TRN (Bernhardt et al. 2018b).
According to H1, the effect size (LRR) of thermal variability onrmaxwas shaped by nutrient conditions. At the single phytoplankton species level, recent results sug- gest that low nutrient concentrations strongly decrease thermal optimum and tolerance (Thomas et al. 2017). In this case, nutrient supply limitation would increase sensi- tivity to fluctuating temperatures (as proposed in Fig. 1c). Our results depict a more complex image at the community level. The growth performance of the studied community was more sensitive to temperature variability when nutrient supply was balanced (moderate N:P sup- ply ratios) across a wide range of nutrient concentrations (Fig. 1a). Contrary, under extreme unbalanced N:P sup- ply ratios the relative response of rmax to temperature fluctuations was small (Fig. 1b). Interestingly, nutrient concentrations per se only marginally affected sensitivity to thermal fluctuation as long as their ratio remained balanced.
Nevertheless, P and N concentrations had an impor- tant effect on phytoplanktonrmaxandKassociated with the respective growth phases. Phytoplankton rmax was positively influenced by P supply and K by N supply, indicating growth rate limitation by P and yield limita- tion by N. This conclusion is in concordance with the GRH (Sterner and Elser 2002) and previous findings (Klausmeier et al. 2004a) which propose an increase of organismal P concentration with higher growth rate for P-rich ribosomes, while greater N allocation to protein synthesis are required when biomass is generated under stationary growth. Consequently, phytoplankton N:P ratios were higher and showed more flexibility in the sta- tionary than in the exponential phase, reflecting the N:P supply (Klausmeier et al. 2004b, Hillebrand et al. 2013).
However, even in the stationary phase, phytoplankton stoichiometry seemed to be restricted by physiological limits, becoming saturated with increasing N:P ratios (Hall et al. 2005). This result suggested the presence of an elemental threshold ratio at higher N:P supply ratios (~40) that may reflect strict P-limitation as has been shown in terrestrial plants (Sardans et al. 2012). The bioassay showed that phytoplankton biomass increase was either P, N, or colimited according, in general, to the N:P supply ratios across the nutrient levels and tem- perature conditions (Appendix S1: Fig. S5). We found that N additions spiked biomass production across a variety of N and P supply rates, which indicates that at least some of the algae in the community were N-limited even under generally more P-limiting conditions. This
reflects previous studies in colimitation, which, however, tended to find more frequent colimitations in systems with low nutrient content (Harpole et al. 2011).
Constant temperature increased phytoplankton N:P ratios in comparison with temperature fluctuations. This suggests that although temperature fluctuations decreasedrmax, more P in relation to N was allocated in the phytoplankton cells in comparison with constant conditions. The earlier exponential growth and N incor- poration under constant temperature in the exponential phase probably influenced the higher phytoplankton N:
P ratios (data not shown).
Previous studies showed increases in phytoplankton N:P ratios with increasing temperature (de Senerpont Domis et al. 2014, Yvon-Durocher et al. 2015). These results support the theory that more P-rich ribosomes are needed in colder systems to compensate for lower efficiency in protein synthesis, decreasing the N:P ratios (Toseland et al. 2013). Nevertheless, the positive relation between temperature and N:P ratios was not always found (Hessen et al. 2017, Skau et al. 2017). The mecha- nisms and patterns of phytoplankton stoichiometric responses to temperature are not clear, but our results support the idea that cellular stoichiometry reflects the effects and interactions between temperature regimes, nutrient supply, and growth phase.
As expected in H2, fluctuating temperatures increased phytoplankton K in comparison with constant condi- tions, and the effect size of temperature fluctuations changed across the nutrient gradient. It has been shown in phytoplankton populations that the carrying capacity decreases nonlinearly with increasing temperature (Bern- hardt et al. 2018a). According to that, our results sug- gest that nonlinear averaging could be applied to predict Kresponses to thermal variability, but more studies are needed to test this. Savage et al. (2004) proposed that warmer temperatures increase maximum population growth rates and reduce the carrying capacity as a con- sequence of the higher metabolic rates (metabolic scaling theory; Brown et al. 2004). Our data showed similar pat- terns between temperature regimes, suggesting that simi- lar compensatory mechanisms could operate in this case, causing constant temperature to present lower K but higherrmaxthan fluctuating temperature conditions. As rmax,Ktended to increase the sensitivity to temperature variability when nutrient supply was balanced, but pre- senting a positive response to temperature fluctuations.
The analyses ofKresponses in our study were limited because not all the treatments were totally saturated at the end of the experiment generating an overestimation in someKvalues (Appendix S1: Table S1). For that rea- son, we comparedK(reflecting maximum potential bio- mass) with the realized phytoplankton biomass measured as chlorophyllaand particulate C in the sta- tionary growth phase. In concordance with the tempera- ture regimes and nutrient supply effects on K, chlorophyll a increased with temperature fluctuations and N supply (more than P supply; Appendix S1:
Table S2; Appendix S1: Fig. S2). But, particulate C was higher under constant conditions and increased with N and P supply (Appendix S1: Table S2; Appendix S1:
Fig. S2). These differences likely reflect a faster response of chlorophyll ato environmental changes in compar- ison to particulate C. This was supported by changes in the chlorophyll aresponse to temperature regimes and nutrient supply between growth phases in our experi- ment. Constant temperature and P supply increased chlorophyll a during the exponential growth phase, whereas the opposite was shown in the stationary growth phase. In concordance with previous results, chlorophyll a responses reflected the interactive effects of nutrient concentrations and temperature on phytoplankton bio- mass (Kraemer et al. 2017; Appendix S1: Table S2;
Appendix S1: Fig. S2).
Even though the average temperature did not change in our study, temperature fluctuation had an effect on the physiological responses of the phytoplankton com- munities. This is in concordance with the idea that phy- toplankton species can acclimate to short-term temperature variations by changing biochemical com- position (Woods et al. 2003) and the balance between photosynthesis and respiration (Staehr and Birkeland 2006). Our results showed that the phytoplankton bio- mass responses to temperature conditions depended on the estimator used (chlorophyll a, particulate C, K based on optical density) and on the growth phase, sug- gesting that these factors should be considered in the interpretation of experimental results. This is relevant, taking into account that experiments are carried out using variable phytoplankton biomass estimations, growth conditions, and considering that some micro- cosms experiments are sampled only once because they are volume limited.
Small differences in species composition between treatments found in the analyzed communities suggest that the phytoplankton physiological responses are not simply reflecting different community composition.
Whereas we conducted this experiment with a single inoculum, the high diversity of the assemblage and the lack of strong shifts in composition reflects a general physiological response rather than one driven by species identity. Similarly, de Senerpont Domis et al. (2014) found changes in phytoplankton biomass and stoi- chiometry in response to different temperature and P concentration without a change in phytoplankton com- position. Related to this, Thomas et al. (2012) showed that adaptation to local temperature conditions is not highly phylogenetically constrained. As our experiment was a short-term experiment, it is reasonable to expect that changes in phytoplankton community composition would need more time to be detected. Also, changes in species composition were restricted in the closed experi- mental units to the initial species composition (site- dependent effect), which had, for example, low cyanobacteria presence (Striebel et al. 2016, Kraemer et al. 2017).
Higher richness was found under fluctuating tempera- ture in comparison with constant temperature. This is in concordance with the idea that environmental fluctua- tions may induce species coexistence (Descamps-Julien and Gonzalez 2005). However, the effective number of species did not differ between temperature treatments, suggesting that although temperature fluctuations altered richness, they did not influence the community evenness. Additionally, the decrease in the effective num- ber of species with increasing P supply that occurred only under constant temperature shows that temperature patterns can be influenced by interactions with nutrient concentrations.
Strong interactive effects of temperature regimes and nutrient supply on phytoplankton community growth rate, biomass, and stoichiometry show the relevance of considering these factors to predict phytoplankton development. Our results suggest that in systems with high daily temperature variation phytoplankton commu- nity growth and biomass may differ accordingly to the nutrient context. Detected changes in stoichiometry at the community level implies a differential resource allo- cation according to the temperature regimes. These changes in nutrient ratios can affect the nutrient fluxes into trophic levels. Interactive effects of temperature regimes and nutrient conditions observed in this study may also have implications for the analysis of phyto- plankton performance in different climatic regions, and has potentially large consequences under predicted changes in environmental variability under global change.
ACKNOWLEDGMENTS
We thank Dorothee Hodapp for the statistical advice and Patrick Thomas for the comments that helped to improve this paper. We thank Silvia Heim, Alexander Wacker, Heike Rickels, and Andrea Gall for technical support. MG was supported by the Uruguayan Agency of Investigation and Innovation (ANII) and the German Academic Exchange Service (DAAD). MS, HH, and AMK acknowledge funding by the German Research Foundation (DFG: STR 1383/1-1, STR 1383/6-1, HI 848/15-1, HI 848/24-1 within the priority program DynaTrait SPP 1704 and KO5330/1-1).
LITERATURECITED
Bernhardt, J. R., J. M. Sunday, P. L. Thompson, and M. I.
O’Connor. 2018b. Nonlinear averaging of thermal experience predicts population growth rates in a thermally variable envi- ronment. Proceedings of the Royal Society B 285:20181076.
Bernhardt, J. R., J. M. Sunday, and M. I. O’Connor. 2018a.
Metabolic theory and the temperature-size rule explain the temperature dependence of population carrying capacity.
American Naturalist 192:687–697.
Brown, J. H., J. F. Gillooly, A. P. Allen, V. M. Savage, and G. B.
West. 2004. Toward a metabolic theory of ecology. Ecology 85:1771–1789.
Cross, W. F., J. M. Hood, J. P. Benstead, A. D. Huryn, and D.
Nelson. 2015. Interactions between temperature and nutrients across levels of ecological organization. Global Change Biol- ogy 21:1025–1040.
Descamps-Julien, B., and A. Gonzalez. 2005. Stable coexistence in a fluctuating environment: an experimental demonstration.
Ecology 86:2815–2824.
Deutsch, C. A., J. J. Tewksbury, R. B. Huey, K. S. Sheldon, C.
K. Ghalambor, D. C. Haak, and P. R. Martin. 2008. Impacts of climate warming on terrestrial ectotherms across latitude.
Proceedings of the National Academy of Sciences 105:6668– 6672.
Dokulil, M. T., K. Donabaum, and K. Teubner. 2007. Modifi- cations in phytoplankton size structure by environmental constraints induced by regime shifts in an urban lake. Hydro- biologia 578:59–63.
Dowd, W. W., F. A. King, and M. W. Denny. 2015. Thermal variation, thermal extremes and the physiological perfor- mance of individuals. Journal of Experimental Biology 218:1956–1967.
Elser, J. J., R. W. Sterner, E. Gorokhova, W. F. Fagan, T. A.
Markow, J. B. Cotner, J. F. Harrison, S. E. Hobbie, G. M.
Odell, and L. J. Weider. 2000. Biological stoichiometry from genes to ecosystems. Ecology Letters 3:540–550.
Estay, S. A., S. Clavijo-Baquet, M. Lima, and F. Bozinovic.
2011. Beyond average: an experimental test of temperature variability on the population dynamics of Tribolium con- fusum. Population Ecology 53:53–58.
Estay, S. A., M. Lima, and F. Bozinovic. 2014. The role of tem- perature variability on insect performance and population dynamics in a warming world. Oikos 123:131–140.
Guillard, R. R., and C. J. Lorenzen. 1972. Yellow–green algae with chlorophyllide c. Journal of Phycology 8:10–14.
Hall, S. R., V. H. Smith, D. A. Lytle, and M. A. Leibold. 2005.
Constraints on primary producer N:P stoichiometry along N:
P supply ratio gradients. Ecology 86:1894–1904.
Harpole, W. S. et al. 2011. Nutrient co-limitation of primary producer communities. Ecology Letters 14:852–862.
Hessen, D. O., O. T. Hafslund, T. Andersen, C. Broch, N. K.
Shala, and M. W. Wojewodzic. 2017. Changes in stoichiome- try, cellular RNA, and alkaline phosphatase activity of chlamydomonas in response to temperature and nutrients.
Frontiers in Microbiology 8:1–8.
Hillebrand, H., G. Steinert, M. Boersma, A. Malzahn, C. L.
Meunier, C. Plum, and R. Ptacnik. 2013. Goldman revisited:
Faster-growing phytoplankton has lower N:P and lower stoi- chiometric flexibility. Limnology and Oceanography 58:2076– 2088.
Jensen, J. L. W. V. 1906. Sur les fonctions convexes et les inegalites entre les valeurs moyennes. Acta Mathematica 30:175–193.
Klausmeier, C. A., E. Litchman, T. Daufresne, and S. A. Levin.
2004a. Optimal nitrogen-to-phosphorus stoichiometry of phytoplankton. Nature 429:171–174.
Klausmeier, C. A., E. Litchman, and S. A. Levin. 2004b.
Phytoplankton growth and stoichiometry under multiple nutrient limitation. Limnology and Oceanography 49:1463– 1470.
Koussoroplis, A. M., S. Pincebourde, and A. Wacker. 2017.
Understanding and predicting physiological performance of organisms in fluctuating and multifactorial environments.
Ecological Monographs 87:178–197.
Kraemer, B. M., T. Mehner, and R. Adrian. 2017. Reconciling the opposing effects of warming on phytoplankton biomass in 188 large lakes. Scientific Reports 7:10762.
Maran~on, E., M. P. Lorenzo, P. Cerme~no, and B. Mouri~no-Car- ballido. 2018. Nutrient limitation suppresses the temperature dependence of phytoplankton metabolic rates. ISME Journal 12:1836–1845.
Moss, B. et al. 2011. Allied attack: climate change and eutroph- ication. Inland Waters 1:101–105.
Paerl, H. W., and J. Huisman. 2008. Blooms like it hot. Science 320:57–58.
R Development Core Team, R. 2018. R: a language and envir- onment for statistical computing. R Foundation for Statisti- cal Computing, Vienna, Austria. https://www.R-project.org/
Ruel, J. J., and M. P. Ayres. 1999. Jensen’s inequality predicts effects of environmental variation. Trends in Ecology & Evo- lution 14:361–366.
Sardans, J., A. Rivas-Ubach, and J. Penuelas. 2012. The C:N:P~ stoichiometry of organisms and ecosystems in a changing world: a review and perspectives. Perspectives in Plant Ecol- ogy, Evolution and Systematics 14:33–47.
Savage, V. M., J. F. Gillooly, J. H. Brown, G. B. West, and E. L.
Charnov. 2004. Effects of body size and temperature on pop- ulation growth. American Naturalist 163:429–441.
Schaum, C. E., A. Buckling, N. Smirnoff, D. J. Studholme, and G. Yvon-Durocher. 2018. Environmental fluctuations acceler- ate molecular evolution of thermal tolerance in a marine dia- tom. Nature Communications 9:2813.
de Senerpont Domis, L. N., D. B. Van de Waal, N. R. Helmsing, E. Van Donk, and W. M. Mooij. 2014. Community stoi- chiometry in a changing world: combined effects of warming and eutrophication on phytoplankton dynamics. Ecology 95:1485–1495.
Skau, L. F., T. Andersen, J. E. Thrane, and D. O. Hessen. 2017.
Growth, stoichiometry and cell size; temperature and nutrient responses in haptophytes. PeerJ 5:e3743.
Staehr, P. A., and M. J. Birkeland. 2006. Temperature acclima- tion of growth, photosynthesis and respiration in two meso- philic phytoplankton species. Phycologia 45:648–656.
Sterner, R. W., and J. J. Elser. 2002. Ecological stoichiometry.
Princeton University Press, Princeton, New Jersey, USA.
Striebel, M., S. Schabh€uttl, D. Hodapp, P. Hingsamer, and H.
Hillebrand. 2016. Phytoplankton responses to temperature increases are constrained by abiotic conditions and commu- nity composition. Oecologia 182:815–827.
Tadonleke, R. D. 2010. Evidence of warming effects on phytoplankton productivity rates and their dependence on
eutrophication status. Limnology and Oceanography 55:973– 982.
Thomas, M. K., C. T. Kremer, C. A. Klausmeier, and E. Litch- man. 2012. A global pattern of thermal adaptation in marine phytoplankton. Science 338:1085–1088.
Thomas, M. K., M. Aranguren-Gassis, C. T. Kremer, M. R.
Gould, K. Anderson, C. A. Klausmeier, and E. Litchman.
2017. Temperature-nutrient interactions exacerbate sensitivity to warming in phytoplankton. Global Change Biology 23:3269–3280.
Thrane, J. E., D. O. Hessen, and A. Andersen. 2017. Plasticity in algal stoichiometry: Experimental evidence of a tempera- ture-induced shift in optimal supply N:P ratio. Limnology and Oceanography 62:1346–1354.
Toseland, A. et al. 2013. The impact of temperature on marine phytoplankton resource allocation and metabolism. Nature Climate Change 3:979–984.
Uterm€ohl, H. 1958. Zur Vervollkommnung der quantitativen Phytoplankton-Methodik. MittIntVerLimnol 9:1–38.
Vasseur, D. A., J. P. DeLong, B. Gilbert, H. S. Greig, C. D. G.
Harley, K. S. McCann, V. Savage, T. D. Tunney, and M. I.
O’Connor. 2014. Increased temperature variation poses a greater risk to species than climate warming. Proceedings of the Royal Society B 281:20132612.
Verbeek, L., A. Gall, H. Hillebrand, and M. Striebel. 2018.
Warming and oligotrophication cause shifts in freshwater phytoplankton communities. Global Change Biology 24:
4532–4543.
Wetzel, R. G., and G. E. Likens. 2003. Limnological analyses.
Springer-Verlag, New York, New York, USA.
Woods, H. A., M. Makino, J. B. Cotner, S. E. Hobbie, J. F. Har- rison, K. Acharya, and J. J. Elser. 2003. Temperature and the chemical composition of poikilothermic organisms. Func- tional Ecology 17:37–245.
Yvon-Durocher, G., M. Dossena, M. Trimmer, G. Woodward, and A. P. Allen. 2015. Temperature and the biogeography of algal stoichiometry. Global Ecology and Biogeography 24:
562–570.
SUPPORTINGINFORMATION
Additional supporting information may be found in the online version of this article at http://onlinelibrary.wiley.com/doi/
10.1002/ecy.2834/suppinfo