https://doi.org/10.1007/s00227-020-03738-2 ORIGINAL PAPER
Sea surface phytoplankton community response to nutrient and light changes
Nur Ili Hamizah Mustaffa1 · Liisa Kallajoki1 · Helmut Hillebrand1,2,3 · Oliver Wurl1,4 · Maren Striebel1
Received: 19 December 2019 / Accepted: 6 July 2020
© The Author(s) 2020
Abstract
The sea surface microlayer (SML) is the boundary layer between the ocean and the atmosphere and plays a unique role in marine biogeochemistry. Phytoplankton communities in this uppermost surface layer are exposed to extreme ultraviolet (UV) radiation and potentially high nutrient supplies. In order to understand the response of SML communities to such contrasting conditions, we conducted experiments at three different sites, the North Sea (open ocean) and two sites, outer and middle fjord, in the Sognefjord, Norway, with differing physical and chemical parameters. We manipulated light, nitrogen (N) and phosphorus (P) supply to natural communities collected from the SML and compared their response to that of the underlying water (ULW) communities at 1-m depth. Phytoplankton communities in both SML and ULW responded significantly to N addition, suggesting the upper 1-m surface phytoplankton communities were N-limited. While phytoplankton growth rates were higher with high N and high light supply, biomass yield was higher under low light conditions and with a combined N and P supply. Furthermore, biomass yield was generally higher in the ULW communities compared to SML communities.
Nutrient and light effects on phytoplankton growth rates, particulate organic carbon (POC) and stoichiometry varied with geographical location. Phytoplankton growth rates in both SML and ULW at the open ocean station, the site with highest salinity, did not respond to light changes, whereas the communities in the middle fjord, characterized by high turbidity and low salinity, did experience light limitation. This work on the upper surface phytoplankton communities provides new insights into possible effects of coastal darkening and increases understanding of oceanic biogeochemical cycling.
Introduction
The sea-surface microlayer (SML), defined as the diffusive boundary layer between the ocean and atmosphere (Liss and Duce 2005), covers the ocean ubiquitiously on a global scale (Wurl et al. 2011). With a typical thickness between 40 and 100 µm (Zhang et al. 2003), the SML plays an important role in the exchange of gas, heat and particles and, as a result, has a remarkable role in marine biogeochemical cycles and the control of climate (Wurl et al. 2017). The stability of the SML, which is created by surface tensions, provides a unique micro-habitat for microbes, the “neuston”, by the enrichment of particulate and dissolved organic matter (Hardy 1982).
For example, surfactants in the SML (Wurl et al. 2011), chromophoric dissolved organic matter (CDOM) (Galgani and Engel 2016) and bacterioneuston communities (Stolle et al. 2011) have been reported to be enriched up to 400%
compared to the underlying water (ULW) at 1-m depth.
Nutrients such as nitrogen (N) and phosphorus (P) have been shown to be enriched in the SML due to both wet and dry atmospheric deposition and may be linked to higher surface
Responsible Editor: U. Sommer.
Reviewed by A. Deininger and an undisclosed expert.
Electronic supplementary material The online version of this article (https ://doi.org/10.1007/s0022 7-020-03738 -2) contains supplementary material, which is available to authorized users.
* Nur Ili Hamizah Mustaffa iliehamizah@gmail.com
1 Institute for Chemistry and Biology of the Marine Environment, Carl Von Ossietzky Universität Oldenburg, Schleusenstrasse 1, 26382 Wilhelmshaven, Germany
2 Helmholtz-Institute for Functional Marine Biodiversity at the University of Oldenburg (HIFMB), Ammerländer Heerstrasse 231, 26129 Oldenburg, Germany
3 Alfred Wegener Institute, Helmholtz-Centre for Polar and Marine Research (AWI), Am Handelshafen 12, 27570 Bremerhaven, Germany
4 Center for Marine Sensors, Institute for Chemistry and Biology of the Marine Environment, Carl Von Ossietzky Universität Oldenburg, Schleusenstrasse 1, 26382 Wilhelmshaven, Germany
productivity (Williams 1967). Nutrients in the near-surface layer can be higher compared to the remaining euphotic zone (Goering and Wallen 1967), especially in association with sea slicks, where wave-dampening effects are the result of excessive accumulation of particles and microbes (Wurl et al. 2016). Although conditions in the SML can be harsh due to intense ultraviolet radiation and large temperature variability, the SML is a unique habitat with a higher abun- dance of organisms ranging from bacteria to phytoplankton (Hardy and Apts 1984; Obernosterer et al. 2005; Cunliffe et al. 2009) and zooplankton (Rahlff et al. 2018) compared to ULW. However, enrichment or depletion of phytoplank- ton in the SML has been shown to vary both spatially and temporarily, depending on weather conditions, intensities of radiation and vertical stratification (Cullen et al. 1989).
Although the general effects of light and nutrients in the water column below 5 m have been well explored (Berger et al. 2006; Martiny et al. 2013; Neale et al. 2014), the response to these variables by the communities in the near- surface layer, particularly the SML, remains poorly under- stood. This lack of research into communities is, in part, due to interference in the integrity of the near-surface layer and SML caused by the simple presence of research vessels and sampling gear. Differences in light between the SML and ULW could be expected based on the general pattern that intensity decreases with depth in the water column due to absorption (Fleischmann 1989). However, the distribution of downward irradiance, regulated by the adsorbing and scat- tering effects of various components, can be highly variable in the near-surface layer of the water column (Gernez et al.
2011). In particular, the SML, enriched with organisms, organic matter and gel particles (Cunliffe et al. 2011) has the potential for significant absorption and backscattering (Stramski et al. 2019). The abundance of organisms in the SML primarily originates from the underlying water, trans- ported upward by physical processes such as positive buoy- ancy and bubble scavenging (Joux et al. 2006). Nonethe- less, intensive light and ultraviolet (UV) radiation frequently limit the activity and abundance of photosynthetic organisms close to the sea surface (Williams et al. 1986). Some phyto- plankton species such as dinoflagellates (i.e., Prorocentrum- micans) can protect themselves from photo-degradation by producing UV-absorbing compounds, e.g., mycosporin-like amino acids (MAAs) (Tilstone et al. 2010); however, other species, e.g., coccolithophorids (Williams et al. 1986) may have a better chance of survival in the water column below the surface rather than in the SML. Consequently, phyto- plankton that inhabits the SML and their responses to the changes in the supply of resources (i.e., high nutrient and intensive radiation) are likely to differ from the ULW com- munity. In terms of stoichiometry, the response of phyto- plankton N:P ratio has been shown to differ among species (Klausmeier et al. 2004; Sterner et al. 2008), depending on
abiotic conditions as well as nutrient availability (Rhee and Gotham 1981). Moreover, the interactive effect of light and nutrients on phytoplankton stoichiometry differs between phytoplankton communities (i.e., composition and diversity) and geographical locations characterized by different hydro- graphic conditions (Dickman et al. 2006). The proximity to the land makes coastal and fjord environments more vulner- able to anthropogenic activities as well as land runoff and soil erosion, consequently leading to increased nutrient load and darkening of water (Dupont and Aksnes 2013). How the stoichiometry differs between phytoplankton communi- ties of the SML in terms of available resources remains an unanswered question.
Light and nutrients have also been shown to influence the expression of extracellular carbonic anhydrase (eCA) in phytoplankton (Rigobello-Masini et al. 2003). eCA is a zinc metalloenzyme that catalyzes the interconversion of HCO3− and CO2 at the cell surface (Aizawa and Miyachi 1986). In some marine species, eCA plays an important role in photosynthesis as it converts the readily available carbon- ate externally into CO2 within the cell’s diffusion layer for more rapid uptake. eCA has been reported to be enriched in the SML as much as a factor of two (Mustaffa et al. 2017a) and is regulated by phytoplankton depending on physiologi- cal state (i.e., growth rate) (Reinfelder 2011). Light is an important factor in the expression of eCA. Experiments on the microalga Tetraselmis gracilis resulted in a 50% decline in eCA activity when the microalga were transferred from light-to-dark conditions (Rigobello-Masini et al. 2003). The level of eCA expression is also dependent on taxonomic composition and cell size of a phytoplankton community (Martin and Tortell 2006, 2008). Quantification of eCA con- centration could therefore provide a further understanding of the physiological strategy of phytoplankton communities in the upper surface water response to light and nutrient changes.
This study aims to understand the response of SML phytoplankton communities to different nutrient (N and P) concentrations and stoichiometric ratios under two light regimes. We conducted on-board incubation experiments at three locations, the North Sea (open ocean) and two loca- tions in the Sognefjord, Norway, in the outer and middle fjord. The open ocean station was characterized by high salinity and low turbidity compared to the outer and middle fjords stations. Increasing turbidity along a gradient in the Sognefjord results in a decrease in light penetration from the outer to inner fjord (Mascarenhas et al. 2017). Water was taken from the SML and the ULW at depth of 1-m and enriched with 25 different N and P concentrations (Table 1).
The treated samples were then incubated under high light ambient SML (“HL ambient SML”), low light SML (“LL SML”), low light ambient ULW (“LL ambient ULW”) and
high light ULW (“HL ULW”) conditions until the communi- ties reached stationary growth phase.
Three hypotheses were tested in this study:
H1: The SML and ULW communities are well adapted to the light intensities at their origin depth. Therefore, we expect a reduction in growth rate and biomass produc- tion when transferring SML communities from the “HL ambient SML” to the “LL SML” and ULW communities from “LL ambient ULW” to HL ULW”. We also expect that the expression of eCA enzyme will be higher in high light treatment compared to low light treatment, suggest- ing that light is a fundamental driver for the expression of eCA.
H2: The communities in the upper surface waters of SML and ULW are co-limited by N and P based on the low initial concentrations of N and P at all stations. However, the extent of limitation differs depending on the origin of the communities’ geographical location (station) and depth. We therefore expect the community in the open
ocean to be more limited by nutrients as a result of the decline in nutrient supply created by the distance from land-based nutrient sources. The ULW community will be more limited by both nutrients compared to the SML which is often enriched with nutrients due to wet and dry deposition. The cellular N:P ratio in the natural com- munities is expected to mirror the N:P supply ratio.
H3: Effects of light, nutrients and their interaction are dependent on the geographical location (station). Dif- ferent hydrographic conditions (i.e., salinity, turbidity) at each station influence the response of phytoplankton toward light and nutrient changes. Therefore, we expect the phytoplankton community of the middle fjord to be more responsive to nutrients and light changes and react faster as they experience changes in nutrient supplies more frequently and more strongly than the other com- munities. Thus, the strength of the light and nutrient effect will increase along the station gradient from the open ocean to the middle fjord.
Materials and method
Seawater collectionSeawater samples were collected during the HE491 cruise on the R/V Heincke from July 8 to July 28, 2017. Sampling sites included three different locations:open ocean station in the North Sea (Site 1), outer Sognefjord station (Site 2) and middle Sognefjord station (Site 3) (Supplementary Fig. 1).
The Sognefjord is the world’s second-longest (205 km) and deepest (up to 1308 m) fjord. In this study, a remote-con- trolled catamaran, Sea Surface Scanner (S3) (Ribas-Ribas et al. 2017), was deployed to collect discrete seawater sam- ples from the SML and from a depth of 1 m (ULW). This method of sampling has shown to allow for accurate, fine- scale sampling with as little disturbance of the SML and ULW as possible. The SML samples were collected at a thickness of approximately 80 µm using six rotating glass disks mounted between the hulls of the catamaran (Ribas- Ribas et al. 2017). The glass disks (diameter of 60 cm) were immersed to a water depth of approximately 15 cm and rotated at 7 rotations per minute. To obtain a sample, the disks rotated through the SML surface and used surface tension to move the sample toward the disks. Polycarbonate wipers mounted between the glass disks then wiped off the collected sample on the ascending side. The collected SML was pumped through a flow cell equipped with conductivity and temperature sensors (Model: MU6010H, VWR, Ger- many). The ULW samples were simultaneously taken from a 1-m depth and pumped through a second flow cell. Using this method, 20 L samples were collected from the SML and ULW layers within 1 h. The collected samples were
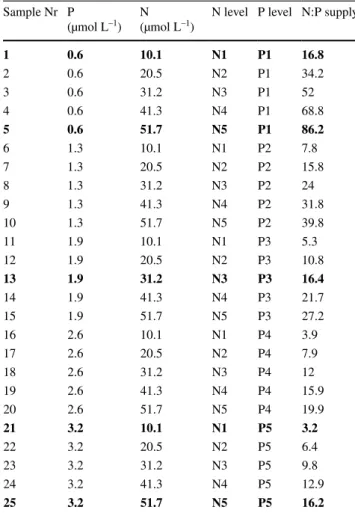
Table 1 Concentrations of nitrogen (N) and phosphorus (P) and N:P supply ratio added to the experimental units
Bold indicates as selected samples for the cell volume and eCA con- centration
Sample Nr P
(µmol L–1) N
(µmol L–1) N level P level N:P supply
1 0.6 10.1 N1 P1 16.8
2 0.6 20.5 N2 P1 34.2
3 0.6 31.2 N3 P1 52
4 0.6 41.3 N4 P1 68.8
5 0.6 51.7 N5 P1 86.2
6 1.3 10.1 N1 P2 7.8
7 1.3 20.5 N2 P2 15.8
8 1.3 31.2 N3 P2 24
9 1.3 41.3 N4 P2 31.8
10 1.3 51.7 N5 P2 39.8
11 1.9 10.1 N1 P3 5.3
12 1.9 20.5 N2 P3 10.8
13 1.9 31.2 N3 P3 16.4
14 1.9 41.3 N4 P3 21.7
15 1.9 51.7 N5 P3 27.2
16 2.6 10.1 N1 P4 3.9
17 2.6 20.5 N2 P4 7.9
18 2.6 31.2 N3 P4 12
19 2.6 41.3 N4 P4 15.9
20 2.6 51.7 N5 P4 19.9
21 3.2 10.1 N1 P5 3.2
22 3.2 20.5 N2 P5 6.4
23 3.2 31.2 N3 P5 9.8
24 3.2 41.3 N4 P5 12.9
25 3.2 51.7 N5 P5 16.2
stored in black high-density polyethylene canisters before being transferred into incubation bottles. The light intensi- ties in the SML and ULW were measured using a spherical light sensor with a data logger (Licor light meter LI-250A).
Meteorological parameters, including wind speed and solar radiation, were recorded using a VantagePro 2 weather sta- tion (Davis Instrument, USA) attached to the mast of the S3 at a height of 3 m. The ambient photosynthetic attenuate radiation (PAR) was measured using a quantum sensor (MQ- 220, Apogee Instrument).
Incubation experiment setup
The effect of light, nutrient levels and their interaction on phy- toplankton growth rate and growth capacity in the SML and ULW samples were determined for each site and carried out on the R/V Heincke. At each site, initial measurements were made to determine N and P concentrations for both sample depths.
The initial N and P concentrations in the SML at all stations ranged from 0.01 to 0.03 µmol L–1 and 0.05 to 0.07 µmol L–1, respectively (Supplementary Table 1). Meanwhile, the N and P concentrations in the ULW at all stations ranged from 0.02 to 0.04 µmol L–1 and 0.05 to 0.10 µmol L–1, respectively (Sup- plementary Table 1). To set up the experimental design, 250- mL culture flasks (Sarstedt, T-75 with filter cap) were each filled with 200 mL sample and N and P were added to create 25 different combinations of N (range 10.1–51.7 µmol L–1) and P (range 0.6–3.2 µmol L–1) concentrations with a resulting range of molar N:P between 3.2 and 86.2 (Table 1). The sam- ples were incubated under two light conditions, high light and reduced light conditions. The reduced light conditions were created by wrapping each bottle with neutral density LEE fil- ter standard foils to establish 50% light reduction. The foil does not change the wavelength and spectrum but remove the UV radiation. High light conditions represented the condition originally occurring at the surface layer (ambient SML) while low light conditions represented the light conditions at 1-m depth (ambient ULW). Every incubation experiment consisted of 100 bottles in total. The design then included two depths, 25 nutrient levels and two light levels. Temperature and light were monitored continuously with data-loggers (HOBO UA-002- 064 Pendant Datenlogger, Germany). Averages temperatures in the “HL ambient SML” and “LL ambient ULW” treatments were held at 20.12 ± 3.9 °C and 19.8 ± 3.3 °C, respectively.
Meanwhile, the averages of light intensities were maintained at 4372 lux in “HL ambient SML” and 2724 lux in “LL ambi- ent ULW” treatment. The bottles were gently shaken by hand daily. The optical density (OD) of each bottle was measured daily using a custom-made device as a proxy for biomass (Frank et al. 2020). Each experiment was stopped and subse- quently sampled when it was determined that the phytoplank- ton had reached the stationary growth phase as determined by
reaching maximum OD, i.e., 38 days for open ocean, 30 days for outer fjord and 13 days for middle fjord.
Chemical analyses
After all phytoplankton reached the stationary growth phase, samples for particulate nutrient concentrations were obtained by filtering 20 mL samples onto acid-washed and pre-combusted GF/C glass-fiber filters (Whatman, UK) and stored at − 20 °C until further analyses. Particulate organic phosphorous (POP) was determined spectrophotometri- cally using molybdate reaction after sulfuric acid digestion (Grasshoff et al. 1999). Filters for particulate organic C and N were oven-dried for 48 h at 58 °C, placed in tin capsules and measured using an elemental analyzer (Euro EA 3000, HEKAtech GmbH, Wegberg, Germany). The concentration of eCA was determined from selected treatment samples (see Table 1) and quantified using a fluorometric assay described in Mustaffa et al. (2017b).
Phytoplankton community composition
Unfiltered subsamples were fixed with alkaline Lugol’s iodine (1% final concentration) and stored in dark glass bot- tles until analysis. Microscopic determination and count- ing was done using an inverted microscope (Leica®, Ger- many) according to Utermöhl (1958). The phytoplankton was counted at 200 × magnification in two stripes arranged in a cross. Flagellates smaller than 5 μm were counted at 400 × magnification within 10 grids. The counts were con- verted to cells mL–1. Species cell volumes were calculated based on the shape of the cell (Hillebrand et al. 1999) and expressed as µm3 cell–1. Cell numbers and mean volumes were measured from selected incubated samples (see Table 1) using a Beckman Z2 counter (Hillebrand et al.
1999).
Statistical analyses
All statistical procedures and graphs were done using R ver- sion 3.5.3 (R Core Team 2019). The potential maximum phytoplankton biomass in the stationary growth phase (car- rying capacity, K) as well as the maximum growth rate of the community in the exponential growth phase (rmax) were estimated for each treatment (n = 25) using the daily opti- cal density measurements of both replicates by fitting the logistic growth curve:
where OD is the optical density, time is the experiment day and N0 the initial value of OD. We derived estimates for
OD= K
( 1+
(K−N0
N0
)
×exp(−rmax×time)),
rmax and K from these regressions, which were used to test H1–H3. The carrying capacity (K) and POC concentration showed a highly significant correlation (Spearman, r = 0.87, p < 0.001), and therefore, we only presented POC concentra- tion as a biomass proxy in our study. Linear mixed-effects models (LME) were determined with functions lmer4, lsmean, LmerTest and MASS (Bates et al. 2014). First, we analyzed a full LME for rmax, POC, N:P ratio and eCA, respectively, that included all manipulations of light (“HL ambient SML”, “LL SML”, “LL ambient ULW”, and “HL ULW”), depth (SML vs ULW), P and N concentrations as fixed factors and “location” as a random factor. Secondly, we applied a stepwise backward reduction in order to remove the least contributing factors and to obtain the most par- simonious model based on the lowest Akaike information criterion (AIC) (Gruner et al. 2017). The experimental manipulations were fully orthogonal, allowing us to obtain standard estimates of p values for the F ratios in the most parsimonious model (function ANOVA). A non-parametric test (Mann–Whitney t test) was used to compare the sig- nificant difference between initial and final concentrations of eCA. The difference was considered significant when p ≤ 0.05.
Results
Hydrographic and meteorological parameters The average salinity of the three SML sample sites were 34.48 ± 0.06 PSU, 28.22 ± 0.15 PSU and 8.70 ± 0.20 PSU, open ocean, outer fjord and middle fjord, respectively (Sup- plementary Table 2). Measured light intensities in the SML ranged between 179 and 966 µmol photons m–2 s–1 (depend- ing on site and weather conditions) and decreased by 50%
from the SML to ULW. The lower salinity and high turbid- ity in middle fjord station indicated large freshwater inputs.
Samples from both layers, SML and ULW, from the open ocean and middle fjord stations were collected during low- to-moderate wind regimes, with average wind speeds of 3.4 ± 0.8 m s–1 and 3.6 ± 1.1 m s–1, respectively. Samples from outer fjord station were collected during a slightly higher wind regime with an average of 5.8 ± 0.7 m s–1. Samples from all stations and depths were collected in the morning with clear skies and an average ambient PAR of 898 µmol photons m−2 s−1, 517 µmol photons m−2 s−1 and 408 µmol photons m−2 s−1 in the open ocean, outer and mid- dle section of the fjord, respectively.
Phytoplankton community composition
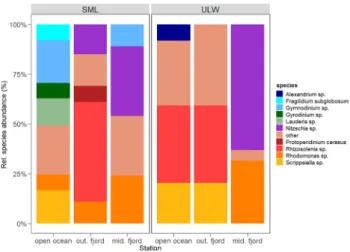
The initial phytoplankton communities varied between sta- tions and depths (Fig. 1). The SML community in the open
ocean was more diverse compared with other stations and was dominated by dinoflagellates (e.g., Gymnodinium sp.), whereas centric diatoms such as Rhizosolenia sp. dominated the ULW. In the outer fjord station, both the SML and ULW were dominated by Rhizosolenia sp. followed by a pennate diatom (Nitzschia sp.) which dominated both the SML and ULW communities in the middle fjord, respectively.
Phytoplankton growth rate and biomass
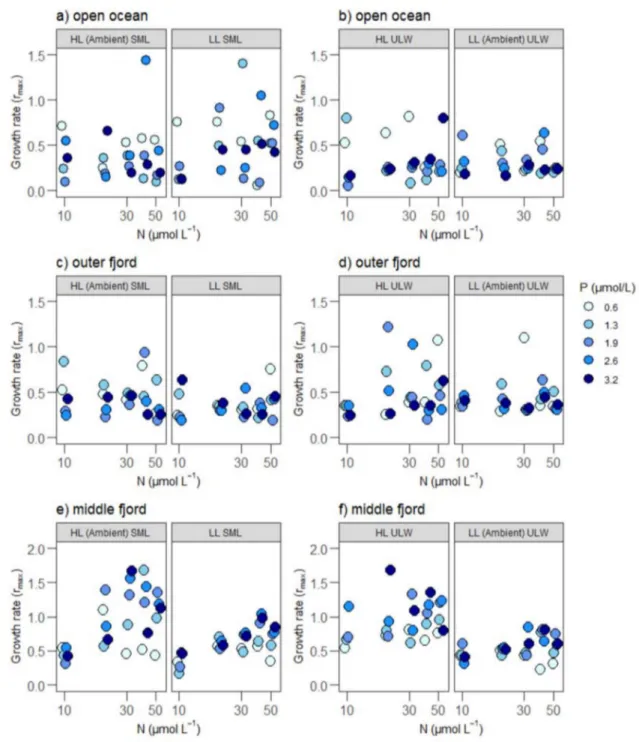
Phytoplankton growth rates increased with increasing N concentrations and light supply (Fig. 2, Table 2). The effects of N and light were independent, as reflected by significant main effects of both resources with no significant interac- tion (LME; Tables 2, 3). P supply did not significantly affect phytoplankton growth, either alone or in interaction with the other resources. Considering each station separately (Sup- plementary Table 3), light had a strong positive effect on phytoplankton growth rates in the middle fjord and a posi- tive effect in the outer fjord station. However, no significant effect of light on growth rate was observed in the open ocean station. In the middle fjord, N additions had a positive effect on growth rates while P additions (interacting with light and depth) had slightly negative effects on the growth rates (Supplementary Table 3). In the open ocean station com- munities, depth had a negative effect on growth resulting in less growth in communities from SML compared to ULW (Supplementary Table 3).
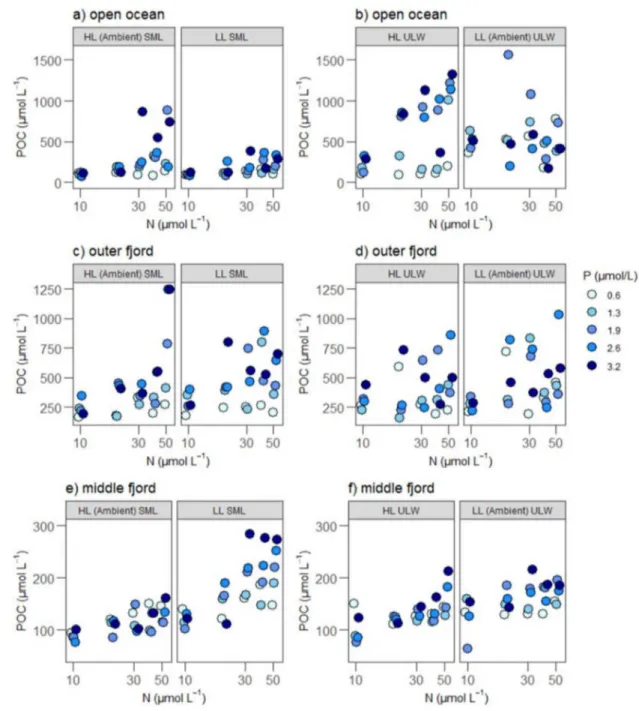
In contrast to growth rates, the biomass yield of phy- toplankton (i.e., POC) differed with depth and light sup- ply (significant main effects of depth and light on POC, Tables 2, 3) and showed interactive responses to resource supply (Fig. 3, Tables 2, 3). Thus, communities from ULW
Fig. 1 Initial relative species abundance in percent (%) in the sea sur- face microlayer (SML) and underlying water (ULW) at open ocean, outer fjord and middle fjord stations. Species with relative abun- dance < 7% were grouped as other
showed higher biomass than communities from SML, and light had a negative effect which means communities exposed to low light intensity showed higher biomass. A significant positive interactive effect of N and P existed for the whole dataset reflecting that the highest final biomass occurred when both nutrients were supplied (Table 3).
Comparing stations, significant N and P effects on bio- mass yield were obtained for all stations (Supplementary Table 4). The interactive effect of N × P on biomass yield was also significant (positive effect) in the outer and mid- dle fjord stations (Supplementary Table 4).
Fig. 2 The phytoplankton growth rates (rmax) in different depths, nutrient and light treatments. Left panels represent growth rates in the SML from the a open ocean, c outer fjord and e middle fjord stations under HL ambient SML and LL SML treatments, respectively. Right panels represent growth rates in the ULW from the b open ocean,
d outer fjord and f middle fjord stations under LL ambient ULW and HL ULW treatments, respectively. Phosphorus concentrations (µmol L–1) are indicated by color; the darkest color indicates highest P level
Phytoplankton stoichiometry
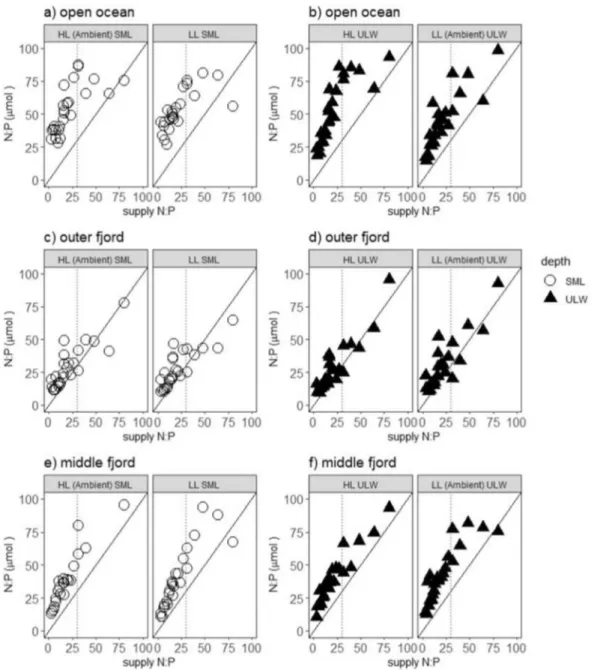
We observed a significant correlation between cellular N:P ratios and the N:P ratios of the supplied nutrients across all incubation samples (Spearman, r = 0.87 p < 0.001), although internal N:P tended to be consistently higher than supply N:P (Fig. 4). The relationship was not fully linear, though, as cellular N:P levelled off above a molar sup- ply ratio of N:P = 30 for the open ocean station (Fig. 4a).
Higher internal N:P than supply N:P ratios was observed in the open ocean (Fig. 4a) and middle fjord stations (Fig. 4c). N addition significantly increased and P addi- tion significantly decreased cellular N:P ratios among and within all stations (Tables 2, 3) (Supplementry Table 5).
Extracellular carbonic anhydrase
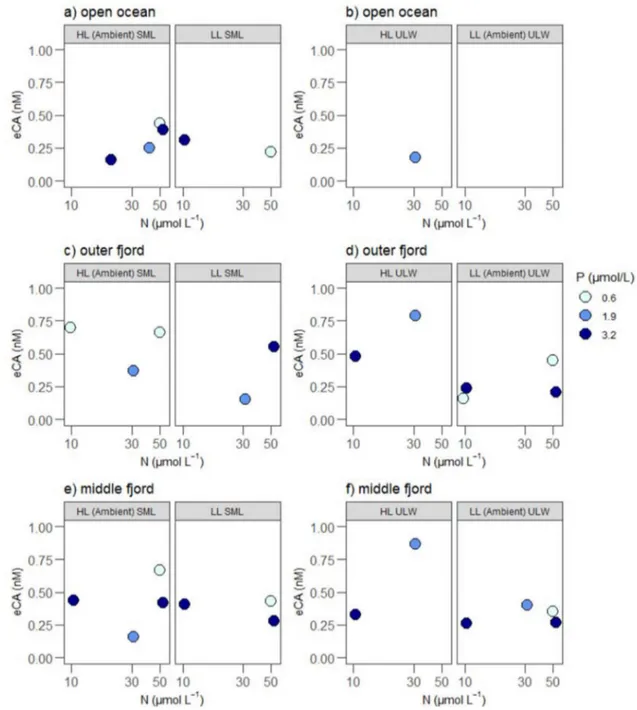
eCA showed significant positive effects with depth and light × P × depth for all stations (Fig. 5, Tables 2, 3). For a single station analysis, light × P and light × depth nega- tively affected eCA concentrations in the open ocean station (Supplementary Table 6), but both interactions positively affected eCA concentrations in the outer fjord station. The initial eCA concentration ranged between 0.22 ± 0.07 nM and 0.42 ± 0.04 nM in the SML and between 0.18 ± 0.07 nM and 0.26 ± 0.04 nM in the ULW (Supplementary Table 1).
At the open ocean station, the average eCA concentration in the SML was lower (0.30 ± 0.11 nM) compared to the initial concentration but the difference was not significant
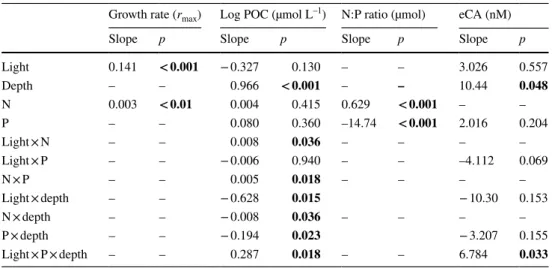
Table 2 ANOVA results of the linear mixed effect (LME) models after stepwise backward reduction in effects, describing the effect of light, depth, phosphorus (P) and nitrogen (N) additions (if remained in the model)
The table gives F values for each test and denotes the p values. Significant effects are highlighted in bold.
For growth rate and N:P ratio: Numerator df (NumDF) for all factors remaining in the model = 1, Denu- merator df (DenDF) = 294; POC NumDF = 1, DenDF = 286; eCA NumDF = 1, DenDF = 46
Growth rate (rmax) Log POC (µmol L–1) N:P ratio (µmol) eCA (nM)
F p F p F p F p
Light 19.5 < 0.001 13.76 < 0.001 – – 0.360 0.551
Depth – – 20.22 < 0.001 – – 4.118 0.048
N 6.8 < 0.01 0.002 0.966 429.87 < 0.001 – –
P – – 0.05 0.823 200.20 < 0.001 0.139 0.711
Light × N – – 4.430 0.036 – – – –
Light × P – – 5.211 0.023 – – 0.217 0.644
N × P – – 5.710 0.018 – – – –
Light × depth – – 6.039 0.014 2.115 0.153
N × depth – – 4.437 0.036 – – – –
P × depth – – 5.225 0.023 2.096 0.155
Light × P × depth – – 5.706 0.018 – – 4.818 0.033
Table 3 Summary of the linear mixed effect (LME) models, describing the effect of light (low vs high), depth (SML vs ULW), phosphorus (low to high concentrations) and nitrogen (low to high concentrations) additions
The table gives slopes and denotes p values. Significant effects are highlighted in bold
Growth rate (rmax) Log POC (µmol L–1) N:P ratio (µmol) eCA (nM)
Slope p Slope p Slope p Slope p
Light 0.141 < 0.001 − 0.327 0.130 – – 3.026 0.557
Depth – – 0.966 < 0.001 – – 10.44 0.048
N 0.003 < 0.01 0.004 0.415 0.629 < 0.001 – –
P – – 0.080 0.360 –14.74 < 0.001 2.016 0.204
Light × N – – 0.008 0.036 – – – –
Light × P – – − 0.006 0.940 – – –4.112 0.069
N × P – – 0.005 0.018 – – – –
Light × depth – – − 0.628 0.015 − 10.30 0.153
N × depth – – − 0.008 0.036 – – – –
P × depth – – − 0.194 0.023 − 3.207 0.155
Light × P × depth – – 0.287 0.018 – – 6.784 0.033
(Mann–Whitney t test, p = 0.110). The eCA in ULW was only detectable at the HL ULW condition (0.18 nM, n = 1), while the eCA was below detection limits (0.09 nM) in
“LL ambient ULW” samples. The eCA concentrations in the outer fjord stations, both in the SML and ULW, were not affected by light and nutrient treatments. The middle fjord station exhibited an average eCA concentration of 0.40 ± 0.16 nM in the SML and 0.41 ± 0.23 nM in the ULW.
Discussion
Effect of light conditions on phytoplankton communities: growth, biomass and eCA (H1)
We expected the communities to be well adapted to the light intensities at their original depths. In our study, light intensity (in general) positively affected the growth rate
Fig. 3 POC concentration (µmol L–1) in different depths, nutrient and light treatments. Left panels represent POC concentration in the SML from the a open ocean, c outer fjord and e middle fjord stations under HL ambient SML and LL SML treatments, respectively. Right pan- els represent POC concentration in the ULW from the b open ocean,
d outer fjord and f middle fjord stations under LL ambient ULW and HL ULW treatments, respectively. Phosphorus concentrations (µmol L–1) are indicated by color; the darkest color indicates highest P level
of phytoplankton (middle and outer fjord station) and the strength of the light effect increased along the gradient from the open ocean to the middle fjord (Fig. 2). However, we did not find a significant interactive effect between depth and light on phytoplankton growth rates. The dif- ferences seen in abiotic and biotic parameters between stations, such as nutrient conditions, salinity, temperature and turbidity, might explain the differences in response to light conditions. Thus, the communities in the middle fjord and outer fjord stations might have experienced light
limitation and the communities were not adapted to the light intensities of their origin (partially rejecting H1).
Although high nutrient loads transported from freshwater inputs have been shown to enhance phytoplankton growth rates in coastal systems (Deininger et al. 2016), there is also a reduction in light availability in the water column related to these coastal inputs (Aksnes et al. 2009; Meire et al. 2016) that might lead to light limitation. Our H1 suggests the adaptation of the SML and ULW communi- ties toward light of their origin depths which could not be
Fig. 4 The cellular N:P ratio (µmol) in all incubation samples with respect to supplied N:P ratio (µmol). Left panels represent N:P ratio in the SML from the a open ocean, c outer fjord and e middle fjord stations under HL ambient SML and LL SML treatments, respec-
tively. Right panels represent N:P ratio in the ULW from the b open ocean, d outer fjord and f middle fjord stations under LL ambient ULW and HL ULW treatment, respectively. Black solid line repre- sents the 1:1 ratio and black dotted line represents supplied N:P = 30
observed for the growth rates of the investigated communi- ties in our experiment.
Communities originating from “low light” conditions (ULW) achieved higher concentrations in biomass than communities from SML, and biomass yield in all commu- nities was generally higher while exposed to “low light”
(“LL ambient ULW”) conditions. This occurred especially in the middle fjord, where the communities experienced
higher turbidity under natural conditions. Previous studies have shown that phytoplankton biomass increases with light availability (Striebel et al. 2008; Taylor et al. 2013). How- ever, ambient light conditions in the SML can be stressful for certain phytoplankton communities, which could lead to lower final biomass. For example, one study reported that the primary production in the SML was often inhibited by photo-degradation (Williams et al. 1986). Certainly the SML
Fig. 5 eCA concentrations (nM) in selected nutrient treatments (i.e., P1, P3, P5) in different depths, nutrient and light treatments. Left panels represent eCA concentration in the SML from the a open ocean, c outer fjord and e middle fjord stations under HL ambient SML and LL SML treatments, respectively. Right panels represent
eCA concentration in the ULW from the b open ocean, d outer fjord and f middle fjord stations under LL ambient ULW and HL ULW treatments, respectively. Phosphorus concentrations (µmol L–1) are indicated by color; the darkest color indicates highest P level
is an extreme environment which is exposed to high UV radiation and temperature fluctuation (Maki 2003).
It should also be considered that sensitivity of phyto- plankton toward light can depend on taxonomic composi- tion (Dickman et al. 2006). For instance, Jäger et al. (2008) observed that the phytoplankton biomass of high light com- munities was dominated by motile taxa, and the biomass of low light communities was dominated by pennate diatoms.
As no significant interactive effect between light and depth was observed in the open ocean and outer fjord stations, we suggest that species composition dominated in the ULW at both stations (i.e., centric diatom Rhizosolenia sp.) are well adapted to the high light condition. In a previous study, Rhizosolenia sp. has also been found in the SML (Williams et al. 1986), revealing that this species is able to adapt to the extreme conditions of the SML (i.e., high light level).
Stoichiometrically, we did not observe a significant effect of light or depth on cellular N:P ratio, although it is likely light could influence the N:P requirement of species resid- ing at different depths (Jäger et al. 2008). The sensitivity of phytoplankton responses to light is dependent on the adap- tations of the species compositions (Huovinen et al. 1999).
For instance, in our study, the SML layer in the open ocean site was dominated by dinoflagellates (Gymnodinium sp.).
Dinoflagellate species (e.g., Glenodium sp.) are able to adapt and grow under low light level by increasing their content of Peridinin–Chlorophyll α-Proteins in order to maintain their cellular photosynthetic capacity (Prézelin 1976). Therefore, we suggest that in our study, species accumulating in the open ocean SML could have originated from deeper lay- ers and then transported into the SML. This could explain the adaption for lower light conditions. Methods of trans- port, including positive buoyancy and bubble entrainment, allow the phytoplankton community from deeper layers to transport into the organic matter-enriched SML (Joux et al.
2006), whereby the organic matter and gel particles serve as the basis of the food web (Obernosterer et al. 2005). Overall, we observed short-term effects of light and nutrient changes on growth rates and biomass in our study. Given this out- come, long-term effects of light and nutrient changes are expected to change the phytoplankton community composi- tion and thus need further investigation.
eCA expression was not affected by light intensity and thus adaption of the expression to the origin depth could not be found, leading to a rejection of H1. The expression of eCA generally depends on light, pH and nutrient condi- tions as well as the growth stage of the community (Rein- felder 2011). However, our results are in agreement with an earlier study by Rigobello-Masini et al. (2003) show- ing that the effect of light on eCA expression depended on depth (light × depth) and geographical locations. Such inter- active effects were observed in our study at both the open ocean and middle fjord stations. The eCA concentrations in
our study were in the range of eCA levels (0.12–0.76 nM) detected in the Indo-west Pacific Ocean (Mustaffa et al.
2017a) and in the Baltic Sea (0.10–0.67 nM) (Mustaffa et al.
2017b). Different functional groups have a large differences in both efficiency and regulation of inorganic carbon acqui- sition (Rost et al. 2003; Reinfelder 2011) and thus have an effect on eCA expression. So, likewise, taxonomic composi- tion and cell size of a phytoplankton community can have an effect on eCA (Martin and Tortell 2006, 2008). For instance, various species of dinoflagellates and diatoms express eCA (Reinfelder 2011; Mustaffa et al. 2017b). The open ocean was typically dominated by dinoflagellates (Gymnodinium sp. and Scrippsiella sp.) and centric diatom species such as Lauderia sp. and Rhizosolenia sp. and are reported to express eCA (Nimer et al. 1997). However, we observed low eCA concentrations in samples collected from the open ocean. This could be an artefact of the prolonged incubation time which has a potential to degrade eCA (Chen and Kerno- han 1967). Or it could be that there was a lower expression due to nutrient deficiency. The SML and ULW from the outer fjord station were both dominated by centric diatom species Rhizosolenia sp., but no clear nutrient limitation was observed. On the other hand, it is interesting that in the middle fjord station the eCA concentration in the SML increased two-fold after incubation. Increased eCA con- centrations are associated with low carbon dioxide (CO2) concentrations and high primary productivity (Tsuzuki and Miyachi 1989). Even though inorganic carbon limitation is rare, it can potentially occur during development of isolated phytoplankton blooms as a result of intensive nutrients (N or P) loading from freshwater inputs (Solomonson and Spehar 1977). Therefore, CO2 limitation in the middle fjord sample is possible, and it is possible that Nitzschia sp. responded to this limitation by regulating the eCA.
Nutrient limitation in the SML and ULW (H2)
The overall results of this experiment revealed that phyto- plankton growth rates in both SML and ULW were N-lim- ited, and no co-limitation with P occurred. Interactive effects of N supply and light conditions indicate co-limitation of light and N. Nitrogen limitations of phytoplankton com- munities were reported from other studies investigating the oligotrophic water of the North Atlantic ocean (Graziano et al. 1996; Moore et al. 2008) and in marine systems in general (Elser et al. 2007). However, focusing on the single sites, light, N and P effects on growth rates could be found for the middle fjord station while an interactive N × P effect occurred in the open ocean communities. The proximity of the middle fjord station to freshwater inputs and glacial melt water sources could have enhanced stratification which in turn might have prevented N supply from reaching deeper waters (Meire et al. 2017).
Final biomass in the SML and ULW increased with respect to both, N and P concentrations (supporting H2), indicating a co-limitation of N and P especially in the outer fjord as well as the middle fjord station. Previous studies have also shown a significant effect of nutrients on final biomass in an oligotrophic community from the western Mediterranean (Mercado et al. 2014; Neale et al. 2014). The cellular N:P ratios were positively correlated to the supplied N:P ratios (supporting H2), as predicted for limiting condi- tions (Sterner and Elser 2002). This is consistent with other studies where a positive and significant response to supplied N:P ratios were observed in lakes and mesocosms experi- ments (Hall et al. 2005), meta-analysis (Hillebrand et al.
2013) and field experiments (Guildford and Hecky 2000), suggesting that phytoplankton adjust their internal concen- trations to the external supply. In our study, the cellular N:P ratios were higher than the supply ratios, particularly in the middle fjord and open ocean stations. We suggest that the phytoplankton cells used relatively more N than P of the supplied nutrients, again indicating N limitations. Overall, N addition significantly enhanced growth rate of the phyto- plankton community in both the SML and ULW (rate limita- tion), but the combination of N and P affected the biomass production (yield limitation) in these upper surface layers.
Light and nutrient interaction dependent on geographical location (H3)
In general, light and N addition affected the growth rate of phytoplankton while no clear effect of P addition on growth rates could be observed. However, considering each station separately, differences in the responses between stations to light, nutrient and depth effect occurred. The middle fjord station (high turbidity station) was associated with faster growth compared to communities sampled from the other stations (supporting H3). One reason could be the proxim- ity of the station to the land, and thus, the community was exposed to a higher nutrient and particle input from the land than other stations. Therefore, it might be that phytoplankton in the middle fjord could be better adapted to fast changing conditions allowing for faster reaction time when presented with increased nutrients. Deininger et al. (2016) observed that a large nutrient supply via terrestrial runoff enhanced growth rate of diatom species but led to low nutritional quality. The result of high diatom dominance due to inflow of inorganic supply from terrestrial runoff is supported by recent observations by Paczkowska et al. (2020). Moreo- ver, faster growing species in the middle fjord might result from different phytoplankton communities with different size compositions including Nitzschia sp.. It is known that diatom species react rapidly to nutrient or silica addition (Reynolds 1997) and grow faster compared to dinoflagellates
species (i.e., Prorocentrum minimum) (Burford and Pearson 1998).
While communities from all stations showed significant effects on biomass yield with N and P additions and nega- tive effects of light (higher biomass yield under low light conditions), biomass concentrations were highest in the open ocean communities and lowest in the middle fjord communi- ties. Thus, biomass yield showed opposite results than the site-specific growth rate responses. Thus, phytoplankton communities in the middle fjord may have luxury consump- tion and storage of nutrients within the biomass under light limitation. This is especially the case for P as it can be stored as an osmotically neutral polyphosphate, whereas N is only osmotically relevant as nitrate or amino acid (Rhee 1973;
Sterner and Elser 2002). Overall, our results reveal that the phytoplankton communities varied according to the geo- graphical locations and depths mainly due to nutrient and light availability.
Insights on the coastal ocean darkening effect An increase in terrestrial runoff and resultant decrease in light availability in water column is known as “coastal dark- ening” (Aksnes et al. 2009; Capuzzo et al. 2015). Our study provided evidence that phytoplankton communities in the upper surface layer and those living in a habitat close to the land are affected by light as well as nutrient changes.
A further shift in precipitation (Monteith et al. 2007) and atmospheric circulation (England et al. 2014), as well as intensified terrestrial runoff, is predicted, causing increased browning of the water column and increased supplies of nutrients to the SML. Changes in the light climate and nutri- ents supply in the SML will therefore likely lead to changes in biogeochemical response in the SML and the upper ocean (Wurl et al. 2017). This is because the SML communities appear to be more responsive to the environmental changes.
For instance, the high nutrient loads from land run off has been observed to change the density and composition of phytoplankton in the SML (i.e., phytoneuston) (Wang et al.
2014). Meanwhile, increasing temperature (Schmidtko et al.
2017) combined with likely increasing nutrient input from both the land (via terrestrial runoff) and atmospheric (wet and dry deposition) has the potential to alter the community composition within the different size fractions of the neus- ton. Because the SML has an abundance of zooplankton (Rahlff et al. 2018), numerous invertebrate larvae depend on the availability of microalgae in the SML. Therefore, the response of SML communities to light and nutrient changes will have an impact on higher trophic levels and have con- sequences for the aquatic food web. Despite the importance of the SML in the biogeochemical process of the ocean, the processes within the phytoplankton community in the SML, interspecies relationships and responses to variability in the
physicochemical conditions of the SML, the SML is still poorly understood (Wurl et al. 2017). Indeed, further work is needed to fill the gaps in understanding the effect of light and nutrient changes on the upper surface phytoplankton communities, in particular, the community close to the land (i.e., coastal and fjord systems).
Conclusion
With this study, we conclude that the response (growth rate and biomass yield) to light and nutrients by the phytoplank- ton communities is strongly dependent on geographical locations characterized by different hydrographic conditions (e.g., turbidity and salinity). Differences in hydrographic conditions can lead to an increased strength of the light effect along the station gradient from the open ocean to the middle fjord. Furthermore, we provide insight that changes in light and nutrient conditions not only influenced the com- munities in the underlying water column but significantly affected the communities at the air–sea interfaces and thus affected the upper sea surface phytoplankton communities.
The upper surface layer (i.e., SML and ULW) should be con- sidered when addressing coastal and oceanic CO2 uptake and its fate under changing climate conditions, particularly in terms of reduced light by increasing runoff known as coastal ocean darkening.
Acknowledgements Open Access funding provided by Projekt DEAL. All authors thank the captain, crew and all scientist onboard R/V Heincke for their great contribution during cruise HE491. Thanks to Heike Rickels, Alexandra Schlenker and Anna Lena Heinrichs for excellent work in laboratory analyses. We thank Miriam Gerhard for help with R scripts, statistical assistance and useful comments to improve our manuscript. Thanks to Marcia Kyle and two anony- mous reviewers for valuable comments which highly improved this manuscript.
Funding M.S. and N.I.H.M. acknowledge the Ministry of Science and Culture of Lower Saxony, Germany (MWK) for funding the COD project (Coastal Ocean Darkening—Light availability in the past and future marine environment) (Grant number VWZN3175). O.W.
acknowledges the European Research Council (ERC) for funding PassMe project (Grant number GA336408).
Data availability The datasets generated during and/or analyzed dur- ing the current study are available from the corresponding author on reasonable request.
Compliance with ethical standards
Conflict of interest The authors declare there is no conflict of interest.
Open Access This article is licensed under a Creative Commons Attri- bution 4.0 International License, which permits use, sharing, adapta- tion, distribution and reproduction in any medium or format, as long as you give appropriate credit to the original author(s) and the source,
provide a link to the Creative Commons licence, and indicate if changes were made. The images or other third party material in this article are included in the article’s Creative Commons licence, unless indicated otherwise in a credit line to the material. If material is not included in the article’s Creative Commons licence and your intended use is not permitted by statutory regulation or exceeds the permitted use, you will need to obtain permission directly from the copyright holder. To view a copy of this licence, visit http://creat iveco mmons .org/licen ses/by/4.0/.
References
Aizawa K, Miyachi S (1986) Carbonic anhydrase and CO2 concen- trating mechanisms in microalgae and cyanobacteria. FEMS Microbiol Lett 39:215–233. https ://doi.org/10.1016/0378- 1097(86)90447 -7
Aksnes DL, Dupont N, Staby A, Fiksen Ø, Kaartvedt S, Aure J (2009) Coastal water darkening and implications for mesopelagic regime shifts in Norwegian fjords. Mar Ecol Prog Ser 387:39–49 Bates D, Mächler M, Bolker B, Walker S (2014) Fitting linear mixed-
effects models using lme4. arXiv preprint arXiv:14065823 Berger SA, Diehl S, Kunz TJ, Albrecht D, Oucible AM, Ritzer S (2006)
Light supply, plankton biomass, and seston stoichiometry in a gradient of lake mixing depths. Limnol Oceanogr 51:1898–1905.
https ://doi.org/10.4319/lo.2006.51.4.1898
Burford MA, Pearson DC (1998) Effect of different nitrogen sources on phytoplankton composition in aquaculture ponds. Aquat Microb Ecol 15:277–284
Capuzzo E, Stephens D, Silva T, Barry J, Forster RM (2015) Decrease in water clarity of the southern and central North Sea during the 20th century. Glob Change Biol 21:2206–2214
Chen RF, Kernohan JC (1967) Combination of bovine carbonic anhy- drase with a fluorescent sulfonamide. J Biol Chem 242:5813–5823 Core Team R (2019) R: a language and environmental statistical com- puting. R Foundation for Statistical Computing, Vienna, Austria Cullen JJ, MacIntyre HL, Carlson DJ (1989) Distributions and pho- tosynthesis of phototrophs in sea-surface films. Mar Ecol Prog Ser 55:271–278
Cunliffe M, Whiteley AS, Newbold L, Oliver A, Schäfer H, Murrell JC (2009) Comparison of bacterioneuston and bacterioplankton dynamics during a phytoplankton bloom in a fjord mesocosm.
Appl Environ Microbiol 75:7173–7181. https ://doi.org/10.1128/
AEM.01374 -09
Cunliffe M, Upstill-Goddard RC, Murrell JC (2011) Microbiology of aquatic surface microlayers. FEMS Microbiol Rev 35:233–246.
https ://doi.org/10.1111/j.1574-6976.2010.00246 .x
Deininger A, Faithfull CL, Lange K, Bayer T, Vidussi F, Liess A (2016) Simulated terrestrial runoff triggered a phytoplankton succession and changed seston stoichiometry in coastal lagoon mesocosms.
Mar Environ Res 119:40–50. https ://doi.org/10.1016/j.maren vres.2016.05.001
Dickman EM, Vanni MJ, Horgan MJ (2006) Interactive effects of light and nutrients on phytoplankton stoichiometry. Oecologia 149:676–689
Dupont N, Aksnes DL (2013) Centennial changes in water clarity of the Baltic Sea and the North Sea. Estuar Coast Shelf Sci 131:282–
289. https ://doi.org/10.1016/j.ecss.2013.08.010
Elser JJ, Bracken MES, Cleland EE, Gruner DS, Harpole WS, Hille- brand H, Ngai JT, Seabloom EW, Shurin JB, Smith JE (2007) Global analysis of nitrogen and phosphorus limitation of primary producers in freshwater, marine and terrestrial ecosystems. Ecol 10:1135–1142. https ://doi.org/10.1111/j.1461-0248.2007.01113 .x England MH, McGregor S, Spence P, Meehl GA, Timmermann A, Cai W, Gupta AS, McPhaden MJ, Purich A, Santoso A (2014) Recent
intensification of wind-driven circulation in the Pacific and the ongoing warming hiatus. Nat Clim Change 4:222–227
Fleischmann EM (1989) The measurement and penetration of ultra- violet radiation into tropical marine water. Limnol Oceanogr 34:1623–1629
Frank F, Danger M, Hillebrand H, Striebel M (2020) Stoichiometric constraints on phytoplankton resource use efficiency in mono- cultures and mixtures. Limnol Oceanogr. https ://doi.org/10.1002/
lno.11415
Galgani L, Engel A (2016) Changes in optical characteristics of surface microlayers hint to photochemically and microbially mediated DOM turnover in the upwelling region off the coast of Peru. Biogeosciences 13:2453–2473. https ://doi.org/10.5194/
bg-13-2453-2016
Gernez P, Stramski D, Darecki M (2011) Vertical changes in the prob- ability distribution of downward irradiance within the near-surface ocean under sunny conditions. J Geophys Res Oceans. https ://doi.
org/10.1029/2011J C0071 56
Goering JJ, Wallen D (1967) The vertical distribution of phosphate and nitrite in the upper one-half meter of the southeast Pacific Ocean. Deep-Sea Res Oceanogr Abstr 14:29–33. https ://doi.
org/10.1016/0011-7471(67)90026 -5
Grasshoff K, Kremling K, Ehrhardt M (1999) Methods of seawater analysis. Wiley, New York
Graziano L, Geider R, Li W, Olaizola M (1996) Nitrogen limitation of North Atlantic phytoplankton: analysis of physiological condition in nutrient enrichment experiments. Aquat Microb Ecol 11:53–64 Gruner DS, Bracken MES, Berger SA, Eriksson BK, Gamfeldt L, Mat- thiessen B, Moorthi S, Sommer U, Hillebrand H (2017) Effects of experimental warming on biodiversity depend on ecosystem type and local species composition. Oikos 126:8–17. https ://doi.
org/10.1111/oik.03688
Guildford SJ, Hecky RE (2000) Total nitrogen, total phosphorus, and nutrient limitation in lakes and oceans: Is there a common rela- tionship? Limnol Oceanogr 45:1213–1223
Hall SR, Smith VH, Lytle DA, Leibold MA (2005) Constraints on primary producer N:P stoichiometry along N:P supply ratio gra- dients. Ecology 86:1894–1904
Hardy JT (1982) The sea surface microlayer: biology, chemistry and anthropogenic enrichment. Prog Oceanogr 11:307–328. https ://
doi.org/10.1016/0079-6611(82)90001 -5
Hardy JT, Apts CW (1984) The sea-surface microlayer: phytoneuston productivity and effects of atmospheric particulate matter. Marine Biol 82:293–300. https ://doi.org/10.1007/BF003 92409
Hillebrand H, Dürselen C-D, Kirschtel D, Pollingher U, Zohary T (1999) Biovolume calculation for pelagic and benthic microalgae. J Phycol 35:403–424. https ://doi.org/10.104 6/j.1529-8817.1999.35204 03.x
Hillebrand H, Steinert G, Boersma M, Malzahn A, Meunier CL, Plum C, Ptacnik R (2013) Goldman revisited: faster-growing phytoplankton has lower N:P and lower stoichiometric flexibil- ity. Limnol Oceanogr 58:2076–2088. https ://doi.org/10.4319/
lo.2013.58.6.2076
Huovinen PS, Brett MT, Goldman CR (1999) Temporal and vertical dynamics of phytoplankton net growth in Castle Lake, California.
J Plankton Res 21:373–385
Jäger CG, Diehl S, Schmidt GM (2008) Influence of water-column depth and mixing on phytoplankton biomass, community compo- sition, and nutrients. Limnol Oceanogr 53:2361–2373
Joux F, Agogué H, Obernosterer I, Christine D, Reinthaler T, Herndl GJ, Lebaron P (2006) Microbial community structure in the sea surface microlayer at two contrasting coastal sites in the north- western Mediterranean Sea. Aquat Microb Ecol 42:91–104. https ://doi.org/10.3354/ame04 2091
Klausmeier CA, Litchman E, Daufresne T, Levin SA (2004) Optimal nitrogen-to-phosphorus stoichiometry of phytoplankton. Nature 429:171
Liss PS, Duce RA (2005) The sea surface and global change. Cam- bridge University Press, New York
Maki JS (2003) Neuston microbiology: life at the air–water interface.
In: Bitton G (ed) Encyclopedia of environmental microbiology.
Academic Press, New York
Martin CL, Tortell PD (2006) Bicarbonate transport and extracellular carbonic anhydrase activity in Bering Sea phytoplankton assem- blages: results from isotope disequilibrium experiments. Limnol Oceanogr 51:2111–2121
Martin CL, Tortell PD (2008) Bicarbonate transport and extracellular carbonic anhydrase in marine diatoms. Physiol Plant 133:106–
116. https ://doi.org/10.1111/j.1399-3054.2008.01054 .x Martiny A, Vrugt JA, Primeau FW, Lomas MW (2013) Regional vari-
ation in the particulate organic carbon to nitrogen ratio in the surface ocean. Global Biochem Cy 27:723–731
Mascarenhas VJ, Voß D, Wollschlaeger J, Zielinski O (2017) Fjord light regime: bio-optical variability, absorption budget, and hyperspectral light availability in Sognefjord and Trondheimsf- jord, Norway. J Geophys Res Oceans 122:3828–3847. https ://doi.
org/10.1002/2016J C0126 10
Meire L, Meire P, Struyf E, Krawczyk DW, Arendt KE, Yde JC, Juul Pedersen T, Hopwood MJ, Rysgaard S, Meysman FJR (2016) High export of dissolved silica from the Greenland Ice Sheet.
Geophys Res Lett 43:9173–9182. https ://doi.org/10.1002/2016g l0701 91
Meire L, Mortensen J, Meire P, Juul-Pedersen T, Sejr MK, Rysgaard S, Nygaard R, Huybrechts P, Meysman FJR (2017) Marine-termi- nating glaciers sustain high productivity in Greenland fjords. Glob Change Biol 23:5344–5357. https ://doi.org/10.1111/gcb.13801 Mercado J, Sobrino C, Neale PJ, Segovia M, Reul A, Amorim A, Car-
rillo P, Claquin P, Cabrerizo M, León P (2014) Effect of CO2, nutrients and light on coastal plankton. II. Metabolic rates. Aquat Biol 22:43–57
Monteith DT, Stoddard JL, Evans CD, De Wit HA, Forsius M, Høgåsen T, Wilander A, Skjelkvåle BL, Jeffries DS, Vuorenmaa J (2007) Dissolved organic carbon trends resulting from changes in atmos- pheric deposition chemistry. Nature 450:537
Moore CM, Mills MM, Langlois R, Milne A, Achterberg EP, La Roche J, Geider RJ (2008) Relative influence of nitrogen and phospho- rous availability on phytoplankton physiology and productivity in the oligotrophic sub-tropical North Atlantic Ocean. Limnol Oceanogr 53:291–305. https ://doi.org/10.4319/lo.2008.53.1.0291 Mustaffa NIH, Striebel M, Wurl O (2017a) Enrichment of extracel- lular carbonic anhydrase in the sea surface microlayer and its effect on air-sea CO2 exchange. Geophys Res Lett. https ://doi.
org/10.1002/2017G L0757 97
Mustaffa NIH, Striebel M, Wurl O (2017b) Extracellular carbonic anhydrase: method development and its application to natural seawater. Limnol Oceanogr Methods 15:503–517. https ://doi.
org/10.1002/lom3.10182
Neale PJ, Sobrino C, Segovia M, Mercado J, Leon P, Cortés M, Tuite P, Picazo A, Salles S, Cabrerizo M (2014) Effect of CO2, nutrients and light on coastal plankton. I. Abiotic conditions and biological responses. Aquat Biol 22:25–41
Nimer NA, Iglesias-Rodriguez MD, Merrett MJ (1997) Bicarbonate utilization by marine phytoplankton species. J Phycol 33:625–631.
https ://doi.org/10.1111/j.0022-3646.1997.00625 .x
Obernosterer I, Catala P, Reinthaler T, Herndl GJ, Lebaron P (2005) Enhanced heterotrophic activity in the surface microlayer of the Mediterranean Sea. Aquat Microb Ecol 39:293–302
Paczkowska J, Brugel S, Rowe O, Lefébure R, Brutemark A, Anders- son A (2020) Response of coastal phytoplankton to high inflows