SFB
823 TRUEE TRUEE TRUEE TRUEE ---- unfolding software unfolding software unfolding software unfolding software
D is c u s s io n P a p e r
Natalie Milke
Nr. 28/2010
TRUEE - unfolding software
Natalie Milke
Fakult¨at Physik, TU Dortmund, Otto-Hahn-Straße 4, 44227 Dortmund, Germany DOI:will be assigned
TRUEE (Time-dependent Regularized Unfolding for Economics and Engineerings) is a new unfolding program, written in C++. TRUEE is based on the RUN algorithm [1] and is intended to be an universal tool for the solution of inverse problems in physics as well as in other fields as economics, where inverse problems are not yet sufficiently investigated.
The current status of the software and long-term objectives are described.
1 Introduction
In many applications of physics and other fields, because of the very finite resolution and limited acceptance of the measurement instruments, inverse, ill-posed problems dominate the measurement. To handle these problems appropriate technics are required in form of numerical methods of regularized unfolding. For many years in the astroparticle physics working group in Dortmund the unfolding has been carried out by using the software RUN (Regularized UNfold- ing) [1]. The results of RUN were systematically checked and compared to other algorithms [2].
The software has a couple of advantages:
• Up to three different observables can be used as input for the unfolding.
• The Tikhonov regularization method is used, which assumes a smooth distribution of unfolded function and thus is suitable in many fields where a smooth distribution is expected.
• To parametrize the sought-after functionf(x) cubic B-splines are used, consisting of four polynomials of third degree.
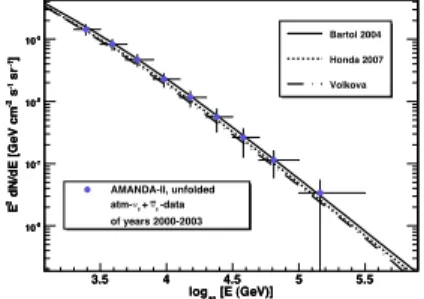
Figure 1: Diffuse neutrino flux vs.
energy measured with AMANDA and unfolded with RUN [3].
The usage of B-splines leads to smooth results, be- cause such functions do not tend to oscillate due to their low degree. Additionally the B-splines are continuously differentiable up to second derivative, which is important for the Tikhonov regularization, where the curvature of f(x) is determined.
In Dortmund RUN has successfully been used in Ice- Cube and its precursor AMANDA to reconstruct neu- trino energy spectra (Fig. 1)([2], [3]) and in MAGIC to determine energy spectra of extragalactic Gamma- rays [4].
Unfolding 2010 1
Unfortunately the programming language FORTRAN 77 has become uncommon and the usage of RUN in combination with modern software, such as ROOT which is based on C++, is rather challenging. Furthermore the implementation of some consistently needed functions into the software was required, for example to ease the users selection of unfolding parameters.
For these reasons the conversion of RUN to a C++-version and its subsequent extension to time-dependency was decided.
2 Conversion of RUN to TRUEE
Figure 2: Comparison between the un- folding results of RUN and TRUEE.
Currently the conversion of RUN to C++ is completed and the new software TRUEE provides results compa- rable to the original FORTRAN software RUN (Fig. 2).
TRUEE is simple to include into modern packages. By using self-explanatory names the software is easily un- derstandable and extendable.
Besides of the possibility to use ROOT-files as input and the simple dealing with graphics due to ROOT, more new features and functions are implemented to make the software more user-friendly. The three main extensions are described below.
2.1 Correlation checking
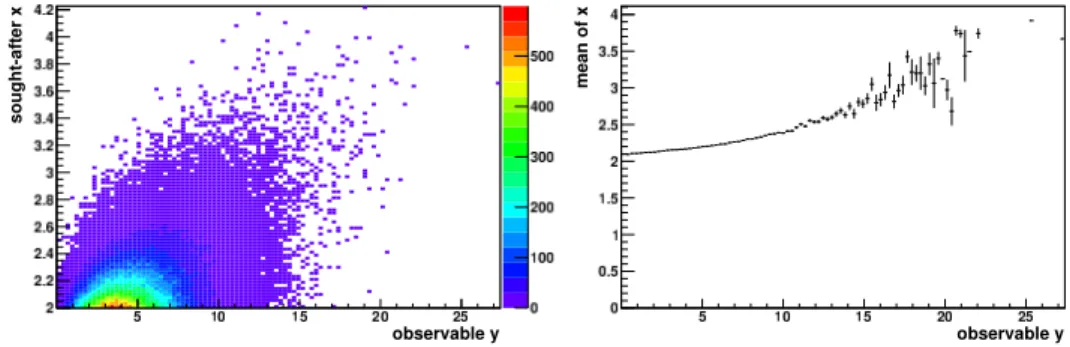
A well-defined correlation between the measured observable and the sought-after variable is crucial for the best possible unfolding result. In TRUEE correlation histograms and the cor- responding profile histograms are created automatically (Fig. 3). After inspecting these his- tograms the user can select the observables with best correlation.
Figure 3: Sought-after variable versus observable to check if a correlation is present. The gradi- ent of the corresponding profile histogram shows more explicitly in which region the correlation is best defined.
2.2 Unfolding with several parameter sets
The unfolding algorithms (TRUEE as well as RUN) require user defined parameters to control the unfolding. The most important parameters are the number of bins of the final histogram, the number of knots of the spline function to reconstruct the sought-after distributionf(x) and the number of degrees of freedom which influences the effect of regularization.
Figure 4: Correlation between data points expressed with a value versus number of knots and number of de- grees of freedom for a certain number of bins. High value stands for less cor- relation of data points.
In RUN the user could define individual values for which the unfolding was executed. Now in TRUEE it is possible to define ranges of parameters and run un- folding for every combination of the parameters within these ranges. A value related to the quality of the un- folding result is filled into the histograms versus the parameter (Fig. 4). A high value means less correlation between the unfolded data points. A low value means high positive correlation between data points and prob- ably a too high regularization and thus a strongly bi- ased result. Regions with parameters leading to good unfolding results can be seen at one sight. The final decision for a parameter set is still made by the user.
2.3 Test mode
Before unfolding of the data sample there is a possibil-
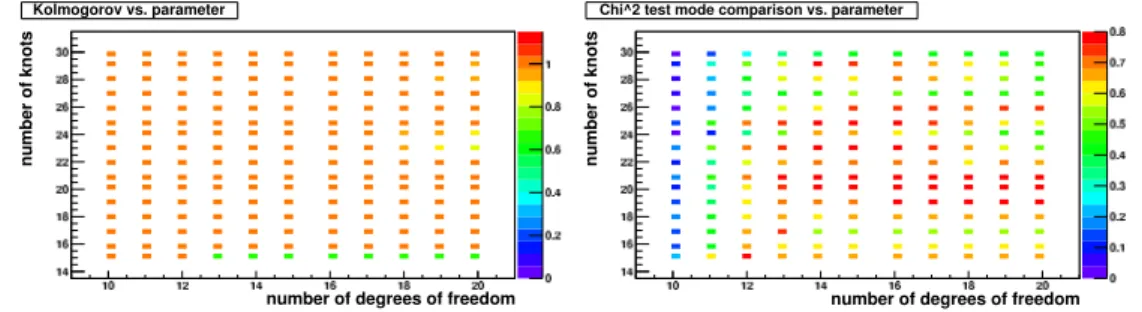
ity to run TRUEE in a test mode and check if the unfolding is working correctly for the current sample and constrict the parameter variety. For this purpose only a Monte Carlo sample is needed, which is actually used to determine the response matrix. The Monte Carlo sample is divided in two parts with equal number of events by default. One half is used to train the matrix and the other half serves as real data and can be unfolded. Since the real distribution in this case is known, a comparison between unfolded and real distribution can be made by plotting them in one histogram. A Kolmogorov test to compare the shapes and a χ2-test is executed and the corresponding values are also plotted into histograms depending on different parameters (Fig. 5). High values indicate a good agreement between unfolded and real dis- tribution and thus the parameter regions with acceptable results can be applied to unfold the actual data.
Figure 5: Kolmogorov test and χ2-test values (expressed as p-values) of unfolded and real distribution in test mode plotted versus parameters for a certain number of bins. High value means good agreement between distributions.
Unfolding 2010 3
3 Outlook
After making TRUEE as user-friendly and automatic as possible the software will be extended to deal with time-dependent inverse problems. The transition from common inverse problems
g(y) =
! d
c
A(y, x)f(x)dx+b(y), (1)
to time-dependent inverse problems
g(y;t) =
! d
c
A(y, x)f(x;t)dx+b(y), (2)
requires assumptions of smoothness or other a-priory properties along the time axis. In the equations g is the measured distribution,f is the sought-after distribution,A is the response function andbis the possible background distribution. First the kernel of the integral equation A is not concerned with the time-dependency, but only the measured and the reconstructed distributions. Due to lack of statistics in lots of cases a simple division of the data sample along the time axis is not possible. Thus non-parametric procedures have to be developed convenient for samples with low statistics.
Currently TRUEE is being tested in Dortmund in astroparticle physics and in Karlsruhe in particle physics (see also the proceeding of T. Peiffer).
Acknowledgments
TRUEE is being developed under the support of the special research field SFB 823. Thanks go also to Prof. Dr. V. Blobel for support and discussions and to Thomas Peiffer for testing TRUEE.
References
[1] V. Blobel, OPAL Technical Note TN361 (1996) [2] K. M¨unich, Dissertation
[3] R. Abbasiet al.[AMANDA/IceCube Collaboration], Astroparticle Physics34(2010), pp. 48-58 [4] V. Curtef, Dissertation