E C O L O G Y
Northern cod species face spawning habitat losses if global warming exceeds 1.5°C
Flemming T. Dahlke1,2*, Martin Butzin1, Jasmine Nahrgang3, Velmurugu Puvanendran4, Atle Mortensen4, Hans-Otto Pörtner1,2, Daniela Storch1*
Rapid climate change in the Northeast Atlantic and Arctic poses a threat to some of the world’s largest fish popu- lations. Impacts of warming and acidification may become accessible through mechanism-based risk assessments and projections of future habitat suitability. We show that ocean acidification causes a narrowing of embryonic thermal ranges, which identifies the suitability of spawning habitats as a critical life-history bottleneck for two abundant cod species. Embryonic tolerance ranges linked to climate simulations reveal that ever-increasing CO2
emissions [Representative Concentration Pathway (RCP) 8.5] will deteriorate suitability of present spawning habitat for both Atlantic cod (Gadus morhua) and Polar cod (Boreogadus saida) by 2100. Moderate warming (RCP4.5) may avert dangerous climate impacts on Atlantic cod but still leaves few spawning areas for the more vulnerable Polar cod, which also loses the benefits of an ice-covered ocean. Emissions following RCP2.6, however, support largely unchanged habitat suitability for both species, suggesting that risks are minimized if warming is held “below 2°C, if not 1.5°C,” as pledged by the Paris Agreement.
INTRODUCTION
Ocean warming and acidification (OWA), driven by unabated CO2
emissions, are expected to constrain the survival and reproduction of many marine organisms (1). Existing knowledge implies that phys- iological limits of early life history stages define the vulnerability of species to OWA (2). Studies of worst-case impact scenarios are im- portant to raise risk awareness and gain societal acceptance for miti- gation policy (3). However, even more important is the identification of emission pathways required to minimize impact risks and to locate potential refuge habitats of endangered species that should receive priority in conservation (1–3). Yet, mechanism-based risk assessments that integrate vulnerable life stages and their specific habitat needs into a scenario context are barely available, especially for marine spe- cies inhabiting Arctic regions (4, 5).
The Subarctic and Arctic seas around Northern Europe (i.e., Iceland Sea, Norwegian Sea, East Greenland Sea, and Barents Sea) are projected to experience higher rates of ocean warming, acidifi- cation, and sea-ice loss than most other marine areas on Earth (6).
These ocean regions—previously termed the Seas of Norden (7)—
are inhabited by highly productive fish populations, most of which undertake annual migrations to specific spawning locations (4). The biophysical features of suitable spawning habitats support the sur- vival of early-life stages as well as their dispersal toward suitable nursery areas (8). Given that fish embryos are often more sensitive to environmental change than subsequent life stages (2), embryonic tolerance may act as a fundamental constraint on spawning habitat suitability. For example, thermal tolerance ranges that are narrower in fish embryos than in other life stages may represent a biogeographic constraint (8) and are likely explained by incomplete development of cardiovascular and other homeostatic systems (9). Ocean acidifi- cation (OA) caused by elevated aquatic CO2 levels may exacerbate
the disturbance of homeostasis (10), thereby narrowing the thermal range (2, 11) and possibly reducing spawning habitat suitability by impairing egg survival.
Both Atlantic cod and Polar cod are key members of the Northern high-latitude fish fauna, but they differ in terms of thermal affinity and spawning preference (4, 5). Atlantic cod is a “thermal generalist”
that occupies temperate to Arctic waters between −1.5° and 20°C (12). In contrast, Polar cod is a “thermal specialist,” endemic to the High Arctic and is rarely found at temperatures above 3°C (13). Because of overlapping temperature ranges of juvenile and adult life stages, both species coexist during their summer feeding migrations (14).
During winter and spring, however, spawning occurs in separate locations with different water temperatures and sea-ice conditions (Fig. 1). Given that Atlantic cod prefers warmer waters (3° to 7°C) than Polar cod (−1° to 2°C), the latter species is considered to be particularly vulnerable to climate change (5, 14). Moreover, another indirect threat to Polar cod reproduction is the projected loss of sea ice, which serves as nursery habitat for larvae and juveniles during spring and summer (5).
The spawning aggregations of Atlantic and Polar cod—often comprising many million individuals—are important resources for humans and other marine predators. For instance, the Norwegian Atlantic cod fishery alone generates an annual revenue of US$800 million (15), while Polar cod is an essential food item for many ma- rine birds and mammals (5). Estimating changes in spawning habitat suitability for these focal species therefore has high socioecological relevance (4). Functional responses of embryos to OWA incorpo- rated into habitat models may help identify spatial risks and ben- efits at varying emission scenarios, including the goal of limiting global warming to 1.5°C above preindustrial levels (16).
Here, we assess embryonic ranges of thermal tolerance under OA in Atlantic cod and Polar cod. Oxygen consumption rates (MO2) of eyed-stage embryos and larval morphometrics at hatch provide in- sight into energetic constraints imposed by OWA. Spawning habitat suitability was mapped across the Seas of Norden under different Rep- resentative Concentration Pathways (RCPs) by linking egg survival data with climate simulations of the Coupled Model Intercomparison
1Alfred Wegener Institute, Helmholtz Centre for Polar and Marine Research, Am Handelshafen 12, 27570 Bremerhaven, Germany. 2University of Bremen, NW 2 Leobener Str., 28359 Bremen, Germany. 3UiT The Arctic University of Norway, Tromsø, Norway. 4The Centre for Marine Aquaculture, Nofima, Tromsø, Norway.
*Corresponding author. Email: flemming.dahlke@awi.de (F.T.D.); daniela.storch@
awi.de (D.S.)
Copyright © 2018 The Authors, some rights reserved;
exclusive licensee American Association for the Advancement of Science. No claim to original U.S. Government Works. Distributed under a Creative Commons Attribution NonCommercial License 4.0 (CC BY-NC).
on January 22, 2019http://advances.sciencemag.org/Downloaded from
Project Phase 5 (CMIP5). RCPs assume either “no greenhouse gas mitigation” (RCP8.5), “intermediate mitigation” (RCP4.5), or “strong mitigation” (RCP2.6). The latter scenario was developed with the goal of limiting the increase in global mean surface temperature (averaged over land and sea surface) to below 2°C relative to the reference period 1850–1900 and is suitable for providing a first estimate for the conse- quences of keeping global warming to “well below 2°C, if not 1.5°C,”
as stated in the Paris Agreement (16).
RESULTS
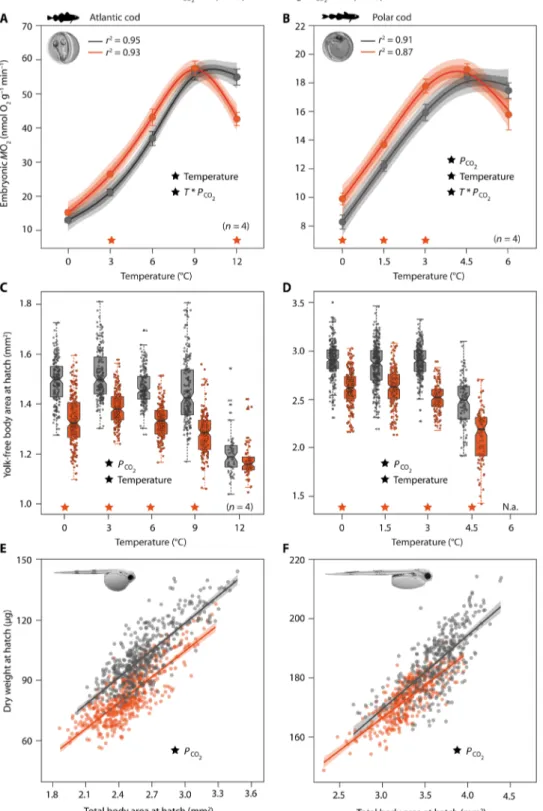
Embryonic oxygen consumption (MO2) increased with increasing temperature but leveled off or decreased at the warmest temperatures (Atlantic cod: ≥9°C; Polar cod: ≥4.5°C; Fig. 2, A and B), which is, in combination with increased mortality under these conditions (Fig. 3), indicative of severe heat stress. Embryos acclimated to lower tem- peratures (<9°/4.5°C) and elevated Pco2 (partial pressure of CO2) consumed ~10% more oxygen compared to those reared under con- trol Pco2. This trend was reversed upon warming, indicating that additional oxygen and associated energy demands under OA condi- tions cannot be met at critically high temperatures, causing the upper thermal limit of metabolic maintenance to decline. Higher energy requirements under elevated Pco2 may result from the cumulative costs of increased acid-base regulation, protein turnover, and dam- age repair (9, 10). The allocation of energy to life-sustaining functions should receive priority over growth (17), as was evidenced by CO2- and warming-induced reductions in larval size at hatch (Fig. 2, C to F, and fig. S2). The relative decrease in larval yolk-free body area due to elevated Pco2 averaged 10% for Atlantic cod (P < 0.001) and 13% for Polar cod (P < 0.001), with the smallest larvae hatching at the warmest temperature (Fig. 2, C and D, and table S1). Reductions in larval body size and dry weight (Fig. 2, E and F, and table S1) are in line with the CO2-induced reallocation of energy away from growth also seen in other fish species (18).
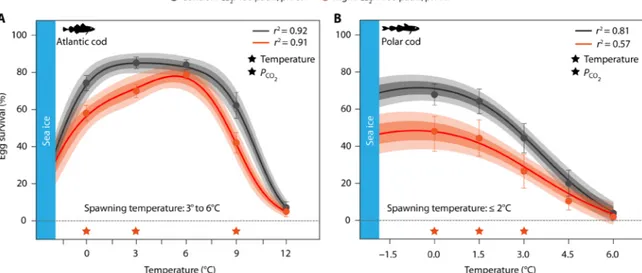
Egg survival decreased outside preferred spawning temperatures of Atlantic cod (≤0° and ≥9°C) and Polar cod (≥3°C), particularly under the influence of elevated Pco2 (Fig. 3 and table S1). Accordingly, our results confirm that embryonic tolerance ranges represent a tight constraint on the thermal spawning niche of Atlantic cod and Polar cod. CO2-induced mortalities at their optimum spawning tempera- ture were less pronounced for Atlantic cod (6°C, Fig. 3A) than for Polar cod (0° to 1.5°C, Fig. 3B). This observation corresponds with the variation in CO2 sensitivity reported by previous studies on fish early-life stages that tested for OWA effects solely under optimum temperature conditions (18). However, both species experienced a similar CO2-related decline in egg survival at their respective warmer threshold (−48% at 9°C for Atlantic cod and −67% at 3°C for Polar cod). Increased thermal sensitivity of embryos under projected Pco2
levels implies a narrowing of their thermal tolerance range and thereby of the species reproductive niche (2). As a consequence, the spatial ex- tent of thermally suitable spawning habitat for Atlantic cod and Po- lar cod may not only shift to higher latitudes in response to warming but also contract due to OWA.
Compared with contemporary (known) spawning sites of Atlantic cod and Polar cod in the study area (blue areas in Fig. 1; yellow dashed areas in Fig. 4), our baseline simulations (1985–2004) suggest that spawning occurs exclusively within the thermal optimum range of embryo development [>90% potential egg survival (PES), Fig. 4]. How- ever, the area of thermally suitable spawning habitat (PES >90%) is larger than the area where spawning actually occurs. For example, despite suitable temperatures, no spawning of Atlantic cod is cur- rently observed in the northeastern Barents Sea (19), indicating that spawning habitat suitability also depends on factors other than tem- perature. Mechanisms that preclude certain areas as suitable for spawn- ing may include aberrant dispersal of eggs and larvae, unfavorable feeding conditions, and predation pressure (8, 19).
By 2100, unabated OWA (RCP8.5) is projected to cause a substantial decline in PES at major spawning sites of both species (Fig. 5, A to C).
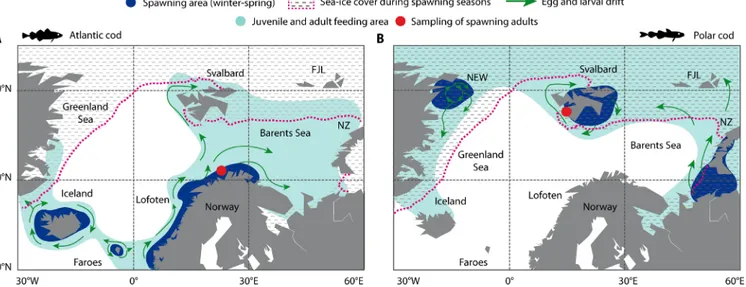
Fig. 1. Distribution patterns of Atlantic cod and Polar cod in the Seas of Norden. (A) Atlantic cod; (B) Polar cod. Populations of both species reproduce during winter and spring (Atlantic cod: March to May; Polar cod: December to March) at species-specific locations (i.e., spawning habitats, blue-shaded areas) with char- acteristic temperature and sea-ice conditions (Atlantic cod: 3° to 7°C, open water; Polar cod: −1° to 2°C, closed sea-ice cover). Green arrows indicate egg and larval dispersal driven by prevailing surface currents. During summer, the feeding grounds (green-shaded areas) of both species partly overlap, for example, around Svalbard, which marks the northernmost distribution limit of Atlantic cod. Red symbols denote the origin of animals (spawning adults) used in this study. Distribution maps were redrawn after (4, 13, 33). NEW, Northeast Water Polynya; FJL, Franz-Joseph-Land; NZ, Novaya Zemlya.
on January 22, 2019http://advances.sciencemag.org/Downloaded from
Fig. 2. Effects of elevated Pco2 on temperature-dependent oxygen consumption rates (MO2) and growth of Atlantic cod embryos and Polar cod embryos (right). (A and B) MO2 was measured in eyed-stage embryos (image). Symbols are means (±SEM depicted as bars, n = 6 or 4). Performance curves (lines) are based on n = 28 data points. Dark and light shadings indicate 90 and 95% Bayesian credible confidence intervals, respectively. (C and D) Larval yolk-free body area at hatch was assessed as an indicator of somatic growth and resource (yolk) utilization. Box plots overlaid with individual values show the 25th, 50th, and 75th percentile; whiskers mark 95% confidence intervals. (D) Sufficient sample sizes were not available at 6°C because most individuals died or hatched malformed. (E and F) Offsets between regression lines (with 95% confidence intervals) indicate CO2-related differences in size-weight relationships of newly hatched larvae (image). Individuals were pooled across tem- perature treatments (E: 0° to 12°C, F: 0° to 3°C). (A to F) Significant main effects of temperature, Pco2, or their interaction (T * Pco2) are indicated by black ★, whereas orange ★ denote significant CO2 effects within temperature treatments (Tukey post hoc test, n = 6 or 4 per treatment). See table S1 for details on statistical tests. N.a., not available.
on January 22, 2019http://advances.sciencemag.org/Downloaded from
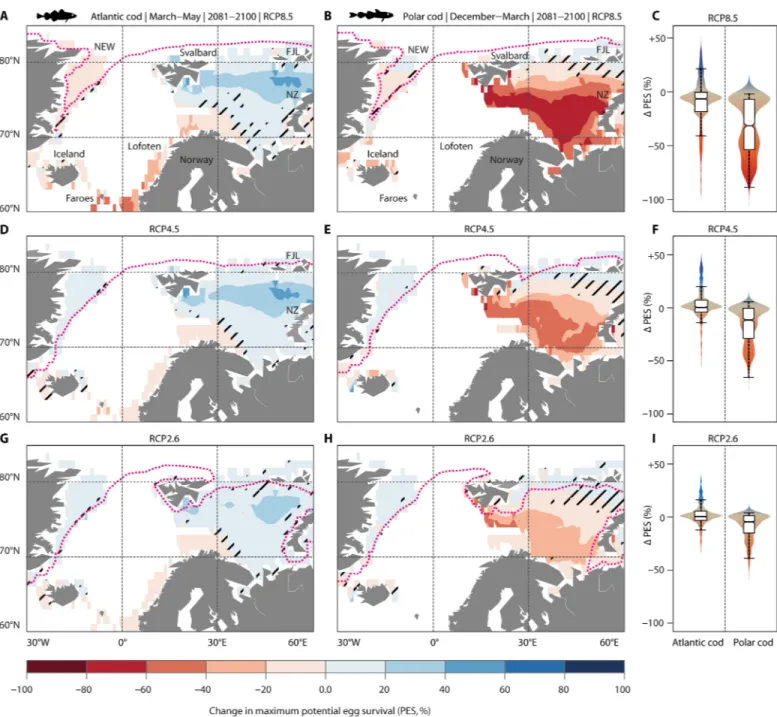
For Atlantic cod, PES is projected to decrease around Iceland (−10 to −40%) and the Faroe Islands (−20 to −60%) and along the entire Norwegian coast (−20 to −60%), including the most important spawn- ing sites at the Lofoten archipelago (at 68°N, Fig. 5A). In turn, exten- sive shelf regions off Svalbard and across the northeastern Barents Sea will become more suitable (PES, +10 to +60%) due to warming and decreasing sea-ice cover. However, potential habitat gains in the North are constrained by reduced cold tolerance of Atlantic cod
embryos under OA conditions and, possibly, unknown constraining factors (see above). Under RCP4.5, decrements in PES of Atlantic cod at some southern spawning sites (e.g., Faroe Islands: −10 to −40%) are largely outweighed by thermal benefits (PES, +20 to +60%) in the northeastern Barents Sea (between Svalbard, Franz Josef Land, and Novaya Zemlya; Fig. 5, D and F).
Polar cod will likely experience the most dramatic losses of spawn- ing habitat south of Svalbard and Novaya Zemlya (PES, −40 to −80%;
Fig. 3. Effects of elevated Pco2 on temperature-dependent egg survival in Atlantic cod and Polar cod. (A) Atlantic cod; (B) Polar cod. Symbols represent means (±SEM depicted as bars, n = 6). Thermal performance curves (TPCs, lines) of each species are based on n = 36 data points. Dark and light shadings indicate 90 and 95% Bayesian credible confidence intervals, respectively. TPCs were extrapolated into subzero temperatures by incorporating freezing tolerance thresholds from the literature (Materials and Methods). Significant main effects of temperature, Pco2, or their interaction (T * Pco2) are indicated by black ★, whereas orange ★ denote sig- nificant CO2 effects within temperature treatments (Tukey post hoc test, n = 6 or 4 per treatment). See table S1 for details on statistical tests.
Fig. 4. Current (baseline) spawning habitat suitability for Atlantic cod and Polar cod in the Seas of Norden. (A) Atlantic cod; (B) Polar cod. Spawning habitat suit- ability is expressed as PES (%PES, color coded) by combining experimental survival data (Fig. 3) with WOA13 temperature fields (1° × 1°, upper 50 m of shelf seas) for the baseline period 1984–2005. Values are averaged over spawning seasons (Atlantic cod: March to May; Polar cod: December to March) and referenced against locations where spawning has been documented [yellow dashed areas (13, 33)]. The spatial extent of thermally suitable spawning habitat (PES > 90%) is typically larger than the
“realized spawning habitat” because other limiting factors are not considered. Dotted magenta lines indicate the respective seasonal sea-ice edge positions (defined as areas with ice concentrations > 70%; note that sea-ice edge various slightly between species due to varying species-specific spawning seasons).
on January 22, 2019http://advances.sciencemag.org/Downloaded from
RCP8.5; Fig. 5B). Moreover, Polar cod is going to lose most of its under-ice habitats except for a small refuge on the East Greenland shelf (Fig. 5B). Even warming without OA effects (RCP4.5; Fig. 5, E and F) will substantially reduce the suitability of important spawn- ing habitats for Polar cod off Svalbard (PES, −20 to −60%) and Novaya Zemlya (PES, −10 to −40%). The widespread loss of sea ice
under RCP8.5 and RCP4.5 scenarios may indirectly affect the re- productive success of Polar cod, because the ice protects spawning adults from predation and serves as a feeding habitat for early-life stages (5). Limiting global warming to about 1.5°C above preindus- trial levels (that is, the median temperature of RCP2.6) may not only minimize reductions in PES at the present core spawning areas of
Fig. 5. Change in thermally suitable spawning habitat of Atlantic cod (left) and Polar cod (right) in the Seas of Norden under RCPs. (A to C) RCP8.5: Unabated OWA.
(D to F) RCP4.5: Intermediate warming (no acidification considered). (G to I) RCP2.6: Less than 2°C global warming (no acidification considered). Maps show the shift in PES between the baseline period (1985–2004; spawning season of Atlantic cod: March to May; spawning season of Polar cod: December to March; see Fig. 3) and the median of CMIP5 multimodel-based projections (seasonal sea surface temperature, 0 to 50 m; see Materials and Methods) for this century’s end (2081–2100). Black shading indicates areas (cells, 1° × 1°) with high uncertainty (that is, the shift in PES within that cell is smaller than the CMIP5 ensemble spread; see Materials and Methods). Dotted magenta lines represent the sea-ice edge positions of the respective species-specific spawning season (defined as areas with ice concentrations > 70%). (C, F, and I) For each map, values (change in PES) of individual cells are summarized by kernel density estimations, with the width corresponding to the relative occurrence of values. Box plots show the 25th, 50th, and 75th percentile; the ends of the whiskers mark the 95% intervals.
on January 22, 2019http://advances.sciencemag.org/Downloaded from
both species to less than 10% (Fig. 5, G to I) but also maintain some sea-ice cover.
DISCUSSION
Our projections suggest that OWA-driven impacts on egg survival and consequent changes in spawning habitat suitability may be pri- mary determinants of climate-dependent constraints on Atlantic cod and Polar cod. Present findings are in line with the hypothesis that tolerance thermal ranges and embryonic habitats of both species are compressed by progressive OWA (2). Our results also corrobo- rate the idea that unmitigated climate change represents an existential threat for cold-adapted species such as Polar cod (20), although we identified some cold refugia for this species in the High Arctic. At- lantic cod may follow the poleward displacement of its thermal op- timum, possibly leading to the establishment of this commercially important species in regions that are currently dominated by Polar cod. The parallel decrease in habitat suitability off Iceland and the Norwegian coast (under RCP8.5) implies that, by 2100, spawning south of the Arctic Circle (e.g., south of the Lofoten) may no longer be possible for Atlantic cod. Potential displacements of commercially important fish stocks across management boundaries and exclusive economic zones pose major challenges not only to national fishermen and conservationist (5) but also to international bodies and regulations, which intend to avoid overexploitation, resource conflicts, and the degradation of pristine ecosystems in the Arctic (4, 21).
However, if global warming is limited to 1.5°C above preindustrial levels, then changes in thermal suitability of present spawning hab- itats are unlikely to exceed critical thresholds of Atlantic cod and Polar cod. Residual risks may be reduced further as both species can potentially adapt to climatic changes, by responding either (i) via shifts in the timing and/or location of spawning within present regions (22) or (ii) through transgenerational processes that enhance physiological tolerance (23). Uncertainties in our results also relate to (iii) the reli- ability and resolution of the CMIP5 climate projections (24).
First, the temporal window for spawning in the North is limited to late winter-spring due to the extreme seasonality of light and as- sociated primary production (food for planktonic larvae) at high latitudes (>60°N) (22). Significant changes in spawning phenology are therefore unlikely to occur in this region. Instead, northward expansions of spawning during historic and ongoing warming periods are well documented, especially for Atlantic cod, which extended its spawning activity to West Svalbard in the 1930s (25). However, core spawning areas (e.g., the Lofoten archipelago for the Barents Sea population) have always been occupied during past centuries, pos- sibly due to favorable combinations of biotic and abiotic factors that maximize recruitment success (8, 22). After spawning, dispersal of eggs and larvae toward suitable nursery areas—sometimes over hundreds of kilometers—plays an important role in terms of life- cycle connectivity and population replenishment (8). Spawning at alternative locales (as required under RCP8.5 for both species and under RCP4.5 for Polar cod) could disturb connectivity and there- fore increase the risk of advective losses and recruitment failure (8).
Accordingly, successful establishment of new spawning habitats will largely depend on a number of factors in addition to egg survival (i.e., prey availability, predation pressure, and connectivity), all of which are currently difficult to predict (2, 22).
Second, our results assume that embryonic tolerance ranges are constant across different populations and generations (i.e., no evo-
lutionary change within this century). These assumptions are sup- ported by experimental data [e.g., similar temperature optima for egg development among different Atlantic cod populations (26); see also fig. S1], as well as by field observations [e.g., consistent north- ward shift of cod spawning activity in response to previous/ongoing warming (17)] and phylogenetic analyses of thermal tolerance evo- lution in marine fish [e.g., <0.1°C change in thermal tolerance per 1 million years (27)]. Transgenerational plasticity (TGP) may pro- mote short-term adaptation to environmental change via nongenetic inheritance (e.g., maternal transmission) (23). However, in contrast to the theory of TGP, experiments on Atlantic cod suggest that egg viability is impaired during similar degrees of warming if females are heat exposed during gonad maturation (28). This example of negative TGP corresponds with the majority (57%) of studies on TGP in fish that observed either neutral (33%) or negative (24%) responses (29). Given the limited capacity for short-term adaptation, it is most likely that species have to abandon their traditional habitats as soon as physiological limits are exceeded (2). Accordingly, our results identify not only high-risk areas but also potential refuge habitats that should receive priority with respect to the implementation of marine reserves.
Third, CMIP5 climate projections include uncertainties (24). To some extent, these uncertainties can be reduced and assessed by considering multimodel results (see Materials and Methods). Near- coastal habitats are poorly represented in current global climate models (24). The confidence of climate impact projections for these areas could be improved in future studies, most elegantly by means of global multiresolution ocean models with unstructured meshes (30).
In light of embryonic intolerance to OWA, we show that with unabated greenhouse gas emissions, large areas presently used for spawning will become less suitable for recruitment of Atlantic cod and Polar cod, possibly leading to cascading impacts on Arctic food webs and associated ecosystem services (4, 5). However, our results also emphasize that mitigation measures, as pledged by the Paris Agreement, can ameliorate climate change effects on both species.
Given that current CO2 emissions trajectories yield a 1% chance of limiting global warming to 1.5°C above preindustrial levels (31), our results call for immediate emission cuts following scenarios compatible with warming by 1.5°C to avert irreversible ecosystem damage in the Arctic and elsewhere.
MATERIALS AND METHODS Broodstock
Atlantic cod were caught by longlining in the southern Barents Sea (Tromsøflaket: 70°28′00″N, 18°00′00″E) in March 2014. Mature fish were transported to the Centre for Marine Aquaculture (Nofima AS, Tromsø, Norway) and held in a flow-through tank (25 m3) under ambient light, salinity [34 practical salinity units (PSU)], and temperature conditions (5° ± 0.5°C). Polar cod were caught in Kongsfjorden (West Svalbard: 78°95′02″N, 11°99′84″E) by trawling in January 2014. Selected fish were held in flow-through tanks (0.5 m3) and transferred to the Aquaculture Research Station in Karvikå (NOFIMA, The Arctic University of Norway UiT, Tromsø).
At the station, the fish were kept in a flow-through tank (2 m3) at 3° ± 0.3°C water temperature (34 PSU) and complete darkness. In both experiments, gametes used for in vitro fertilizations were ob- tained by strip spawning from n = 13 (Polar cod: 12) males and n = 6 females (table S2).
on January 22, 2019http://advances.sciencemag.org/Downloaded from
Fertilization protocol
All fertilizations were conducted within 30 min after stripping. Each egg batch was split in half and fertilized using filtered and ultraviolet (UV)–sterilized seawater (34 PSU) previously adjusted to the brood- stock holding temperature (Atlantic cod: 5°C; Polar cod: 3°C) and two different Pco2 conditions [control Pco2: 400 atm, pH(Free-Scale)
8.15; high Pco2: 1100 atm, pHF 7.77]. A standardized dry fertiliza- tion protocol with milt aliquots from n = 3 males was used to max- imize fertilization success (32).
Fertilization success
Fertilization success was assessed in subsamples (3 × 100 eggs per batch and Pco2 treatment), which were incubated within sealed petri dishes until the 8/16-cell stage (Atlantic cod: 12 hours, 5°C; Polar cod:
24 hours, 3°C) and photographed under a stereomicroscope for sub- sequent evaluation (table S3). These images were also used to determine the mean egg diameter of an egg batch (30 eggs per batch, table S3).
Incubation setup
According to different spawning seasons, both experiments could be conducted consecutively with the same experimental setup in 2014 (Polar cod: February to April; Atlantic cod: April to May). Eggs pre- viously fertilized at either control or high Pco2 were maintained at the respective CO2 treatment and incubated until hatch at five dif- ferent temperatures (Atlantic cod: 0°, 3°, 6°, 9°, and 12°C; Polar cod:
0°, 1.5°, 3°, 4.5°, and 6°C). Temperature ranges were selected to cover spawning preferences of Atlantic cod (3° to 7°C) (33) and Polar cod (≤2°C) (13) and projected warming scenarios for the respective re- gion. Each treatment group of an egg batch was subdivided into two stagnant incubators (20 incubators per female, 120 in each experi- ment). To not bias survival estimates, only one of the two incuba- tors was used to evaluate egg survival (and larval morphometrics at hatch), while subsamples required for embryonic MO2 measure- ments were taken from the second incubator.
Initially, all incubators (volume, 1000 ml) were filled with filtered (0.2 m) and UV-sterilized seawater (34 PSU) adjusted to the respec- tive fertilization treatment and stocked with positively buoyant eggs.
With regard to oxygen supply in a stagnant incubator, it is important to ensure that the eggs have enough space to arrange themselves in a single layer beneath the water surface. We therefore adjusted the amount of eggs per incubator (Atlantic cod: ~300 to 500; Polar cod:
~200 to 300) according to differences in egg size between Atlantic cod (~1.45 mm) and Polar cod (~1.65 mm). Loaded incubators were then located in differently thermostatted seawater baths (volume, 400 liters) to ensure a smooth temperature change inside the incu- bator. The transparent, bottom- tapered incubators were sealed with a Styrofoam cover to prevent CO2 outgassing and temperature fluctu- ations. According to natural light regimes, Atlantic cod eggs received dim light with a daily rhythm of 8 hours light/16 hours darkness, and Polar cod eggs were kept in darkness except for dim light expo- sure during handling. Every 24 hours, 90% of the water volume of each incubator was replaced by filtered (0.2 m) and UV-sterilized seawater to avoid oxygen depletion. An outlet valve was mounted at the bottom of the incubators to drain the seawater with dead eggs, which lose buoyancy and descend to the bottom. Each seawater bath contained two 60-liter reservoir tanks, which were used to preadjust seawater to the corresponding temperature and Pco2 conditions.
Water temperatures inside the water baths were controlled by thermo- stats and recorded automatically every 15 min (±0.1°C) via a multi-
channel aquarium computer (IKS-Aquastar, IKS Systems, Germany).
Future Pco2 conditions were established by injection of pure CO2 gas into the submerged 60-liter reservoir tanks at each temperature. A multichannel feedback system (IKS-Aquastar), connected to individual pH probes (IKS-Aquastar) and solenoid valves, was used to control water pH and Pco2 values. The Pco2 of the reservoir tanks was mea- sured in situ before each water exchange with an infrared Pco2 probe (Vaisala GMP 343, manual temperature compensation, ±5 atm accu- racy; Vaisala, Finland). The probe was equipped with a MI70 Reading device and an aspiration pump, which was connected to a degassing membrane (G541, Liqui- Cel, 3M, USA) to measure Pco2 in air equili- brated to dissolved water gases (34). Factory calibration was confirmed by measurements of seawater previously bubbled with a technical gas mixture (1000 atm CO2 in air, Air Liquide, Germany). Before the daily water exchange, pH values of the reservoir tanks were measured with a laboratory- grade pH electrode to three decimal places (Mettler Toledo InLab Routine Pt 1000 with temperature compensation, Mettler Toledo, Switzerland), which was connected to a WTW 3310 pH meter.
A two-point calibration with NBS (National Bureau of Standards) buf- fers was performed on a daily basis. To convert NBS to the free proton concentration scale for seawater pH (35), the electrode was calibrated with tris-HCl seawater buffers (36), which were acclimated to the corresponding incubation temperature before each measurement.
Seawater pH values refer to the free pH scale (pHF) throughout this manuscript. Seawater parameters are summarized in fig. S3.
Egg survival
Egg mortality was recorded on a 24-hour basis until all individuals within an incubator had either died or hatched (fig. S4). Once hatching commenced, free-swimming larvae were collected in the morning, euthanized with an overdose of tricaine methanesulfonate (MS-222), and counted after visual examination for morphological deformities under a stereomicroscope. The incidence of larval deformities was quantified as the percentage of hatchlings exhibiting severe defor- mations of the yolk sac, cranium, or vertebral column. Egg survival was defined as the percentage of nonmalformed, viable larvae that hatched from the initial number of fertilized eggs (fig. S5). The pro- portion of fertilized eggs within an incubator was estimated from the mean fertilization success of the respective egg batch (table S3).
Respirometry
Oxygen consumption rates (MO2) of eyed-stage embryos (at 50%
eye pigmentation, fig. S4) were measured in closed, temperature- controlled respiration chambers (OXY0 41 A, Collotec Meßtechnik GmbH, Germany). The double-walled chambers were connected to a flow-through thermostat to adjust the temperature of the respira- tion chamber to the corresponding incubation temperature of the eggs. Measurements were conducted in triplicate with 10 to 20 eggs of each female and treatment combination. Eggs were placed into the chamber with a volume of 1 ml of sterilized seawater adjusted to the corresponding Pco2 treatment. A magnetic microstirrer (3 mm) was placed underneath the floating eggs to avoid oxygen stratifica- tion within the respiration chamber. The change in oxygen satura- tion was detected by micro-optodes (fiber-optic microsensor, flat broken tip, diameter: 140 m, PreSens GmbH, Germany) connected to a Microx TX3 (PreSens GmbH, Germany). Recordings were stopped as soon as the oxygen saturation declined below 80% air saturation.
Subsequently, the water volume of the respiration chamber and wet weight of the measured eggs (gww) were determined by weighing
on January 22, 2019http://advances.sciencemag.org/Downloaded from
(±1 mg). Oxygen consumption was expressed as [nmol O2 (gww * min)−1] and corrected for bacterial oxygen consumption (<5%) and optode drift, which was determined by blank measurements before and after three successive egg respiration measurements.
Larval morphometrics
Subsamples of 10 to 30 nonmalformed larvae from each female and treatment combination were photographed for subsequent measure- ments of larval morphometrics (standard length, yolk-free body area, total body area, and yolk sac area) using Olympus image analysis software (Stream Essentials, Olympus, Tokyo, Japan). Only samples obtained from the same daily cohort (during peak hatch at each tem- perature treatment) were used for statistical comparison. After being photographed, 10 to 20 larvae were freeze dried to determine individ- ual dry weights (±0.1 g, XP6U Micro Comparator, Mettler Toledo, Columbus, OH, USA). Replicates with less than 10 nonmalformed larvae were precluded from statistical analyses.
Statistical analysis
Statistics were conducted with the open source software R, version 3.3.3 (www.r-project.org). Linear mixed effect models [package “lme4” (37)]
were used to analyze data on egg survival and MO2. In each case, we treated different levels of temperature and Pco2 as fixed factors and included “female” (egg batch) as a random effect. Differences in larval morphometrics (yolk-free body area, total body area, dry weight, stan- dard length, and yolk sac area) were determined by multifactorial analysis of covariance. These models were run with temperature and Pco2 as fixed factors and egg diameter as a covariate. Levene’s and Shapiro-Wilk methods confirmed normality and homoscedasticity, respectively. The package “lsmeans” (38) was used for pairwise com- parisons (P values were adjusted according to Tukey’s post hoc test method). All data are presented as means (± SEM) and statistical tests with P < 0.05 were considered significant. Results are summa- rized in table S1.
Curve fitting
Generalized additive models [package “mgcv” (39)] were used to fit temperature-dependent curves of successful development building on egg survival and MO2. This method has the benefit of avoiding a priori assumptions about the shape of the performance curve, which is crucial in assessing the impact of elevated Pco2 on thermal sensi- tivity. “Betar” and “Gaussian” error distributions were used for egg survival and MO2 data, respectively. To avoid overfitting, the complex- ity of the curve (i.e., the number of degrees of freedom) was determined by penalized regression splines and generalized cross-validation (39).
Models of egg survival were constrained at thermal minima because eggs of cold-water fish can survive subzero temperatures far below any ap- plicable in rearing practice. Following Niehaus et al. (40), we forced each model with artificial zero values (n = 6) based on absolute cold limits from the literature. These limits were set to −4°C for Atlantic cod (41) and −9°C for Polar cod assuming similar freezing resistance, as reported for another ice-associated fish species from Antarctica (42).
Spawning habitat maps
Fitted treatment effects on normalized egg survival data (fig. S6A;
raw data are shown in Fig. 3) were linked to climate projections for the Seas of Norden to infer spatially explicit changes in the maximum PES under different RCPs. That is, the treatment fits were evaluated for gridded upper-ocean water temperatures (monthly averages) bi-
linearly interpolated to a horizontal resolution of 1° × 1° and a verti- cal resolution of 10 m. To account for species-specific reproduction behavior, we first constrained each map according to spawning sea- sonality and depth preferences reported for Atlantic cod [March to May, 50 to 400 m (33)] and Polar cod [December to March, 5 to 400 m (13)]. As both species produce pelagic eggs that immediately ascend into the upper mixed layer if spawned at greater depths (13, 33), we further limited the eligible depth range to the upper 50 m. PES at a given latitude and longitude was then estimated from the calculations by selecting the value at the depth of maximum egg survival (at 0 to 50 m depth). Egg dispersal was not considered since the major bulk of temperature- and acidification-related mortality occurs during the first week of development (fig. S4).
Oceanic conditions were expressed as climatological averages of water temperatures, sea-ice concentrations, and the pH of surface water. Our observational baseline is represented by monthly water temperatures [WOA13 (43)] and sea-ice concentrations [HadISST (44)], averaged from 1985 to 2004, and by pH values averaged over the period 1972–2013 [GLODAPv2 (45, 46)]. Simulated ocean cli- mate conditions were expressed as 20-year averages of monthly seawater temperatures and sea-ice concentrations and of 20-year averages of annual pH values of surface water. End-of-century pro- jections were derived from climate simulations for 2081–2100 carried out in CMIP5 (45). We considered only those 10 ensemble members (see table S4) that provide data on each of the relevant parameters (water temperature, sea ice, and pH) under RCP8.5, RCP4.5, and RCP2.6 (47). Projected pH values and temperatures are shown in fig. S6 (E to L). To account for potential model biases, we diagnosed for each of the 10 CMIP5 models the differences between simula- tions and observations for the baseline period and subtracted these anomalies from the CMIP5-RCP results for 2081–2100. For 2081–
2100, we considered the CMIP5-RCPs ensemble median of maximum PES and assessed the uncertainty of PES at a given location by defin- ing a signal-to-noise ratio that relates the temporal change in PES between 2081–2100 and 1985–2004 (PES) to the median absolute de- viation (MAD) of results for 2081–2100. Model results are not robust where the temporal change in PES is smaller than the ensemble spread, i.e., PES/MAD < 1. PES calculations for scenarios RCP2.6 and RCP4.5 were carried out for Pco2 = 400 atm. The effect of elevated Pco2
(1100 atm) on PES was only considered under scenario RCP8.5.
SUPPLEMENTARY MATERIALS
Supplementary material for this article is available at http://advances.sciencemag.org/cgi/
content/full/4/11/eaas8821/DC1
Fig. S1 Thermal niches of adult Atlantic cod and Polar cod.
Fig. S2 Treatment effects on larval morphometrics at hatch.
Fig. S3. Water quality measurements.
Fig. S4. Effects of temperature and Pco2 on daily mortality rates of Atlantic cod and Polar cod.
Fig. S5. Effects of temperature and Pco2 on embryonic development of Atlantic cod and Polar cod.
Fig. S6. Spawning habitat maps for Atlantic cod and Polar cod are based on experimental egg survival data and climate projections under different emission scenarios.
Table S1. Summary table for statistical analyses conducted on data presented in Figs. 2 and 3 of the main text and in figs. S1 and S5.
Table S2. Length and weight of female and male Atlantic cod and Polar cod used for strip spawning and artificial fertilization.
Table S3. Mean egg diameter and fertilization success of egg batches (±SD, n = 3) produced by different females (n = 6).
Table S4. List of CMIP5 models that met the requirements for this study (for details, see the
“Spawning habitat maps” section in the main text).
References (48–55)
on January 22, 2019http://advances.sciencemag.org/Downloaded from
REFERENCES AND NOTES
1. J.-P. Gattuso, A. Magnan, R. Billé, W. W. L. Cheung, E. L. Howes, F. Joos, D. Allemand, L. Bopp, S. R. Cooley, C. M. Eakin, O. Hoegh-Guldberg, R. P. Kelly, H.-O. Pörtner, A. D. Rogers, J. M. Baxter, D. Laffoley, D. Osborn, A. Rankovic, J. Rochette, U. R. Sumaila, S. Treyer, C. Turley, Contrasting futures for ocean and society from different anthropogenic CO2 emissions scenarios. Science 349, aac4722 (2015).
2. H.-O. Pörtner et al., in Climate Change 2014: Impacts, Adaptation, and Vulnerability. Part A:
Global and Sectoral Aspects. Contribution of Working Group II to the Fifth Assessment Report of the Intergovernmental Panel on Climate Change (Cambridge Univ. Press, 2014), pp. 411–484.
3. A. K. Magnan, M. Colombier, R. Billé, F. Joos, O. Hoegh-Guldberg, H.-O. Pörtner, H. Waisman, T. Spencer, J.-P. Gattuso, Implications of the Paris agreement for the ocean.
Nat. Clim. Chang. 6, 732–735 (2016).
4. T. Haug, B. Bogstad, M. Chierici, H. Gjøsæter, E. H. Hallfredsson, Å. S. Høines, A. Håkon Hoel, R. B. Ingvaldsen, L. Lindal Jørgensen, T. Knutsen, H. Loeng, L.-J. Naustvoll, I. Røttingen, K. Sunnanå, Future harvest of living resources in the Arctic Ocean north of the Nordic and Barents Seas: A review of possibilities and constraints. Fish. Res. 188, 38–57 (2017).
5. J. S. Christiansen, No future for Euro-Arctic ocean fishes? Mar. Ecol. Prog. Ser. 575, 217–227 (2017).
6. O. Hoegh-Guldberg, R. Cai, E. S. Poloczanska, P. G. Brewer, S. Sundby, K. Hilmi, V. J. Fabry, S. Jung, The Ocean, in Climate Change 2014: Impacts, Adaptation, and Vulnerability. Part B:
Regional Aspects. Contribution of Working Group II to the Fifth Assessment Report of the Intergovernmental Panel of Climate Change, V. R. Barros, C. B. Field, D. J. Dokken, M. D. Mastrandrea, K. J. Mach, T. E. Bilir, M. Chatterjee, K. L. Ebi, Y. O. Estrada, R. C. Genova, B. Girma, E. S. Kissel, A. N. Levy, S. MacCracken, P. R. Mastrandrea, L. L. White, Eds.
(Cambridge Univ. Press, 2014), chap. 30, pp. 1655–1731.
7. J. Blindheim, The seas of Norden, in Norden: Man and Environment, U. Varjo, W. Tietze, Eds. (Gebrüder Borntraeger, 1987), pp. 20–32.
8. L. Ciannelli, K. Bailey, E. M. Olsen, Evolutionary and ecological constraints of fish spawning habitats. ICES J. Mar. Sci. 72, 285–296 (2015).
9. H.-O. Pörtner, C. Bock, F. C. Mark, Oxygen- and capacity-limited thermal tolerance:
Bridging ecology and physiology. J. Exp. Biol. 220, 2685–2696 (2017).
10. I. M. Sokolova, Energy-limited tolerance to stress as a conceptual framework to integrate the effects of multiple stressors. Integr. Comp. Biol. 53, 597–608 (2013).
11. F. T. Dahlke, E. Leo, F. C. Mark, H.-O. Pörtner, U. Bickmeyer, S. Frickenhaus, D. Storch, Effects of ocean acidification increase embryonic sensitivity to thermal extremes in Atlantic cod, Gadus morhua. Glob. Chang. Biol. 23, 1499–1510 (2017).
12. D. A. Righton, K. Haste Andersen, F. Neat, V. Thorsteinsson, P. Steingrund, H. Svedäng, K. Michalsen, H.-H. Hinrichsen, V. Bendall, S. Neuenfeldt, P. Wright, P. Jonsson, G. Huse, J. van der Kooij, H. Mosegaard, K. Hüssy, J. Metcalfe, Thermal niche of Atlantic cod Gadus morhua: Limits, tolerance and optima. Mar. Ecol. Prog. Ser. 420, 1–13 (2010).
13. A. M. Ajiad, H. Gjøsæter, in The Barents Sea. Ecosystem, Resources, Management. Half a Century of Russian-Norwegian Cooperation, T. Jakopsen, V. K. Ozhigin, Eds. (Tapir Academic Press, 2011), pp. 315–328.
14. M. Fossheim, R. Primicerio, E. Johannesen, R. B. Ingvaldsen, M. M. Aschan, A. V. Dolgov, Recent warming leads to a rapid borealization of fish communities in the Arctic.
Nat. Clim. Chang. 5, 673–677 (2015).
15. FAO, The State of World Fisheries and Aquaculture (SOFIA) (FAO Fisheries and Aquaculture Department, 2018).
16. UNFCCC, Adoption of The Paris Agreement FCCC/CP/2015/L.9/Rev.1 (2015).
17. W. Wieser, A. Laich, N. Medgyesy, Energy allocation and yield and cost of growth in young Esox lucius and Coregonus lavaretus (Teleostei): Influence of species, prey type and body size. J. Exp. Biol. 169, 165–179 (1992).
18. A. J. Esbaugh, Physiological implications of ocean acidification for marine fish: Emerging patterns and new insights. J. Comp. Physiol. B 188, 1–13 (2017).
19. L. C. Stige, Ø. Langangen, N. A. Yaragina, F. B. Vikebø, B. Bogstad, G. Ottersen, N. C. Stenseth, D. Hjermann, Combined statistical and mechanistic modelling suggests food and temperature effects on survival of early life stages of Northeast Arctic cod (Gadus morhua). Prog. Oceanogr. 134, 138–151 (2015).
20. W. W. L. Cheung, V. W. Y. Lam, J. L. Sarmiento, K. Kearney, R. Watson, D. Pauly, Projecting global marine biodiversity impacts under climate change scenarios. Fish Fish. 10, 235–251 (2009).
21. M. L. Pinsky, G. Reygondeau, R. Caddell, J. Palacios-Abrantes, J. Spijkers, W. W. L. Cheung, Preparing ocean governance for species on the move. Science 360, 1189–1191 (2018).
22. S. Sundby, K. F. Drinkwater, O. S. Kjesbu, The North Atlantic spring-bloom system—Where the changing climate meets the winter dark. Front. Mar. Sci. 3, 28 (2016).
23. P. L. Munday, R. R. Warner, K. Monro, J. M. Pandolfi, D. J. Marshall, Predicting evolutionary responses to climate change in the sea. Ecol. Lett. 16, 1488–1500 (2013).
24. L. Bopp, L. Resplandy, J. Orr, S. Doney, J. Dunne, M. Gehlen, Multiple stressors of ocean ecosystems in the 21st century: Projections with CMIP5 models. Biogeosciences 10, 6225–6245 (2013).
25. K. F. Drinkwater, The regime shift of the 1920s and 1930s in the North Atlantic.
Prog. Oceanogr. 68, 134–151 (2006).
26. S. Tsoukali, A. W. Visser, B. R. MacKenzie, Functional responses of North Atlantic fish eggs to increasing temperature. Mar. Ecol. Prog. Ser. 555, 151–165 (2016).
27. L. Comte, J. D. Olden, Climatic vulnerability of the world’s freshwater and marine fishes.
Nat. Clim. Chang. 7, 718–722 (2017).
28. H. Tveiten, Temperature influence on reproductive development and gamete quality in Atlantic cod (Gadus morhua). Cybium 32, 195–195 (2008).
29. J. M. Donelson, S. Salinas, P. L. Munday, L. N. S. Shama, Transgenerational plasticity and climate change experiments: Where do we go from here? Glob. Chang. Biol. 24, 13–34 (2017).
30. S. Danilov, D. Sidorenko, Q. Wang, T. Jung, The Finite-volumE Sea ice-Ocean Model (FESOM2). Geosci. Model Dev. 10, 765–789 (2017).
31. A. E. Raftery, A. Zimmer, D. M. W. Frierson, R. Startz, P. Liu, Less than 2° C warming by 2100 unlikely. Nat. Clim. Chang. 7, 637–641 (2017).
32. J. A. Brown, G. Minkoff, V. Puvanendran, Larviculture of Atlantic cod (Gadus morhua):
Progress, protocols and problems. Aquaculture 227, 357–372 (2003).
33. K. Brander, Spawning and life history information for North Atlantic cod stocks, ICES Cooperative Research Report (2005).
34. P. Hari, J. Pumpanen, J. Huotari, P. Kolari, J. Grace, T. Vesala, A. Ojala, High‐frequency measurements of productivity of planktonic algae using rugged nondispersive infrared carbon dioxide probes. Limnol. Oceanogr. Methods 6, 347–354 (2008).
35. J. F. Waters, F. J. Millero, The free proton concentration scale for seawater pH. Mar. Chem.
149, 8–22 (2013).
36. A. G. Dickson, C. L. Sabine, J. R. Christian, Guide to Best Practices for Ocean CO2
Measurements (North Pacific Marine Science Organization, 2007).
37. D. Bates, M. Mächler, B. Bolker, S. Walker, Fitting linear mixed-effects models using lme4;
arXiv:1406.5823 (2014).
38. R. V. Lenth, Least-squares means: The R package lsmeans. J. Stat. Softw. 69, 1–33 (2016).
39. S. Wood, M. S. Wood, Package ‘mgcv’. R package version, 1.7-29 (2017).
40. A. C. Niehaus, M. J. Angilletta Jr., M. W. Sears, C. E. Franklin, R. S. Wilson, Predicting the physiological performance of ectotherms in fluctuating thermal environments.
J. Exp. Biol. 215, 694–701 (2012).
41. P. F. Valerio, S. V. Goddard, M. H. Kao, G. L. Fletcher, Survival of northern Atlantic cod (Gadus morhua) eggs and larvae when exposed to ice and low temperature.
Can. J. Fish. Aquat. Sci. 49, 2588–2595 (1992).
42. P. A. Cziko, C. W. Evans, C.-H. C. Cheng, A. L. DeVries, Freezing resistance of antifreeze-deficient larval Antarctic fish. J. Exp. Biol. 209, 407–420 (2006).
43. R. A. Locarnini, A. V. Mishonov, J. I. Antonov, T. P. Boyer, H. E. Garcia, O. K. Baranova, M. M. Zweng, C. R. Paver, J. R. Reagan, D. R. Johnson, M. Hamilton, D. Seidov, World Ocean Atlas 2013 (NOAA, 2013), vol. 1, pp. 73–44.
44. N. Rayner, D. E. Parker, E. B. Horton, C. K. Folland, L. V. Alexander, D. P. Rowell, E. C. Kent, A. Kaplan, Global analyses of sea surface temperature, sea ice, and night marine air temperature since the late nineteenth century. J. Geophys. Res. Atmos. 108, 4407 (2003).
45. R. M. Key, A. Olsen, S. van Heuven, S. K. Lauvset, A. Velo, X. Lin, C. Schirnick, A. Kozyr, T. Tanhua, M. Hoppema, S. Jutterström, R. Steinfeldt, E. Jeansson, M. Ishi, F. F. Perez, T. Suzuki, Global Ocean Data Analysis Project, Version 2 (GLODAPv2), ORNL/CDIAC-162, NDP-P093 (Carbon Dioxide Information Analysis Center, Oak Ridge National Laboratory, US Department of Energy, 2015).
46. S. K. Lauvset, R. M. Key, F. F. Perez, A new global interior ocean mapped climatology:
The 1°× 1° GLODAP version 2. Earth Syst. Sci. Data 8, 325–340 (2016).
47. D. P. Van Vuuren, J. Edmonds, M. Kainuma, K. Riahi, A. Thomson, K. Hibbard, G. C. Hurtt, T. Kram, V. Krey, J.-F. Lamarque, T. Masui, M. Meinshausen, N. Nakicenovic, S. J. Smith, S. K. Rose, The representative concentration pathways: An overview. Clim. Change 109, 5 (2011).
48. V. K. Arora, J. F. Scinocca, G. J. Boer, J. R. Christian, K. L. Denman, G. M. Flato, V. V. Kharin, W. G. Lee, W. J. Merryfield, Carbon emission limits required to satisfy future representative concentration pathways of greenhouse gases. Geophys. Res. Lett. 38, L05805 (2011).
49. J. P. Dunne, J. G. John, A. J. Adcroft, S. M. Griffies, R. W. Hallberg, E. Shevliakova, R. J. Stouffer, W. Cooke, K. A. Dunne, M. J. Harrison, J. P. Krasting, S. L. Malyshev, P. C. D. Milly, P. J. Phillipps, L. T. Sentman, B. L. Samuels, M. J. Spelman, M. Winton, A. T. Wittenberg, N. Zadeh, GFDL’s ESM2 Global coupled climate–carbon Earth System Models. Part I: Physical formulation and baseline simulation characteristics.
J. Climate 25, 6646–6665 (2012).
50. J. P. Dunne, J. G. John, E. Shevliakova, R. J. Stoluffer, J. P. Krasting, S. L. Malyshev, P. C. D. Milly, L. T. Sentman, A. J. Adcroft, W. Cooke, K. A. Dunne, S. M. Griffies, R. W. Hallberg, M. J. Harrison, H. Levy, A. T. Wittenberg, P. J. Phillips, N. Zadeh, GFDL’s ESM2 global coupled climate–Carbon earth system models. Part II: Carbon system formulation and baseline simulation characteristics. J. Climate 26, 2247–2267 (2013).
51. J.-L. Dufresne, M.-A. Foujols, S. Denvil, A. Caubel, O. Marti, O. Aumont, Y. Balkanski, S. Bekki, H. Bellenger, R. Benshila, S. Bony, L. Bopp, P. Braconnot, P. Brockmann, P. Cadule, F. Cheruy, F. Codron, A. Cozic, D. Cugnet, N. de Noblet, J.-P. Duvel, C. Ethé, L. Fairhead, T. Fichefet, S. Flavoni, P. Friedlingstein, J.-Y. Grandpeix, L. Guez, E. Guilyardi,
on January 22, 2019http://advances.sciencemag.org/Downloaded from
D. Hauglustaine, F. Hourdin, A. Idelkadi, J. Ghattas, S. Joussaume, M. Kageyama, G. Krinner, S. Labetoulle, A. Lahellec, M.-P. Lefebvre, F. Lefevre, C. Levy, Z. X. Li, J. Lloyd, F. Lott, G. Madec, M. Mancip, M. Marchand, S. Masson, Y. Meurdesoif, J. Mignot, I. Musat, S. Parouty, J. Polcher, C. Rio, M. Schulz, D. Swingedouw, S. Szopa, C. Talandier, P. Terray, N. Viovy, N. Vuichard, Climate change projections using the IPSL-CM5 Earth System Model: From CMIP3 to CMIP5. Climate Dynam. 40, 2123–2165 (2013).
52. S. Watanabe, T. Hajima, K. Sudo, T. Nagashima, T. Takemura, H. Okajima, T. Nozawa, H. Kawase, M. Abe, T. Yokohata, T. Ise, H. Sato, E. Kato, K. Takata, S. Emori, M. Kawamiya, MIROC-ESM 2010: Model description and basic results of CMIP5-20c3m experiments.
Geosci. Model Dev. 4, 845–872 (2011).
53. M. A. Giorgetta, J. Jungclaus, C. H. Reick, S. Legutke, J. Bader, M. Böttinger, V. Brovkin, T. Crueger, M. Esch, K. Fieg, K. Glushak, V. Gayler, H. Haak, H.-D. Hollweg, T. Ilyina, S. Kinne, L. Kornblueh, D. Matei, T. Mauritsen, U. Mikolajewicz, W. Mueller, D. Notz, F. Pithan, T. Raddatz, S. Rast, R. Redler, E. Roeckner, H. Schmidt, R. Schnur, J. Segschneider, K. D. Six, M. Stockhause, C. Timmreck, J. Wegner, H. Widmann, K.-H. Wieners, M. Claussen, J. Marotzke, B. Stevens, Climate and carbon cycle changes from 1850 to 2100 in MPI-ESM simulations for the Coupled Model Intercomparison Project phase 5. J. Adv. Model.
Earth Syst. 5, 572–597 (2013).
54. M. Bentsen, I. Bethke, J. B. Debernard, T. Iversen, A. Kirkevåg, Ø. Seland, H. Drange, C. Roelandt, I. A. Seierstad, C. Hoose, J. E. Kristjánsson, The Norwegian Earth System Model, NorESM1-M—Part 1: Description and basic evaluation of the physical climate.
Geosci. Model Dev. 6, 687–720 (2013).
55. T. Iversen, M. Bentsen, I. Bethke, J. B. Debernard, A. Kirkevåg, Ø. Seland, The Norwegian Earth System Model, NorESM1-M—Part 2: Open Climate response and scenario projections. Geosci. Model Dev. 6, 389–415 (2013).
Acknowledgments: We acknowledge the support of S. Hardenberg, E. Leo, M. Stiasny, C. Clemmensen, G. Göttler, F. Mark, and C. Bridges. Special thanks are dedicated to the staff of the Tromsø Aquaculture Research Station and the Centre for Marine Aquaculture. Funding:
Funding was received from the research program BIOACID [Biological Impacts of Ocean Acidification by the German Federal Ministry of Education and Research (BMBF), FKZ 03F0655B to H.-O.P. and FKZ 03F0728B to D.S.]. Funding was also received from AQUAculture infrastructures for EXCELlence in European fish research (AQUAEXCEL, TNA 0092/06/08/21 to D.S.). F.T.D., M.B., H.-O.P., and D.S. were supported by the PACES (Polar Regions and Coasts in a Changing Earth System) program of the Alfred Wegener Institute, Helmholtz Centre for Polar and Marine Research (AWI). Previous and additional support from grants POLARIZATION (Norwegian Research Council grant no. 214184 to J.N.) and METAFISCH (BMBF grant no. FZK01LS1604A to H.-O.P. and F.T.D.) are also acknowledged. Author contributions: F.T.D.
and D.S. devised the study and designed the experiments. F.T.D. conducted the experiments.
J.N., V.P., and A.M. provided equipment and facility infrastructure. F.T.D. analyzed the experimental data. M.B. analyzed climate data and generated habitat maps. F.T.D. drafted the manuscript. F.T.D., D.S., M.B., and H.-O.P. wrote the manuscript. J.N., V.P., and A.M. edited the manuscript. Competing interests: The authors declare that they have no competing interests.
Data and materials availability: All data needed to evaluate the conclusions in the paper are present in the paper and/or the Supplementary Materials. Additional data related to this paper may be requested from the authors. The experimental data supporting the findings of this study are available from PANGEA (https://doi.org/10.1594/PANGAEA.868126), a member of the ICSU World Data System.
Submitted 30 December 2017 Accepted 30 October 2018 Published 28 November 2018 10.1126/sciadv.aas8821
Citation: F. T. Dahlke, M. Butzin, J. Nahrgang, V. Puvanendran, A. Mortensen, H.-O. Pörtner, D. Storch, Northern cod species face spawning habitat losses if global warming exceeds 1.5°C.
Sci. Adv. 4, eaas8821 (2018).
on January 22, 2019http://advances.sciencemag.org/Downloaded from
DOI: 10.1126/sciadv.aas8821 (11), eaas8821.
4 Sci Adv
ARTICLE TOOLS http://advances.sciencemag.org/content/4/11/eaas8821
MATERIALS
SUPPLEMENTARY http://advances.sciencemag.org/content/suppl/2018/11/26/4.11.eaas8821.DC1
REFERENCES
http://advances.sciencemag.org/content/4/11/eaas8821#BIBL This article cites 43 articles, 6 of which you can access for free
PERMISSIONS http://www.sciencemag.org/help/reprints-and-permissions
Terms of Service Use of this article is subject to the
registered trademark of AAAS.
is a Science Advances Association for the Advancement of Science. No claim to original U.S. Government Works. The title
York Avenue NW, Washington, DC 20005. 2017 © The Authors, some rights reserved; exclusive licensee American (ISSN 2375-2548) is published by the American Association for the Advancement of Science, 1200 New Science Advances
on January 22, 2019http://advances.sciencemag.org/Downloaded from