General rights
Copyright and moral rights for the publications made accessible in the public portal are retained by the authors and/or other copyright owners and it is a condition of accessing publications that users recognise and abide by the legal requirements associated with these rights.
Users may download and print one copy of any publication from the public portal for the purpose of private study or research.
You may not further distribute the material or use it for any profit-making activity or commercial gain
You may freely distribute the URL identifying the publication in the public portal
If you believe that this document breaches copyright please contact us providing details, and we will remove access to the work immediately and investigate your claim.
Downloaded from orbit.dtu.dk on: Mai 10, 2021
Designing spawning closures can be complicated: Experience from cod in the Baltic Sea
Eero, Margit; Hinrichsen, Hans-Harald; Hjelm, Joakim; Huwer, Bastian; Hüssy, Karin; Köster, Friedrich W.; Margonski, Piotr; Plikshs, Maris; Storr-Paulsen, Marie; Zimmermann, Christopher
Published in:
Ocean & Coastal Management
Link to article, DOI:
10.1016/j.ocecoaman.2018.12.018
Publication date:
2019
Document Version Peer reviewed version Link back to DTU Orbit
Citation (APA):
Eero, M., Hinrichsen, H-H., Hjelm, J., Huwer, B., Hüssy, K., Köster, F. W., Margonski, P., Plikshs, M., Storr- Paulsen, M., & Zimmermann, C. (2019). Designing spawning closures can be complicated: Experience from cod in the Baltic Sea. Ocean & Coastal Management, 169, 129-136.
https://doi.org/10.1016/j.ocecoaman.2018.12.018
Designing spawning closures can be complicated: experience from cod in the Baltic Sea 1
Margit Eero1*, Hans-Harald Hinrichsen2, Joakim Hjelm3, Bastian Huwer1, Karin Hüssy1, 2
Friedrich W. Köster1, Piotr Margonski4, Maris Plikshs5, Marie Storr-Paulsen1, Christopher 3
Zimmermann6 4
1Technical University of Denmark, National Institute for Aquatic Resources, Kemitorvet 5
202, DK-2800 Kgs. Lyngby, Denmark 6
2GEOMAR Helmholtz Centre for Ocean Research Kiel, Düsternbrooker Weg 20, 24105 Kiel, 7
Germany 8
3Swedish University of Agricultural Sciences, Department of Aquatic Resources, Institute of Marine 9
Research, 453 30 Lysekil, Sweden 10
4National Marine Fisheries Research Institute, Kollataja 1,81-332 Gdynia, Poland 11
5Institute of Food Safety, Animal Health and Environment, Fish Resources Research Department, 12
Daugavgrivas 8, LV-1048 Riga, Latvia 13
6Thünen Institute of Baltic Sea Fisheries, Alter Hafen Süd 2, DE-18069 Rostock, Germany 14
*Corresponding author: tel: +45 3588 3318; fax: +45 3588 3333; email: mee@aqua.dtu.dk 15
16
Abstract 17
Fisheries management measures often include spatio-temporal closures during the spawning 18
period of the fish with an overarching aim of improving the stock status. The different 19
mechanisms how a spawning closure potentially can influence the stock are often not 20
explicitly considered when designing such closures. In this paper, we review and synthesize 21
the available data and knowledge on potential effects of the implemented spawning closures 22
on cod in the Baltic Sea. The Baltic cod example represents a relatively data rich case, which 23
allows demonstrating how a closure might affect different parameters of stock status via 24
different mechanisms, including potential unintended negative effects. We conclude that 25
designing relatively small area closures appropriately is highly complex and data demanding, 26
and may involve tradeoffs between positive and negative impacts on the stock. Seasonal 27
closures covering most of the stock distribution during the spawning time are more robust to 28
data limitations, and less likely to be counterproductive if suboptimally designed.
29
30
Key words: spawning closure, fisheries management, recruitment, stock structure, Baltic cod 31
32
1. Introduction 33
Fisheries management measures frequently include spatio-temporal closures as a supplement 34
to catch or effort limitations and gear regulations (Murawski et al., 2000; Roberts et al., 35
2005). The Marine Protected Area (MPA) type of closures, where fishing activities are 36
restricted or forbidden all year round generally have a wider aim of preserving biodiversity 37
and meeting various nature conservation objectives (Halpern, 2003; Lester et al., 2009). To 38
enhance a particular fish stock, seasonal closures during the spawning time of the population 39
in concern are often used, the so-called spawning closures. There are numerous studies and 40
ongoing debates on the effects of MPAs (e.g., Pendleton et al., 2017), while spawning 41
closures and related benefits to fish stocks have received comparatively less attention in the 42
literature so far.
43
44
Spawning closures can reduce overall fishing mortality of target species, especially when 45
these are forming large spawning aggregations (Russell et al., 2012; Grüss et al., 2014). In 46
case of no targeted fishery for a particular stock, spawning closures could reduce bycatch 47
(O’Keefe et al., 2014). For fish stocks, where the overall fishing mortality is regulated by 48
other measures, such as total allowable catch (TAC), the benefits from spawning closures are 49
suggested to include greater reproductive output, positive effects on stock structure and 50
reduced evolutionary effects of fishing (van Overzee and Rijnsdorp, 2015 and references 51
therein). However, such effects are often difficult to demonstrate convincingly, and are 52
possibly case specific. Therefore, case specific monitoring and evaluation of the established 53
closures are needed as part of a management process to allow for possible adaptations as well 54
as communication of their effectiveness (Pomeroy et al., 2005).
55 56
In this paper, we synthesize the state-of-the-art scientific knowledge on possible effects of the 57
established spawning closures on cod in the Baltic Sea. We are specifically interested in 58
distinguishing between different mechanisms how a spawning closure potentially could affect 59
the cod. The Baltic cod provides a relatively data rich example, allowing to identify tradeoffs 60
that may be involved when a spawning closure affects various aspects of the stock status via 61
different mechanisms. Furthermore, different types of spawning closures are implemented in 62
the Baltic Sea. Therefore, the Baltic cod example allows us addressing their relative 63
advantages, especially in situations when scientific knowledge is limited, which may partly be 64
the case even for stocks generally considered as data-rich. The present study is intended to 65
guide future monitoring and research efforts as well as inform debates and decisions on the 66
design and use of spawning closures in fisheries management in the Baltic Sea and elsewhere.
67
68
2. Background of cod stocks and fisheries management measures in the Baltic Sea 69
There are two genetically distinct populations of cod (Gahus morhua) in the Baltic Sea, 70
eastern (EB) and western (WB) (Nielsen et al., 2003; 2005). Since 2004, these are managed in 71
two separate areas, corresponding to the International Council for the Exploration of the Sea 72
(ICES) Subdivisions (SD) 25–32 and 22–24, respectively (Fig. 1). Both the EB and WB cod 73
occur in SD 24 (Hüssy et al., 2016). Cod in the Baltic Sea is a target species for fisheries with 74
demersal trawls and gill-nets, and managed by total allowable catch (TAC). Technical 75
measures including various regulations on fishing gears and a minimum conservation 76
reference size are in place.
77 78
The EB cod biomass was record high in the 1970s–1980s, after which it substantially declined 79
due to a combination of unfavourable environmental conditions for reproduction and a high 80
fishing pressure (Bagge et al., 1994). In recent decade, fishing mortality is estimated 81
substantially lower, though is presently considered still above the management target and the 82
stock size has declined after a small recovery observed in the late 2000s (ICES, 2018a). The 83
fishing mortality of WB cod is estimated well above the management target in the entire time 84
series and the spawner biomass has been below the reference level since 2009, though is 85
predicted to increase in coming years (ICES, 2018a).
86 87
In 1995, a few years after the major decline of the EB cod stock in the late 1980s, a 88
prohibition to fish cod from June to August in the EB Sea was introduced (IBSFC, 1994). In 89
1998, additionally an area closure for all fishing activities was established in the essential cod 90
spawning area in the Bornholm Basin (BB) (Fig. 1) in the period from mid-May to the end of 91
August. In the following decade, the timing of these closures as well as the size and shape of 92
the area closure in the BB were modified several times. These changes were not based on a 93
well-defined biological mechanism and it is unclear how these closures were expected to 94
contribute to rebuilding of the stock (Suuronen et al., 2010). In 2006, additional area closures 95
were established in the Gdansk Deep (GD) and Gotland Basin (GB) (Fig. 1). In the first EU 96
management plan for cod (EU, 2007), effort limitation in the EB Sea included a prohibition of 97
all cod fisheries from July 1 to August 31, from here on referred to as a seasonal closure.
98
Additionally, the plan included a prohibition of any fishing activities in the three designated 99
areas (Fig. 1) from May 1 to October 31, which are referred to as area closures. In the WB 100
Sea, a seasonal closure was in effect from April 1 to 30. In the new EU Baltic multi-annual 101
management plan (Baltic MAP) (EU, 2016), seasonal closures in both the EB and WB Sea 102
were lifted, while the area closures in the EB Sea were maintained (Table 1). According to the 103
Baltic MAP, supplementary measures need to be applied when the stocks are in poor state, 104
which can include spawning closures (EU, 2016). In practice, a seasonal closure from 105
February 15 to March 31 was implemented in the WB Sea in 2016, further extended to 106
February 1– March 31 in 2017–2018 (Table 1). In the EB Sea, a seasonal closure in SDs 25–
107
26 was re-introduced for 2018. There are exemptions in place for vessels <15 m (in 2017 in 108
WB) or <12 m (in 2018 in EB and WB) if they can demonstrate that they do not fish for cod 109
in areas deeper than 20 m.
110 111
Table 1. Overview of the seasonal (SC) and area closures (AC) for cod fisheries enforced in 112
the Eastern Baltic (EB) and Western Baltic (WB) management areas under the present EU 113
management plan (EU, 2016). See Fig. 1 for location of the area closures in Bornholm Basin 114
(BB), Gdansk Deep (GD) and Gotland Basin (GB).
115 116
EB management area WB management area
2016–2018:
AC: May 1–October 31 (BB, GD, GB) 2018:
SC: July1–August 31 (SDs 25–26)
2016:
SC: February 15–March 31 (SD 22–24) 2017–2018:
SC: February 1 –March 31 (SD 22–24) 117
3. Material and Methods 118
119
3.1 Defining potential objectives for the cod spawning closures in the Baltic Sea 120
The overarching aim of the cod spawning closures in the Baltic Sea is improving the stock 121
status. The legislations do not specify further, which parameters of stock status the closures 122
are intended to improve, and through which mechanisms. According to the literature, potential 123
benefits of spawning closures as a supplementary management measure can include greater 124
reproductive output, positive effects on stock structure, reduced evolutionary effects of fishing 125
and reduced impact on spawning habitat (e.g. van Overzee and Rijnsdorp, 2015 and 126
references therein). We focused our analyses on the potential effects of the spawning closures 127
on cod recruitment, distinguishing between three different mechanisms. These included direct 128
effects of the closures on:
129
i) the quantity and quality of egg production by ensuring undisturbed spawning 130
activity;
131
ii) preserving the spawners whose offspring have a higher survival probability;
132
iii) increasing the proportion of larger/older individuals in the stock.
133
Further explanation of how the cod recruitment could benefit from these potential effects of 134
spawning closures is provided in section 4. We focus on these selected potential effects of the 135
closures because of their relevance for the Baltic cod and the availability of scientific 136
information, which allows for their relatively in-depth consideration. Hence, improving cod 137
recruitment through the three mechanisms described above was used as a specific objective 138
for the Baltic cod spawning closures in this study.
139
140
Concerning other potential benefits of spawning closures suggested in the literature, such as 141
avoiding evolutionary change towards earlier maturation or reducing the risk of losing genetic 142
diversity (van Overzee and Rijnsdorp, 2015), little information is available for Baltic cod.
143
Size at maturation of the EB cod has substantially declined from the late 1990s to 2010s 144
(Köster et al., 2017), when spawning closures have been enforced. This change is not fully 145
understood, though is not considered to be connected to the spawning closures, which should 146
have an opposite effect, i.e. preventing earlier maturation. Both the EB and WB cod have 147
different spawning locations in the Baltic Sea, however genetic differences between those 148
within a stock have not been demonstrated (Nielsen et al., 2003; 2005; Poćwierz-Kotus et al., 149
2015). Spawning site fidelity on a finer spatial scale occurs in some cod stocks (e.g., Zemekis 150
et al., 2014). Such aspects as well as related potential impacts of spawning closures are 151
largely unknown for Baltic cod.
152 153 154 155
3.2 Evaluation approach 156
The effects of spawning closures on wild fish stocks are generally very difficult to 157
demonstrate or quantify (e.g., Arendse et al., 2007; Clarke et al., 2015). This is because of a 158
large number of factors and processes influencing fish stock dynamics, for example 159
recruitment, including that of cod in the Baltic Sea (Köster et al., 2017). The approach of 160
looking at stock parameters before and after the implementation of closures is frequently 161
applied (e.g., Russ et al., 2004; Torres-Irineo et al., 2011), however is challenged by other 162
factors influencing the stock dynamics at the same time (Davies et al., 2017). Comparable 163
control areas or seasons are often not available or meaningful, which is also the case for cod 164
in the Baltic Sea.
165 166
Recognizing this general difficulty in assessing the realized effects of spawning closures, we 167
took a different approach in this study, where we instead evaluated their potential effects. In 168
this approach, we focused on identifying whether or not there is an overlap between the 169
closure and the stock component intended to be protected, in time and space. If such overlap 170
is lacking, the closure can impossibly be beneficial. If the overlap is present, this implies that 171
the closure can potentially contribute to improving the stock status through a certain 172
mechanism. Corresponding to the three potential effects of the spawning closures we address 173
in this paper, we evaluated whether there is an overlap between 174
• the closures and the cod spawning activity, 175
• the closures and the spawners whose offspring has a higher survival probability, 176
• the closures and the largest/oldest cod.
177 178
We evaluated potential both positive and negative effects of the closures. The latter were 179
associated with the possibility of fishing effort reallocation during the time of closure, 180
compromising some aspects of the stock status. Both the area and seasonal closures enforced 181
under the present EU management plan (EU, 2016) were considered (Table 1), separately for 182
the EB and WB management areas. Our study does not cover the economic and social 183
implications, or other possible ecological effects of the closures on other species or habitats.
184 185
3.3 Data 186
A number of scientific publications over the past decades have addressed cod recruitment in 187
the Baltic Sea, including aspects relevant for evaluating the spawning closures. This paper 188
presents a synthesis of these findings in the context of the specific questions regarding the 189
potential effects of the spawning closures, defined in the sections above. This review is 190
supplemented by additional analyses, using data on egg abundances from ichthyoplankton 191
surveys and cod catch information from the Baltic fish stock Assessment Working Group in 192
ICES (ICES, 2018a). For the EB cod, part of the present synthesis was conducted in 193
connection with a workshop in ICES (2018b).
194
195
4. Results 196
4.1 Undisturbed spawning 197
Fishing activities may adversely affect the spawning fish and subsequently the quantity or 198
quality of the offspring (Sadovy de Mitcheson and Erisman, 2012). The disturbance can take 199
place via a number of mechanisms, including noise from fishing and interruption of 200
spawning, causing physiological stress response in the fish and disturbance of natural 201
spawning behaviour (van Overzee and Rijnsdorp, 2015). The effect of spawning disturbance 202
on reproductive output is very difficult to demonstrate or quantify for wild fish stocks, and no 203
such investigations are available for Baltic cod. A pre-requisite for a closure to ensure 204
undisturbed spawning is a spatio-temporal overlap with spawning activity, which is the only 205
aspect in relation to spawning disturbance that can presently be evaluated for Baltic cod.
206
207
EB: In the EB Sea, there are historically three main cod spawning grounds, in deeper areas of 208
the Bornholm Basin (BB), Gdansk Deep (GD) and Gotland Basin (GB) (Fig. 1). Due to 209
reduced salinity and oxygen, conditions for cod egg survival in GD and GB have deteriorated 210
considerably since the mid-1980s (MacKenzie et al., 2000; Köster et al., 2009), and these 211
spawning areas have presently a limited contribution to cod recruitment (Plikshs et al., 2015;
212
Köster et al., 2017). Therefore, disturbance from fishing in these areas unlikely has a 213
measurable effect on the reproductive output of the stock. In the BB, i.e. presently the main 214
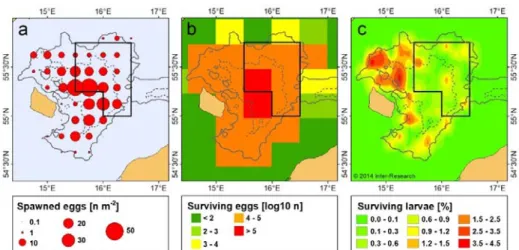
spawning ground for the EB cod, spawning is restricted to areas with water depth >60 m 215
(Wieland, 1988; Hinrichsen et al., 2007; Figure 2a). The horizontal distribution of eggs within 216
the spawning area varies between years as well as within a year (Hinrichsen et al., 2007;
217
Neumann et al., 2014; Fig. S1). Thus, the area closure in the BB covers varying proportions 218
of the spawning activity, while not covering the entire spawning area.
219
220
The spawning of the EB cod starts in February–March and last until October–November 221
(Wieland et al., 2000). Peak spawning occurred between the end of April and mid-June in the 222
1970s and 1980s (MacKenzie et al., 1996), and gradually changed to the second half of July 223
during the 1990s (Wieland et al., 2000). In the late 2000s, the main spawning expanded to 224
spring, covering a 4 months period from May to August (Neumann et al., 2014; Köster et al., 225
2017). In most years since 2010, highest egg abundances have been recorded in June (ICES, 226
2018b), which is not covered by the seasonal closure enforced in July–August.
227 228
WB: WB cod spawn in areas deeper than 20 m in Kiel Bay, Mecklenburg Bay, and the 229
Danish Belts (SD 22; Fig. 1) (Bleil and Oeberst, 2002; Hüssy, 2011). Cod spawning activities 230
are also recorded in the Sound (SD 23) (Hüssy, 2011). Both the WB and EB cod spawn in the 231
Arkona Basin (AB) (in SD 24) (Bleil et al., 2009; Hüssy, 2011), in areas with water depth >40 232
m (Fig. 1) (Bleil and Oeberst, 2002). The main spawning period of female repeat spawning 233
cod in SD 22 (the core spawning area of the WB stock) is from mid-February to early April, 234
matching the timing of the seasonal closure implemented in this area in 2016–2018 (STECF, 235
2016). In the AB, the timing of cod spawning reflects a combination of different spawning 236
times of the WB and EB stock, which are mixed in the area.
237 238
239
Fig. 1. Cod spawning areas (filled areas on the map) in the Baltic Sea in the Sound (23), Kiel 240
Bay (KB), Mecklenburg Bay (MB), Arkona Basin (AB) and Bornholm Basin (BB); the 241
shaded areas in Gdansk Deep (GD) and Gotland Basin (GB) indicate spawning areas that 242
have had limited contribution to cod recruitment since the mid-1980s (modified from Bagge 243
et al., 1994 and Hüssy, 2011) . The bold lines show the borders of the present area closures in 244
the eastern Baltic Sea (EU, 2016), with the broken lines indicating historical borders for the 245
closure in BB. The numbers and thin lines depict the ICES Subdivisions (SD).
246
247
4.2 Early life stage survival 248
The effect of undisturbed spawning on reproductive output needs to be seen in conjunction 249
with survival probability of the offspring, as high egg production alone is not sufficient for 250
enhancing recruitment. If the survival of early life stages is variable in time and space, 251
spawning closures could potentially enhance the recruitment by protecting those spawners 252
whose offspring has a higher survival probability.
253 254
EB: The survival of cod eggs in the GD and GB has been low since the 1990s, due to 255
unfavourable salinity and oxygen conditions (Köster et al., 2017). Therefore, we focus this 256
section on the BB, where hydrographic conditions generally support relatively high egg 257
survival in the months and areas covered by both the seasonal and area closure. However, the 258
closures do not cover the entire window of high egg survival probability. Modelling of egg 259
survival has shown that, on average, the highest concentrations of surviving eggs originate 260
from the center of the basin (Fig. 2b), with the highest survival probability in May–August 261
(Hinrichsen et al. 2016a).
262 263
The survival of first feeding larvae, which is critical for determining recruitment success of 264
the EB cod (Köster et al., 2005; Huwer et al., 2011) is largely affected by prey availability, in 265
particular Pseudocalanus nauplii (Hinrichsen et al., 2002; Voss et al., 2003). A modelling 266
study suggests that, at favourable feeding conditions, larval survival is highest in the center of 267
the basin (Hinrichsen et al., 2002), i.e. including the area closure in the BB. In contrast, in 268
years with low Pseudocalanus abundance, larvae have better feeding opportunities and a 269
higher survival probability if retained at the slopes of the basin or transported into shallower 270
coastal regions, i.e. outside the area closure (Hinrichsen et al., 2002). This modelling result 271
was confirmed by an empirical study back-tracking hatch positions of pelagic juvenile 272
survivors in year 2000, which revealed that the vast majority of these juveniles originated 273
from the slopes of the BB, i.e. outside the closed area (Huwer et al., 2014; Fig. 2c). It should 274
be noted that the absolute numbers of recruits originating from different time windows or 275
locations have not been quantified, as this would require more extensive and systematic 276
sampling of juveniles than is currently the case.
277 278
279
Fig. 2. EB cod in the Bornholm Basin: (a) Horizontal distribution of newly spawned cod eggs 280
(stage 1A), representing the location of spawning activity (average for the years 1989–2003, 281
from Hinrichsen et al., 2007). (b) Modelled spatial origin of first-feeding yolk-sac larvae that 282
have survived through the egg stage (average in 1971–2010, from Hinrichsen et al., 2016a).
283
(c) Spatial origin of pelagic juveniles that have survived through the larval stage, (example for 284
the year 2000, from Huwer et al., 2014). The grey lines show 60 m (solid) and 80 m (dashed) 285
depth contours. The black solid box shows the extent of the present area closure (EU, 2016).
286 287
WB: The survival of WB cod eggs is affected by temperature (see Hüssy 2011 for review), 288
which is more likely to be below the optimum (in the range of 4–8 ˚C) early in the spawning 289
season, including the time of the present closure. However, no clear relation between 290
temperature and year-class strength suggests that other factors are likely more important for 291
determining recruitment success (Hüssy et al., 2012). The egg quality (size, fertilization 292
success) as well as the number of eggs per batch decrease towards the end of spawning of an 293
individual cod (Bleil and Oeberst, 1998; Vallin and Nissling, 2000). Thus, the eggs with the 294
best quality characteristics, which may influence their survival probability, are released within 295
the period covered by the closures in 2016–2018. In terms of the spatial coverage, a closure in 296
SD 24 has likely a limited contribution to enhancing the WB cod recruitment. This is due to 297
generally low egg survival in this area related to cold winter water filling the basin during the 298
main spawning time of the WB cod (Köster et al., 2017). During the 2000s, the environmental 299
conditions for reproduction in the AB were generally more favourable for the EB than for the 300
WB cod (Köster et al., 2017), with best spawning conditions irregularly occurring from mid- 301
May to end-June (STECF, 2010; Hüssy et al., 2016).
302
303
4.3 Size/age structure of cod catches 304
305
Larger female cod produce higher number of eggs, and there is evidence for increased 306
offspring quality with parent age or reproductive experience (e.g., Marteinsdottir and 307
Steinarsson, 1998; Trippel, 1998). Moreover, the on average larger eggs of larger cod are 308
neutrally buoyant at a lower salinity, implying that the eggs from older/larger EB cod have a 309
greater survival probability under low salinity conditions (Vallin and Nissling 2000;
310
Hinrichsen et al., 2016b). The size distribution of the EB cod stock has truncated in later 311
years, with very few larger individuals in the stock (ICES, 2018a). Thus, protecting the 312
remaining relatively larger cod may be essentially important. If fisheries catches during the 313
spawning time contain a larger fraction of older/larger individuals than in other times of the 314
year, a spawning closure could be beneficial for the recruitment success by preserving larger 315
cod. When investigating this hypothesis, we assumed that the total annual catch amount is 316
unchanged regardless of the closures and we only focused on the potential effect of the 317
closures on the size/age structure of the catch.
318 319
EB: Data on the amount and size structure of cod landings are available by quarter (q) and 320
ICES SDs in the Baltic Sea. Age information in not available for the EB cod for later years.
321
Seasonally, the fraction of the larger (>45 cm) EB cod in fisheries catch has generally been 322
highest in q3, although similar to q4 (Fig. 3a). However, the amount of cod landings in q3 has 323
been relatively low throughout the time series, i.e. including the years before the 324
implementation of the seasonal closure in 1995 (Fig. S2). This is likely due to low incentives 325
for cod fishery in this time of the year, regardless of the closure. Thus, the seasonal summer 326
closure may to some extent reduce the fraction of the largest individuals in fisheries catch, 327
though the effect is likely not substantial.
328
329
Spatially, the catches in SD 26 include a higher proportion of larger cod compared to SD 25 330
(Fig. 3b). There is some variability in this pattern between quarters (Fig. S3). However, the 331
fraction of the largest cod in fisheries catch in the main spawning area (in SD 25) does not 332
seem to be higher in any time of the year. The importance of SD 26 in total EB cod landings 333
has substantially increased in later years (Fig. S4), in line with the relatively larger cod found 334
in this area, making it more attractive for the fisheries. Finer scale spatial data on the 335
distribution of different size-groups of cod within a SD during the time of the closures are not 336
available. This is because research surveys are conducted in the 1st and 4th quarters, i.e.
337
outside the main spawning time, and data on size composition of the fisheries catch are only 338
available on a SD level.
339 340
341
Fig. 3. Average proportion of larger eastern Baltic cod (>45 cm in length) in the commercial 342
catch (a) by quarter and (b) in SDs 25 and 26 (annual average). The error bars represent 343
standard error of the mean, calculated over the years 2001–2017.
344
345
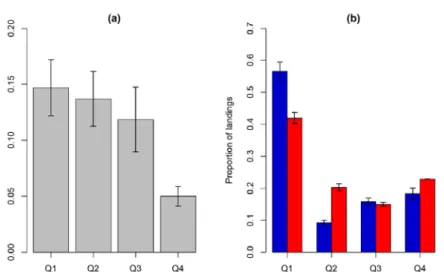
WB: The proportion of older WB cod in fisheries landings has been highest during the main 346
spawning season in q1, although similar to q2 (Fig. 4a). Thus, a fishery closure in q1 could 347
potentially reduce the proportion of the largest cod in fisheries catch. However, despite the 348
spawning closure being enforced in q1, a substantial share of the landings in 2016–2017 was 349
still taken in the period when the highest fraction of older cod occurs in the landings, i.e. in 350
the remainder of q1 and in q2 (Fig. 4b). This suggests that the spawning closure likely did not 351
reduce the proportion of larger cod in fisheries catch in those years substantially.
352
353
354
Figure 4. (a) Average proportion of cod at age 5+ in the landings of Western Baltic cod in 355
ICES Subdivisions 22–23, by quarter (Q). The error bars represent standard error of the mean, 356
calculated over the years 2005–2017. (b) Average relative distribution of cod landings 357
between quarters in 2005–2015 (blue bars) compared to 2016–2017 (red bars). The distinction 358
of the periods corresponds to revision of the time of the closure. Error bars show standard 359
error of the mean.
360 361
4.4 Possible tradeoffs between the different impacts of the spawning closures on cod 362
363
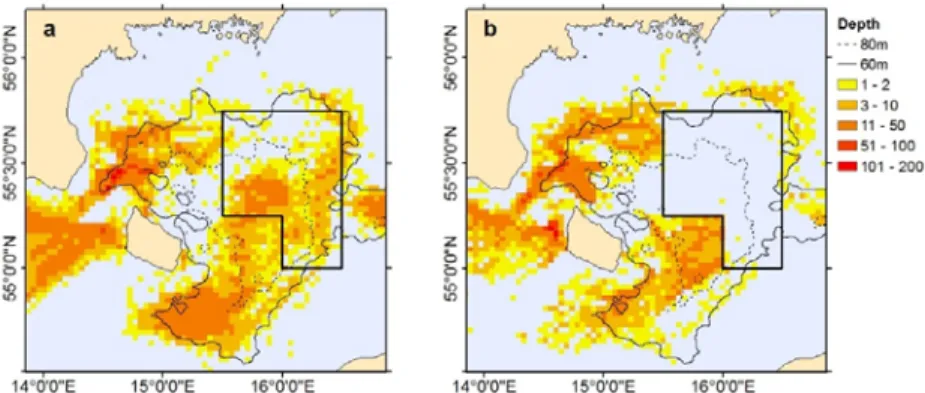
The present area closure in the main spawning ground (BB) of the EB cod allows part of the 364
stock to spawn undisturbed. However, this would not necessarily increase the recruitment, if 365
the offspring spawned outside the closure would have a higher survival probability due to 366
better environmental or feeding conditions. In such situations, the area closure may in fact 367
increase disturbance and fishing pressure on those spawners whose offspring would otherwise 368
have a greater chance to survive (Table 2). This is because fishing effort is likely to be 369
concentrated in the areas outside the closure, as exemplified in Fig. 5. Expansion of the area 370
closure to cover most of the spawning (defined by 60m isobaths in BB) could avoid the 371
potential negative effect of the closure in relation to offspring survival. However, an area 372
closure in SD 25 could also cause fishing effort reallocation to SD 26, increasing the fishing 373
pressure on the remaining larger cod found in this area, with negative impacts on stock 374
structure.
375 376
This example demonstrates that a spawning close that is beneficial for the stock through one 377
mechanism may at the same time compromise other aspects of the stock status. The relative 378
importance of these different impacts is presently not possible to quantify with the data and 379
knowledge available for the EB cod. The tradeoffs between different impacts are more likely 380
to occur when the closures cover small areas, causing fishing effort to concentrate on other 381
stock components during the time of the closure. In the case of the EB cod, avoiding the 382
potential negative effects of the area closure in BB we have identified in this study, the 383
closure would need to cover most of the stock distribution, i.e. the entire spawning area in BB 384
and also SD 26. The latter is because it is not possible to identify smaller areas where the 385
largest cod occur, and these are unlikely to correspond to the present small area closures in 386
SD 26, which are not designed for that purpose.
387 388
The seasonal closure (July 1–August 31) implemented in 2018 in the main cod distribution 389
area (SD 25–26) does not cover the months of peak spawning (June) in recent years (ICES, 390
2018b). The closure in July–August may to some extent cause temporal fishing effort 391
reallocation to June increasing the disturbance of peak spawning in this month. However, this 392
could be avoided simply by adjusting the timing of the closure to cover peak spawning. For 393
WB cod, where the investigated closures covered the entire distribution area of the stock and 394
matched the peak spawning time, potential negative effects associated with the closures were 395
not identified.
396 397
Table 2. Summary of the potential positive and negative effects of the implemented area 398
closure (AC) in Bornholm Basin (BB) and the seasonal closure (SC) in SDs 25–26 on the 399
eastern Baltic cod.
400
Closure Potential positive effects Potential negative effects
AC: BB May 1–Oct 31
Undisturbed spawning of a fraction of the stock.
Part of the spawning, high survival of offspring, and larger cod occur in areas outside the closure, where fishing effort may reallocate.
SC: July 1- August 31(SDs 25–26)
Undisturbed spawning of a fraction of the stock; somewhat reduced fishing pressure on larger cod.
Possibly increased disturbance of peak spawning in June, due to temporal fishing effort reallocation.
401
402
Fig. 5. Fishing effort in the Bornholm Basin: Example of the spatial distribution of fisheries in 403
(a) months without the area closure (Nov–April) compared to (b) the months with the area 404
closure in force (May–Oct). Based on Swedish and Danish VMS data for demersal fishing 405
activities (defined by 2–4 knots speed), average for the years 2014–2016. The black solid box 406
shows the extent of the area closure (EU, 2016).
407 408
5. Discussion 409
410
5.1 Challenges associated with evaluating the effects of spawning closures 411
Fishing closures during the spawning time of the fish are commonly applied in fisheries 412
management worldwide, but their impacts on fish stock development are generally very 413
difficult to demonstrate. Consequently, evaluations of the effectiveness of such closures have 414
often remained inconclusive (e.g., Arendse et al., 2007; Clarke et al., 2015). Studies on 415
closures in general have found that their effectiveness depends, amongst others, on their 416
spatial and temporal properties considering the behavior and biology of the target species 417
(Sheaves et al., 2006; van Overzee and Rijnsdorp, 2015). Size and age of the closure are 418
important (Vandeperre et al., 2011) and what other fisheries management measures are 419
applied in parallel (Beare et al., 2013; Clarke et al., 2015). Environmental and other 420
influences often “mask” the effects of the closures on fish stocks complicating the evaluations 421
of their effectiveness (Pastoors et al., 2000; Beare et al., 2013).
422 423
For the EB cod, the strongest year-classes occurred in the 1970s–early 1980s, i.e. prior to the 424
implementation of the spawning closures, which was due to good environmental conditions in 425
these years (Bagge et al., 1994). For the WB cod, both the strongest and the weakest year- 426
class in the last 20 years were formed in years when most spawning was protected by the 427
closure (in 2016 and 2017) (ICES, 2018a). Although environmental and other factors 428
determine major fluctuations in the Baltic cod recruitment, spawning closures may modify the 429
recruitment possible to achieve under given ecosystem and environmental conditions.
430
However, such effects have so far not been possible to disentangle.
431 432
Recognizing the difficulty to demonstrate or quantify the realized effects of spawning 433
closures on fish stocks, we took a different approach in this study, where we investigated the 434
potential effects of the spawning closures on Baltic cod. In this approach, we evaluated 435
whether positive effects to the stock potentially can occur through specific mechanisms. This 436
approach does not verify whether a closure actually has a measurable effect on the stock.
437
Instead, it evaluates whether the design of the closure allows benefits to occur through a 438
specific mechanism, under the assumption that such benefits exist. The choice of the 439
mechanisms to consider in such evaluation depends at least partly on the specific objectives of 440
the closure, which are often not formally defined. Past reviews have identified lack of clear, 441
testable objectives as one of the basic obstacles for evaluating the effectiveness of the 442
implemented closures (STECF, 2007; Beare et al., 2013). Therefore, the first task is often to 443
define, based on knowledge and logic, some objectives for the closures that their effectiveness 444
can then be evaluated against (STECF, 2007). In this paper, we did not use the overarching 445
objective of improving the cod stock status as an evaluation criterion, because many other 446
factors influence the stock development. Instead, we focused on the specific mechanisms 447
through which the closures could potentially influence the cod stocks. This approach allows 448
considering potential both positive and negative impacts of the closures, which may be 449
important, even if not being part of the intended objectives of the closures.
450 451
The main potential benefits of spawning closures suggested in the literature (e.g., van Overzee 452
and Rijnsdorp, 2015) include the aspects of undisturbed spawning, offspring survival and 453
stock structure, which we addressed in this study. We considered these potential effects of the 454
spawning closures most relevant for the Baltic cod. However, we do not exclude that other 455
objectives could possibly be defined. For example, fishing closures can affect the total catch 456
of the species, which is often most rigorously and quantitative analysed (e.g., Kraus et al., 457
2009; Clarke et al., 2015), in contrast to the other possible effects of the closures. STECF 458
(2016) has recently evaluated the effects of the seasonal closures on the EB cod catch, 459
suggesting that under the assumption of no effort reallocation, the closures could reduce the 460
total fisheries catch of the EB cod. However, when TAC management is in place as for the 461
Baltic cod, this can deliver the desired total catch level more directly than a closure, given that 462
TACs are effective in regulating total catch. For that reason, we focused this paper on the 463
potential benefits of the spawning closures related to recruitment, which would be difficult to 464
achieve by quota management alone.
465 466
5.2 Lessons from the Baltic cod case study 467
In the Baltic Sea, ichthyoplankton surveys monitoring spatio-temporal dynamics of cod eggs 468
and larvae (e.g., Hinrichsen et al., 2007) as well as studies on adult maturity (Bleil et al., 469
2009) provide information on when and where cod spawning takes place. Regular monitoring 470
has demonstrated that the most intensive spawning activity is variable in time and space (Fig.
471
S1), implying that closures covering relatively small areas or short time periods have a low 472
chance of matching the peak spawning in all years. Furthermore, the EB cod is one of the 473
fortunate examples, where substantial process knowledge and modelling tools to evaluate 474
spatio-temporal variability in early life stage survival are available (Hinrichsen et al., 2002;
475
ICES, 2004; Kraus et al., 2009; Huwer et al., 2014). These studies have demonstrated that the 476
highest concentration of spawning activity is not always corresponding to the highest survival 477
probability up to juvenile stage, further complicating the design of spawning closures 478
covering relatively small areas.
479 480
In practice, it would likely be difficult to adjust the spawning closures to dynamic conditions 481
(Hinrichsen et al., 2007). The presently available knowledge on cod early life stage 482
production and survival in the Baltic Sea is a result of several decades of research efforts. This 483
has allowed identifying issues that may be important in relation to spawning closures, 484
however not necessarily feasible to adjust to in real time. Such investigations are often time 485
consuming and labour intensive, and therefore not regularly updated. Moreover, even in the 486
relatively data rich case of the Baltic cod, a number of knowledge gaps still exist. For 487
example, it is currently not possible to quantify the spatio-temporal origin of surviving 488
recruits in absolute terms, or describe the fine scale spatial distribution of different stock 489
components during the spawning time. Both of these questions are highly relevant especially 490
for designing smaller area closures.
491
492
The data collection for fisheries management purposes generally focuses on traditional fish 493
stock assessments, which provide the biological basis for setting annual catch limits. As 494
spawning closures can potentially affect a fish stock through various complex mechanisms, 495
data requirements for their proper evaluation are much greater, including, for example 496
information on spawning behaviour and physiology of the fish (Morgan et al., 1999; Dean et 497
al., 2014). The information relevant for designing and evaluating spawning closures, if 498
existing, is mostly produced via scientific programs, which are generally decoupled from 499
management needs. This implies that the information is often insufficient, irregularly updated, 500
or not tailored to the purpose of evaluating management measures such as spawning closures.
501 502
It is unclear whether monitoring and research on this topic can substantially increase in future.
503
Therefore, it is important to choose management measures, which are robust to data 504
limitations and related uncertainties. The Baltic cod example demonstrates that designing 505
smaller area closures properly is associated with much greater data requirements compared to 506
a closure covering most of the distribution area of the stock during its spawning time. This is 507
because small area closures cause fishing effort reallocation to other stock components with a 508
risk of unintended negative effects via the mechanisms that may not have been accounted for 509
when designing the closure. To avoid these counterproductive effects, a closure would need to 510
be sufficiently large. This is in line with experiences from other areas, suggesting that size is 511
an important feature of the closed areas in general (Edgar et al., 2014).
512
513
Quantifying the actual effects of spawning closures likely remains a challenge also in future.
514
Therefore, if spawning closures are chosen to be applied as a supplementary management 515
measure, these should be designed in a way that allows their potential benefits to occur, while 516
avoiding potential counteracting effects. The Baltic cod example suggests that the closures 517
covering most of the distribution area of the stock during its peak spawning time are better 518
suited for this purpose rather than those covering small areas.
519 520
Conclusions 521
522
The example of cod in the Baltic Sea illustrates the complexity of considerations that may be 523
involved in designing an appropriate spawning closure to improve fish stock status. A closure 524
and the resulting fishing effort reallocation can potentially affect the stock via a number of 525
mechanisms, which can include unintended negative effects counteracting the expected 526
benefits of the closure. Proper evaluation of the different mechanisms how a closure can 527
affect the stock has high demands for data and biological knowledge, which may not be 528
present even in data-rich cases such as the Baltic cod. Among the two types of closures we 529
have investigated, the design of smaller area closures generally involves greater complexity 530
and data requirements compared to the closures covering most of the distribution area of the 531
stock during the spawning time. Also, smaller area closures are associated with a higher risk 532
of having negative effects to the stock, if not rigorously assessed and adapted to changing 533
conditions. The spawning closures covering most of the distribution area of the stock are 534
generally more robust to the uncertainties and gaps in biological knowledge.
535 536
Acknowledgements 537
538
The present study was funded by the European Maritime and Fisheries Fund and the Danish 539
Fisheries Agency and contributes to BONUS projects, the joint Baltic Sea research and 540
development programme (Art 185), funded jointly from the European Union’s Seventh 541
Programme for research, technological development, and demonstration and from national 542
funding institutions (BIO-C3 and INSPIRE). We thank the participants of the ICES workshop 543
to evaluate the effect of conservation measures on Eastern Baltic cod (WKCONGA) that 544
inspired this paper. We also thank Patrik Jonsson for assistance with the VMS data, and Clara 545
Ulrich and the three anonymous reviews for valuable comments on earlier versions of the 546
manuscript.
547
548
Supplementary data 549
550
Supplementary information is available at the online version of the article.
551 552
References 553
Arendse, C. J., Govender, A., and Branch, G. M. 2007. Are closed fishing seasons an 554
effective means of increasing reproductive output? A per-recruit simulation using the 555
limpet Cymbula granatina as a case history. Fisheries Research, 85: 93–100.
556
Bagge, O., Thurow, F., Steffensen, E., and Bay, J. 1994. The Baltic cod. Dana, 10: 1–28.
557
Beare, D., Rijnsdorp, A. D., Blaesberg, M., Damm, U., Egekvist, J., Fock, H., Kloppmann, 558
M., et al. 2013. Evaluating the effect of fishery closures: Lessons learnt from the Plaice 559
Box. Journal of Sea Research, 84: 49–60.
560
Bleil, M., and Oeberst, R. 1998. The spawning of cod (Gadus morhua morhua) under 561
controlled conditions of captivity, quantity and quality of spawned eggs. ICES Document 562
CM 1998/ DD: 3, 27 pp.
563
Bleil, M., and Oeberst, R. 2002. Spawning areas of the cod stock in the western Baltic Sea 564
and minimum length at maturity. Archive of Fishery and Marine Research, 49: 243–258.
565
Bleil, M., Oeberst, R., and Urrutia, P. 2009. Seasonal maturity development of Baltic cod in 566
different spawning areas: importance of the Arkona Sea for the summer spawning stock.
567
Journal of Applied Ichthyology, 25: 10–17.
568
Clarke, J., Bailey, D. M., and Wright, P. J. 2015. Evaluating the effectiveness of a seasonal 569
spawning area closure. ICES Journal of Marine Science, 72: 2627–2637.
570
Davies, T. K., Mees, C. C., and Milner-Gulland, E. J. 2017. Use of a counterfactual approach 571
to evaluate the effect of area closures on fishing location in a tropical tuna fishery. PLoS 572
ONE 12: e0174758.
573
Dean, M. J., Hoffman, W. S., Zemeckis, D. R., and Armstrong, M. P. 2014. Fine-scale diel 574
and gender-based patterns in behaviour of Atlantic cod (Gadus morhua) on a spawning 575
ground in the western Gulf of Maine. ICES Journal of Marine Science, 71: 1474–1489.
576
Edgar, G. J., Stuart-Smith, R. D., Willis, T. J., Kininmonth, S., Baker, S. C., Banks, S., 577
Barrett, N. S. et al. 2014. Global conservation outcomes depend on marine protected areas 578
with five key features. Nature, 506: 216–220.
579
EU. 2007. Council Regulation (EC) No 1098/2007 of 18 September 2007 establishing a 580
multiannual plan for the cod stocks in the Baltic Sea and the fisheries exploiting those 581
stocks, amending Regulation (EEC) No 2847/93 and repealing Regulation (EC) No 582
779/97.
583
EU. 2016. Regulation (EU) 2016/1139 of the European Parliament and of the Council of 6 584
July 2016 establishing a multiannual plan for the stocks of cod, herring and sprat in the 585
Baltic Sea and the fisheries exploiting those stocks, amending Council Regulation (EC) No 586
2187/2005 and repealing Council Regulation (EC) No 1098/2007.
587
Grüss, A., Robinson, J., Heppell, S. S., Heppell, S. A., and Semmens, B. 2014. Conservation 588
and fisheries effects of spawning aggregation marine protected areas: What we know, 589
where we should go, and what we need to get there. ICES Journal of Marine Science, 71:
590
1515–1534.
591
Halpern, B. S. 2003. The Impact of Marine Reserves: Do Reserves Work and Does Reserve 592
Size Matter? Ecological Applications, 13: 117–137.
593
Hinrichsen, H. H., Möllmann, C., Voss, R., Köster, F. W., and Kornilovs, G. 2002.
594
Biophysical modelling of larval Baltic cod growth and survival. Canadian Journal of 595
Fisheries and Aquatic Sciences, 59: 1858–1873.
596
Hinrichsen, H. H., Voss, R., Wieland, K., Köster, F., Andersen, K. H., and Margonski, P.
597
2007. Spatial and temporal heterogeneity of the cod spawning environment in the 598
Bornholm Basin, Baltic Sea. Marine Ecology Progress Series, 345: 245−254.
599
Hinrichsen, H. H., Lehmann, A., Petereit, C., Nissling, A., Ustups, D., Bergström, U., and 600
Hüssy, K. 2016a. Spawning areas of eastern Baltic cod revisited: Using hydrodynamic 601
modelling to reveal spawning habitat suitability, egg survival probability, and connectivity 602
patterns. Progress in Oceanography, 143: 13–25.
603
Hinrichsen, H. H., von Dewitz, B., Dierking, J., Haslob, H., Makarchouk, A., Petereit, C., and 604
Voss R. 2016b. Oxygen depletion in coastal seas and the effective spawning stock biomass 605
of an exploited fish species. Royal Society Open Science, 3: 150338.
606
Huwer, B., Clemmesen, C., Grønkjær P., and Köster, F. W. 2011. Vertical distribution and 607
growth performance of Baltic cod larvae - Field evidence for starvation-induced 608
recruitment regulation during the larval stage? Progress in Oceanography, 91: 382–396.
609
Huwer, B., Hinrichsen, H. H., Böttcher, U., Voss, R., and Köster, F. W. 2014. Characteristics 610
of juvenile survivors reveal spatiotemporal differences in early life stage survival of Baltic 611
cod. Marine Ecology Progress Series, 511: 165–180.
612
Hüssy, K. 2011. Review of western Baltic cod (Gadus morhua) recruitment dynamics. ICES 613
Journal of Marine Science, 68: 1459–1471.
614
Hüssy, K., Hinrichsen, H. H., and Huwer, B. 2012. Hydrographic influence on the spawning 615
habitat suitability of western Baltic cod (Gadus morhua). ICES Journal of Marine Science, 616
69: 1736–1743.
617
Hüssy, K., Hinrichsen, H. H., Eero, M., Mosegaard, H., Hemmer-Hansen, J., Lehmann, A., 618
and Lundgaard, L. S. 2016. Spatio-temporal trends in stock mixing of eastern and western 619
Baltic cod in the Arkona Basin and the implications for recruitment. ICES Journal of 620
Marine Science, 73: 293–303.
621
IBSFC. 1994. Proceedings of the International Baltic Sea Fisheries Commission 20th session, 622
Gdynia, Poland, 12–16 September 1994.
623
ICES. 2004. Report of the Study Group on Closed Spawning areas of Eastern Baltic cod.
624
ICES Document CM 2004/ACFM: 17. Charlottenlund, Denmark.
625
ICES. 2018a. Report of the Baltic Fisheries Assessment Working Group (WGBFAS). ICES 626
Document CM 2018/ACOM: 11. Copenhagen, Denmark.
627
ICES. 2018b. Report of the workshop to evaluate the effect of conservation measures on 628
Eastern Baltic cod (WKCONGA). ICES Document CM CM/ACOM:51. Copenhagen, 629
Denmark.
630
Kraus, G., Pelletier, D., Dubreuil, J., Möllmann, C., Hinrichsen, H. H., Bastardie, F., 631
Vermard, Y., and Mahévas, S. 2009. A model-based evaluation of Marine Protected Areas:
632
the example of eastern Baltic cod (Gadus morhua callarias L.). ICES Journal of Marine 633
Science, 66: 109–121.
634
Köster, F. W., Möllmann, C., Hinrichsen, H. H., Tomkiewicz, J., Wieland, K., Kraus, G., 635
Voss, R., et al. 2005. Baltic cod recruitment – the impact of climate and species 636
interaction. ICES Journal of Marine Science, 62: 1408–1425.
637
Köster, F. W., Vinther, M., MacKenzie, B. R., Eero, M., and Plikshs, M. 2009. Environmental 638
effects on recruitment and implications for biological reference points of eastern Baltic cod 639
(Gadus morhua). Journal of Northwest Atlantic Fishery Science, 41: 205–220.
640
Köster, F. W., Huwer, B., Hinrichsen, H. H., Neumann, V., Makarchouk, A., Eero, M., 641
Dewitz, B. V., et al. 2017. Eastern Baltic cod recruitment revisited—dynamics and 642
impacting factors. ICES Journal of Marine Science, 74: 3–19.
643
Lester, S. E., Halpern, B. S., Grorud-Colvert, K., Lubchenco, J., Ruttenberg, B. I., Gaines, S.
644
D., Airamé, S., et al. 2009. Biological Effects Within No-Take Marine Reserves: A global 645
Synthesis. Marine Ecology Progress Series, 384: 33– 46.
646
MacKenzie, B. R., St. John, M. A., and Wieland, K. 1996. Eastern Baltic cod: perspectives 647
from existing data on processes affecting growth and survival of eggs and larvae. Marine 648
Ecology Progress Series, 134: 265–281.
649
MacKenzie, B. R., Hinrichsen, H. H., Plikshs, M., and Wieland, K. 2000. Quantifying 650
environmental heterogeneity: estimating the size for successful cod egg development in the 651
Baltic Sea and its influence on recruitment. Marine Ecology Progress Series, 193:143–156.
652
Marteinsdottir, G., and Steinarsson, A. 1998. Maternal influence on the size and viability of 653
Iceland cod Gadus morhua eggs and larvae. Journal of Fish Biology, 52: 1241–1258.
654
Morgan, M. J., Wilson, C. E., and Crim, L.W.1999. The effect of stress on reproduction in 655
Atlantic cod. Journal of Fish Biology, 54: 477–488.
656
Murawski, S. A., Brown, R., Lai, H.-L., Rago, P. J., and Hendrickson, L. 2000. Large-scale 657
closed areas as a fishery-management tool in temperate marine systems: the Georges Bank 658
experience. Bulletin of Marine Science, 66: 775–798.
659
Nielsen, E. E., Hansen, M. M., Ruzzante, D. E., Meldrup, D., and Grønkjær, P. 2003.
660
Evidence of a hybrid-zone in Atlantic cod (Gadus morhua) in the Baltic and the Danish 661
Belt Sea revealed by individual admixture analysis. Molecular Ecology, 12: 1497–1508.
662
Nielsen, E. E., Grønkjær, P., Meldrup, D., and Paulsen, H. 2005. Retention of juveniles within 663
a hybrid zone between North Sea and Baltic Sea Atlantic cod (Gadus morhua). Canadian 664
Journal of Fisheries and Aquatic Sciences, 62: 2219–2225.
665
Neumann, V., Köster, F. W., Schaber, M., and Eero, M. 2014. Recovery in eastern Baltic cod:
666
is increased recruitment caused by decreased predation on early life stages? ICES Journal 667
of Marine Science, 71: 1382–1392.
668
O’Keefe, C. E., Cadrin S. X., and Stokesbury, K. D. E. 2014. Evaluating effectiveness of time 669
/area closures, quotas/caps, and fleet communications to reduce fisheries bycatch. ICES 670
Journal of Marine Science, 71: 1286–1297.
671
Pastoors, M. A., Rijnsdorp, A. D., and Van Beek, F. A. 2000. Effects of a partially closed area 672
in the North Sea ("plaice box") on stock development of plaice. ICES Journal of Marine 673
Science, 57: 1014–1022.
674
Pendleton, L. H., Ahmadia, G. N., Browman, H. I., Thurstan, R. H., Kaplan, D. M. and 675
Bartolino, V. 2017. Debating the effectiveness of marine protected areas. ICES Journal of 676
Marine Science, doi:10.1093/icesjms/fsx154.
677
Plikshs, M., Hinrichsen, H. H., Elferts, D., Sics, I., Kornilovs, G., and Köster, F. W. 2015.
678
Reproduction of Baltic cod, Gadus morhua (Actinopterygii: Gadiformes: Gadidae), in the 679
Gotland Basin: Causes of annual variability. Acta Ichthyologica Et Piscatoria, 45: 247–
680
258.
681
Poćwierz-Kotus, A., Kijewska, A., Petereit, C., Bernaś, R., Więcaszek, B., Arnyasi, M., Lien, 682
S., et al. 2015. Genetic differentiation of brackish water populations of cod Gadus morhua 683
in the southern Baltic, inferred from genotyping using SNP-arrays. Marine Genomics, 19:
684
17–22.
685
Pomeroy, R. S., Watson, L. M., Parks, J. E., and Cid, G. A. 2005. How is your MPA doing? A 686
methodology for evaluating the management effectiveness of marine protected areas.
687
Ocean & Coastal Management, 48: 485–502.
688
Roberts, C. M., Hawkins, J. P., and Gell, F. R. 2005. The role of marine reserves in achieving 689
sustainable fisheries. Philosophical Transactions of the Royal Society B, 360: 123–132.
690
Russ, G. R., Alcala, A. C., Maypa, A. P., Calumpong, H. P., and White A. T. 2004. Marine 691
reserve benefits local fisheries. Ecological Applications, 14: 597–606.
692
Russell, M. W., Luckhurst, B. E., and Lindeman, K. C. 2012. Management of spawning 693
aggregations. In Reef fish spawning aggregations: biology, research and management, pp.
694
371–404. Ed. by Y. Sadovy de Mitcheson, and P. L. Colin. Springer, Berlin. 584 pp.
695
Sadovy de Mitcheson, Y, and Erisman, B. 2012. Fishery and biological implications of 696
fishing spawning aggregations, and the social and economic importance of aggregating 697
fishes. In Reef fish spawning aggregations: biology, research and management, pp. 225–
698
284. Ed. by Y. Sadovy de Mitcheson, and P. L. Colin. Springer, Berlin. 584 pp.
699
Sheaves, M., Baker, R., and Johnston, R. 2006. Marine nurseries and effective juvenile 700
habitats: an alternative view. Marine Ecology Progress Series, 318: 303–306.
701
STECF. 2007. Evaluation of closed area schemes (SGMOS-07-03).
702
https://stecf.jrc.ec.europa.eu/documents/43805/44876/07-09_SG-MOS+07-03+- 703
+Evaluation+of+closed+areas+II.pdf 704
STECF. 2010. Report of the Sub Group on Management Objectives and Strategies (SGMOS 705
10-06). Part e) Evaluation of multi-annual plan for Baltic cod. 18–22 October 2010, Vigo.
706
Ed. by J. Simmonds, C. Zimmermann, M. Eero, J. Berkenhagen, A. Montova, and R.
707
Nielsen. Publications Office of the European Union, Luxembourg. 176 pp.
708
STECF. 2016. Special request for evaluating Baltic cod additional measures (STECF-16-23).
709
doi:10.2788/684620. Publications Office of the European Union, Luxembourg.
710
Suuronen, P., Jounela, P., and Tschernij, V. 2010. Fishermen responses on marine protected 711
areas in the Baltic cod fishery. Marine Policy, 34: 237–243.
712
Torres-Irineo, E., Gaertner, D., de Molina, A. D., and Ariz, J. 2011. Effects of time-area 713
closure on tropical tuna purse-seine fleet dynamics through some fishery indicators.
714
Aquatic Living Resources, 24: 337–350.
715
Trippel, E. A. 1998. Egg size and viability and seasonal offspring production of young 716
Atlantic cod. Transactions of the American Fisheries Society, 127: 339–359.
717
Vallin, L., and Nissling, A. 2000. Maternal effects on egg size and egg buoyancy of Baltic 718
cod, Gadus morhua. Implications for stock structure effects on recruitment. Fisheries 719
Research, 49: 21–37.
720
van Overzee, H. M. J, and Rijnsdorp, A. D. 2015. Effects of fishing during the spawning 721
period: implications for sustainable management. Reviews in Fish Biology and Fisheries, 722
25: 65–83.
723
Vandeperre, F., Higgins, R. M., Sánchez-Meca, J., Maynou, F., Goñi, R., Martín-Sosa, P., 724
Pérez-Ruzafa, A., et al. 2011. Effects of no-take area size and age of marine protected 725
areas on fisheries yields: a meta-analytical approach. Fish and Fisheries, 12: 412–426 726
Voss, R., Köster, F. W., and Dickmann, M. 2003. Comparing the feeding habits of co- 727
occurring sprat (Sprattus sprattus) and cod (Gadus morhua) larvae in the Bornholm Basin, 728
Baltic Sea. Fisheries Research, 63: 97−111.
729
Wieland, K. 1988. Distribution and mortality of cod eggs in the Bornholm Basin (Baltic Sea) 730
in May and June 1986. Kieler Meeresforschungen. Sonderheft, 6: 331–340.
731
Wieland, K., Jarre-Teichmann, A., and Horbowa, K. 2000. Changes in the timing of spawning 732
of Baltic cod: possible causes and implications for recruitment. ICES Journal of Marine 733
Science, 57: 452–464.
734
Zemeckis, D. R., Hoffman, W. S., Dean, M. J., Armstrong, M. P., and Cadrin, S. X. 2014.
735
Spawning site fidelity by Atlantic cod (Gadus morhua) in the Gulf of Maine: implications 736
for population structure and rebuilding. ICES Journal of Marine Science, 71: 1356–1365.
737