R E S E A R C H A R T I C L E
Nonstationarity of the link between the Tropics and the summer East Atlantic pattern
Ole Rieke1,2,3 | Richard J. Greatbatch1,2 | Gereon Gollan1
1GEOMAR Helmholtz Centre for Ocean Research Kiel, Kiel, Germany
2Faculty of Mathematics and Natural Sciences, Christian Albrechts Universität, Kiel, Germany
3Geophysical Institute, Faculty of Mathematics and Natural Sciences, University of Bergen, Bergen, Norway
Correspondence
Richard J. Greatbatch, GEOMAR Helmholtz Centre for Ocean Research Kiel, Düsternbrooker Weg 20, 24105 Kiel, Germany.
Email: rgreatbatch@geomar.de
Abstract
A 700-year pre-industrial control run with the MPI-ESM-LR model is used to investigate the link between the summer East Atlantic (SEA) pattern and the Pacific-Caribbean rainfall dipole (PCD), a link that has previously been shown using ERA-Interim reanalysis data. In the model, it is found that the link between the SEA and PCD is present in some multidecadal epochs but not in others. A simple statistical model reproduces this behaviour. In the statistical model, the SEA is represented by a white noise process plus a weak influence from the PCD based on the full 700 years of the model run. The statistical model is relevant to other extratropical modes of variability, for example, the winter North Atlantic Oscillation (NAO), that are weakly influenced by the Tropics. It follows that the link between the Tropics and the winter NAO is likely to undergo modulation on multidecadal time scales, as found in some previous studies. The results suggest that any predictability of the SEA, and by implication the NAO, based on tropical rainfall may not be robust and may, in fact, be modulated on multidecadal time scales, with implications for seasonal and decadal prediction systems.
K E Y W O R D S
nonstationarity, seasonal prediction, summer East Atlantic pattern
1 | INTRODUCTION
The dominant mode of variability in the boreal winter monthly mean atmospheric circulation over the North Atlantic/European sector (NAE) is the North Atlantic Oscillation (NAO) (Greatbatch, 2000; Hurrell et al., 2003), and the second most important mode of variability is typically the East Atlantic pattern (Barnston and Livezey, 1987). The East Atlantic pattern is characterized by a pressure anomaly to the west of the British Isles and,
in combination with the NAO, can either enhance or mit- igate the anomalous winter weather associated with the NAO over Europe (Moore and Renfrew, 2012). Recent years have seen considerable progress towards reliable prediction of the winter NAO (Scaifeet al., 2014). Particu- larly important is the influence from the Tropics on the NAO and the accurate prediction of tropical rainfall (Scaife et al., 2017; 2019). Nevertheless, some authors have argued that the link between the Tropics and the extratropics may not be stationary and may be weaker, implying less predictability, in some decades than in others (Greatbatch et al., 2004; Greatbatch and Jung,
This work is based on Ole Rieke's Bachelor thesis.
This is an open access article under the terms of the Creative Commons Attribution License, which permits use, distribution and reproduction in any medium, provided the original work is properly cited.
© 2021 The Authors.Atmospheric Science Letterspublished by John Wiley & Sons Ltd on behalf of the Royal Meteorological Society.
Atmos Sci Lett.2021;22:e1026. wileyonlinelibrary.com/journal/asl 1 of 9
https://doi.org/10.1002/asl.1026
2007; O'Reilly et al., 2017; Weisheimer et al., 2018;
O'Reillyet al., 2019).
In contrast to boreal winter, prediction of the NAE cir- culation in boreal summer several months ahead remains a challenge (Dunstoneet al., 2018). Ossóet al. (2018) suggest a link between North Atlantic sea surface temperature (SST) anomalies in boreal spring and a pattern they associ- ated with the East Atlantic pattern in summer (see also Duchezet al., 2016). On the other hand, Wulffet al. (2017) identify what they call the summer East Atlantic (SEA) pat- tern with the second empirical orthogonal function (EOF) of summer (June/July/August) mean 500-hPa geopotential height variability over the NAE; the first EOF is the sum- mer NAO (Greatbatch and Rong, 2006; Folland et al., 2009). Viewed hemispherically, the SEA, as identified by Wulffet al. (2017), has the character of a wave train with a centre of action west of the British Isles. When in its posi- tive phase, with low pressure west of the British Isles and high pressure to the east, the weather is unusually warm over Europe and can be associated with European heat waves, as in 2015. Wulffet al. (2017) identify a link between the SEA and an anomalous precipitation dipole, with one centre of action over the Caribbean and another over the tropical, eastern North Pacific. They further argue that the presence of the dipole is related to the developing phase of El Niño Southern Oscillation (ENSO), with a developing El Niño being linked to warm summers over Europe.
O'Reillyet al. (2018) identify a very similar link between the tropical Pacific and the NAE in boreal summer and argue that Rossby wave propagation establishes the link.
In the present paper, we investigate the stationarity of the link between tropical rainfall and the SEA in a long run of a coupled atmosphere/ocean earth system model.
We find that the link is present in some 51-year windows and not in others. We use a simple statistical model to illustrate this behaviour. It follows that whereas the SEA is linked to tropical rainfall during the time period stud- ied by Wulff et al. (2017), that is, 1979–2016, the SEA may not always be linked to tropical rainfall in the future and, likewise, may not always have been linked to tropi- cal rainfall in the past.
The structure of this paper is as follows. Section 2 briefly describes the pre-industrial model simulation that is used for analysis. Section 3 presents the results focusing on the pre-industrial run. Section 4 then intro- duces the statistical model and section 5 provides a summary and conclusions. Results from a historical run using the same model and an analysis applied to the ERA20C reanalysis (Poli et al., 2016) are given in the Data S1, Supporting Information. There, we present evi- dence for a breakdown in the link between the SEA and the Pacific-Caribbean rainfall dipole during the mid-20th century.
2 | MODEL AND METHODS
For the analysis presented here, we use 700 years of out- put from a long pre-industrial control run using the MPI- ESM-LR model. The atmospheric component is the ECHAM6 model (Stevens et al., 2013) configured at T63L47 resolution coupled to the MPI Ocean Model (Jungclauset al., 2013) with roughly 1.5horizontal reso- lution and 47 levels in the vertical. As described below, the SEA index is defined using the full 700 years of the model run and the stationarity of the SEA/tropical pre- cipitation link is examined by dividing the 700 years into running 51-year windows (the results are not sensitive to the choice of window length, e.g., 31 or 71 years). We also make use of a historical run using the same model cover- ing the years 1850–2005, as well as the ERA5 (Hersbach et al., 2020) and ERA20C (Poli et al., 2016) reanalysis products for the years 1979–2020 and 1900–2010, respec- tively. In the following, when referring to“the model”we mean the pre-industrial control run, unless otherwise stated.
To identify the SEA in the model, an EOF analysis is carried out on summer (June/July/August; hereafter JJA) mean anomalies of 500-hPa geopotential height over the region (90W–30E, 40N–70N), the same domain as used by Wulff et al. (2017). Differing from Wulff et al.
(2017), where the SEA appears as the second EOF, here the SEA appears as the third EOF. We also note that the first three EOFs are all distinct from the neighbouring eigenvalues following the criterion of Northet al. (1982) and that the first EOF corresponds to the summer NAO (Greatbatch and Rong, 2006; Folland et al., 2009). The SEA index is here defined as the principal component time series (nondimensional) of the third EOF, normal- ized so that the SD is 1. As the third EOF, the SEA accounts for 14.2% of the explained variance in the analy- sis region. This compares with 18% as found by Wulff et al. (2017). Applying the same EOF analysis to the ERA5 data for the years 1979–2020, the SEA appears as the second EOF, as in Wulffet al. (2017), and accounts for 16%of the variance.
To measure statistical significance, a two-sided Stu- dent's t test is applied, assuming all years are indepen- dent. It should also be noted that all correlations, regressions and EOF analyses, both in the main text and the Data S1, are computed using detrended time series.
3 | RESULTS
Figure 1a shows the spatial pattern obtained by regressing JJA mean 500-hPa geopotential height anoma- lies against the SEA index from the model (a similar
2 of 9 RIEKEET AL.
pattern results if sea level pressure is used, not shown).
The SEA pattern shown here has many similarities to that shown by Wulffet al. (2017), who used ERA-Interim reanalysis (Dee et al., 2011), and also to that shown in Figure 1b from ERA-5. The pattern is suggestive of a wave train with centres of action of one sign near New- foundland and over Europe and of the opposite sign to the west of the British Isles and again further east, although there are some differences in detail, notably over North America. The regression of JJA mean precipi- tation anomalies on the SEA index (Figure 1c,d) shows drier conditions than normal over Europe in the positive phase of the SEA and also the dipole in precipitation in the Tropics between the tropical North Pacific and the Caribbean that was noted by Wulffet al. (2017) (note the different scales used for the figures reflecting the weaker, be it more significant, signal in the model). The dipole in precipitation is found in both the model and the reanalysis despite the much coarser resolution of the model (roughly 1.5 horizontal resolution and 47 levels in the vertical) compared to the reanalysis (30-km hori- zontal resolution and 137 levels in the vertical). Regres- sion on JJA surface air temperature (see Rieke, 2018, fig. 4) shows warmer than usual seasonal mean tempera- tures over Europe associated with the positive phase of the SEA, very similar to what was found by Wulff et al.
(2017). The link between the positive phase of the SEA and surface air temperature is expected given the corresponding air flow from the south between the two
centres of action either side of the British Isles, and the association between higher temperatures in summer and the clearer skies associated with the positive geopotential height anomaly over Europe (Folland et al., 2009; Pfahl and Wernli, 2012).
In order to investigate the tropical–extratropical tele- connection, the Pacific Caribbean Dipole (PCD) index is defined as the normalized (so that theSDis 1) difference in JJA mean precipitation anomalies averaged over the North Pacific region (180W–110W, 10N–20N) minus the Caribbean region (85W–65W, 10N–25N) shown by the two boxes in Figure 1c,d. Over the 700 years of the model run, the PCD index has a correlation with the SEA index of only 0.15 which, despite the small value, is statis- tically significant at the 95% level according to a Student's t test (even if the number of degrees of freedom is reduced from 700 to 200). By contrast, Wulffet al. (2017) obtained a correlation of 0.56 using the ERA-Interim reanalysis data for the period 1980–2014. The much smaller correlation found here is an indication that the link between the PCD and SEA is much weaker when considering the full 700 years of the model run than it is in the reanalysis.
Figure 2 shows the time series obtained by correlating the SEA and PCD indices in 51-year sliding windows taken from the 700-year model run. It is clear that the link between the SEA and the PCD is highly variable, with the correlation sometimes exceeding 0.5, as reported by Wulffet al. (2017), but also sometimes being close to
F I G U R E 1 Regression of summer (JJA) mean (a, b) 500-hPa geopotential height and (c, d) precipitation anomalies against the SEA index using (a, c) the full 700-year model output and (b, d) the ERA-5 reanalysis for the years 1979–2020. The solid lines indicate regions that are statistically significant at the 95% level using a Student'sttest assuming all years are independent. The boxes used to define the PCD index are shown in red (the Caribbean) and blue (the Pacific)
F I G U R E 2 The blue line shows the running cross- correlation in 51-year windows between the SEA and the PCD indices. The value for a certain year represents the value for the 51 years centred on that year.
The dashed blue line shows the 95% significance level obtained using a Student'sttest assuming all years are independent. The green filling indicates years with coefficients higher than given by the dashed blue line, grey filling the years with correlation lower than 0.05. The threshold of 0.05 is chosen so that there are roughly the same number of years marked grey as are marked green
F I G U R E 3 Regression of summer (JJA) mean anomalies of (a, c, e) 500-hPa geopotential height and (b, d, f) surface air temperature against the PCD index using (a, b) the full 700 years of model output and (c, d) the years indicated by the green and (e, f) the grey shading in Figure 2, corresponding to 51-year windows with significant (green) or no (grey) correlation between the SEA and the PCD indices
respectively. The solid lines highlight the regions of statistical significance at the 95% level based on a Student'sttest, assuming all years are independent
4 of 9 RIEKEET AL.
0. It follows that the link between the PCD and the SEA is highly nonstationary in the model, sometimes being significant, as between years 300 and 400 in the model run, and sometimes being weak or nonexistent. This sug- gests that the predictive potential for the SEA based on the link to the PCD is also highly variable, being present in some decadal epochs but not in others. It is an interest- ing point, nonetheless, that the correlation between the PCD and SEA indices is never significantly negative, indi- cating some robustness in the sign of the teleconnection, a point we return to in section 4.
To understand the nonstationary behaviour, we begin by investigating the extratropical teleconnection associated with the PCD in the model. Figure 3a shows the spatial pat- tern obtained by regressing the summer mean 500-hPa geo- potential height anomalies against the PCD index using all 700 years from the model. This shows a wave train emanat- ing from the Tropics that clearly resembles the SEA over the NAE region (Figure 1a), although there are also differ- ences from the SEA. In particular, the anomaly centres in Figure 3a are shifted to the south compared to the SEA pat- tern and there are differences over Greenland and over the Eurasian continent. We now compare years centred in 51-year windows of significant correlation between the SEA and PCD indices, marked with green shading in Figure 2, with years centred in 51-year windows of no cor- relation between the SEA and PCD indices, marked with grey shading in Figure 2. Figure 3c,e shows the regression of JJA mean 500-hPa geopotential height anomalies against the PCD index for each set of years. This shows that in both
sets of years, the tropical precipitation anomalies associated with the PCD index excite a wave train that propagates into the extratropics, although this is weaker in epochs of no correlation (Figure 3e) than in epochs with significant cor- relation (Figure 3c), apart from the appearance of an anom- aly over Greenland in epochs of no correlation. An important difference between the two plots is the lack of the significant positive geopotential anomaly over Scandi- navia in the years when the PCD and the SEA are not con- nected (Figure 3e). An immediate consequence of this is that the connection between the PCD and summer temper- ature in Scandinavia is lost in these years, as can be seen by comparing Figures 3d,f.
To investigate further, Figure 4 shows the regression of JJA mean 500-hPa geopotential height and precipita- tion anomalies on the SEA index for the years indicated by green and grey shading in Figure 2, separately. The pat- tern associated with the SEA in 500-hPa geopotential height shows only minor differences between the two sets of years. On the other hand, when looking at precipitation (Figure 4b,d), it is only in epochs when the correlation between the PCD and SEA is significant that the rainfall anomalies associated with the PCD can be seen, despite the presence of a link between the SEA and the PCD when looking at the full 700-year time series (Figure 1c).
Wulff et al. (2017) noticed that the relationship between the PCD and the SEA in the ERA-Interim reanalysis is related to ENSO, with the positive phase of the SEA being linked to the development of an El Nino.
The same behaviour is found in the model. This is
F I G U R E 4 Regression of summer (JJA) mean anomalies of (a, c) 500-hPa geopotential height and (b, d) precipitation against the SEA index using (a, b) the years indicated by green and (c, d) by grey shading in Figure 2, corresponding to 51-year windows with significant (green) or no (grey) correlation between the SEA and the PCD indices, respectively. The solid lines highlight the regions of statistical significance at the 95% level based on a Student'sttest, assuming all years are independent. The boxes used to define the PCD index are shown in red (the Caribbean) and blue (the Pacific)
illustrated by the correlation of the PCD index and the following winter (November–March; NDJFM) mean SST anomalies in the Niño3.4 region, a measure for ENSO (Trenberth and Stepaniak, 2001). For the 700 years of the model run this is 0.41 compared to 0.52 in the ERA5 reanalysis for the years 1979–2020, both significantly dif- ferent from 0 at the 95% level. Further information on the performance of ENSO in the model can be found in Data S1, where the relationship between the PCD and following winter Niño3.4 indices in both the historical run and the ERA20C reanalysis is also presented.
Concerning the underlying reason for the breakdown in the relationship between the SEA and the PCD in some multidecadal epochs, we note that there does not seem to be any significant difference in the mean atmo- spheric circulation between the green and the grey years in Figure 2 (see Rieke, 2018), suggesting that the explana- tion for the nonstationarity does not reside in different wave propagation characteristics between the two sets of years. To find an explanation, we turn now to the statisti- cal model.
4 | A SIMPLE STATISTICAL MODEL
Figure S1a shows power spectra for the SEA and PCD indices from the model simulation. The SEA index
cannot be distinguished from white noise, whereas the PCD index exhibits a red spectrum with more/less power than the SEA index at low/high frequencies. Given that the PCD is associated with ENSO, this difference is not surprising. We also know that the PCD influences the SEA given that the correlation between the two indices over the full 700 years of the model run at 0.15 is signifi- cantly different from 0 at the 95% level and given the sim- ilarity of their teleconnection patterns, as shown in Figures 1a and 3a. This motivates us to model the SEA index, which we denotesi, as a white noise process, ϵi, plus an influence from the PCD represented by αpi, where α is a multiplying factor that measures the strength of the PCD influence on the SEA and is indepen- dent of time.piis the PCD index and the indexinumbers the years from 1 to 700. We therefore have
si=ϵi+αpi: ð1Þ
Here,ϵiis generated using a random number genera- tor with 700 independent realizations in such a way that theSD of the time series ϵi is 1, the same as that of the SEA index from the model, andpiis the PCD index from the model (whoseSDis also 1). For a given value ofα, we now have a 700 year time series of our constructed SEA index, si plus the 700 years of the PCD time series from the model. Figure 5 shows the results from a running cross-correlation analysis between si and pi in 51-year
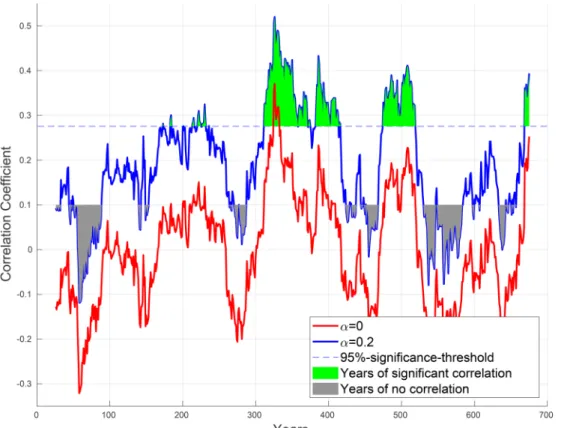
F I G U R E 5 The running cross-correlation in 51-year windows between the SEA and the PCD indices from the statistical model forα= 0 (red line) andα= 0.2 (blue line). The value for a certain year
represents the value for the 51 years centred on that year.
The dashed blue line shows the 95% significance level obtained using a Student'sttest assuming all years are independent. The green filling indicates years in the case withα= 0.2 with coefficients higher than given by the dashed blue line, grey filling the years with correlation lower than 0.1. The threshold of 0.1 is chosen so that there are roughly the same number of years marked grey as are marked green
6 of 9 RIEKEET AL.
windows, following exactly the procedure used to pro- duce Figure 2. Two cases are shown, one with α = 0, implying no influence from the PCD, and one with α = 0.2 for which the correlation betweensiandpiis 0.17 and hence close to that between the SEA and PCD indices using the full 700 years of model output. Both cases use the same realization for the random time seriesϵi. In the case withα= 0, the cross-correlation fluctuates about 0, as one would expect, but for the case with α = 0.2, the whole cross-correlation time series is shifted upwards so that negative correlations become rare and there are now episodes of significant correlation. Indeed, the cross- correlation time series for the case withα= 0.2 has very similar behaviour to the cross-correlation time series from the model run shown in Figure 2. Further analysis of the statistical model is given in Data S1.
5 | SUMMARY AND CONCLUSIONS
Wulff et al. (2017) identified a link between a tropical precipitation dipole, the Pacific-Caribbean Dipole (PCD), and what they identify as the summer East Atlantic (SEA) pattern. The SEA influences European summer weather and, in its positive phase, can be associated with European summer heatwaves.
By analysing a 700-year pre-industrial run using the MPI-ESM-LR model (see section 2), we found that the link between the PCD and SEA is nonstationary, being present in some 51-year windows and not in others. We used a simple statistical model to illustrate this behaviour.
In the simple model, the SEA index is modelled as a white noise process with an additional weak influence from the PCD that is set by the correlation of 0.15 between the SEA and the PCD indices over the full 700 years of the model run. A cross-correlation analysis between the SEA and PCD indices using 51-year running windows then shows very similar behaviour to that seen in the model, with some 51-year windows showing a correlation exceeding the 95% significance level, and some showing little or no correlation. The results imply that when an extratropical mode of variability, such as the SEA, is weakly influenced by another (potentially predictable) mode of variability, for example, the PCD, we should expect decades when the link between the two modes is relatively strong, and hence useful for prediction, and decades when the link is missing and not useful for prediction.
Although our analysis has been applied to the link between the SEA and the PCD, the same statistical model can be applied to the winter NAO. As pointed out by Scaife et al. (2017), the success at predicting the winter NAO index demonstrated by Scaifeet al. (2014) depends
heavily on the ability to predict tropical rainfall anoma- lies, especially associated with ENSO, and simulating their subsequent link to the NAO. We note that the winter NAO has a weakly red (almost white) spectrum (Wunsch, 1999) and that the correlation between the winter (here December/January/February; DJF) NAO and DJF mean Niño3.4 SST indices is−0.13 for the years 1900–2020 (see Data S1 for the data sources), and so is similar to that between the SEA and the PCD indices over the 700 years of the model run. The statistical model therefore suggests there will be decades when the link between the NAO and ENSO-related tropical rainfall anomalies is signifi- cant, and useful for prediction, and decades when that link is weak and hence not useful for prediction. It is nota- ble that other authors have argued that skill at predicting the winter NAO, for example, Weisheimer et al. (2018), and even the Pacific North American pattern (O'Reilly, 2018) varies on multidecadal time scales, similar to what we are finding here. Furthermore, Greatbatch and Jung (2007), who studied the epochs 1982–2001 and 1962–1981, found a link between the winter NAO and tropical Pacific diabatic heating during 1982–2001 but not during 1962–1981, a difference that could not be explained by a difference in the extratropical flow regime.
In Data S1, we briefly analyse the link between the SEA and the PCD in the 20th century reanalysis ERA20C (Poliet al., 2016) and in a historical run using the MPI- ESM-LR model. In the reanalysis, the link between the SEA and the PCD is present only in recent decades, although there is the suggestion that it was also present early in the 20th century. In the historical run, there is the suggestion of a link between the SEA and the PCD emerging during the 20th century part of the model run but this is a weaker signal than in the pre-industrial run.
In conclusion, our results show that the potential for predictive skill at mid-latitudes based on tropical rainfall may be subject to multidecadal modulation. Of course, a limitation of our study is that we have used a relatively coarse resolution climate model, the MPI-ESM-LR, to demonstrate the nonstationarity, certainly coarser than models typically used for seasonal and multiyear predic- tion (e.g., Scaifeet al., 2014; Dunstone et al., 2018). Nev- ertheless, the simple, statistical model can reproduce the nonstationary behaviour we have reported.
Finally, O'Reilly et al. (2019) note a shift in the tele- connection from the tropical Pacific during boreal sum- mer, the season we have been concerned with in this paper, which they claim is related to the warming trend in tropical SST that is being driven by increasing green- house gas concentrations in the atmosphere. In our case, the model run we have used uses pre-industrial forcing, thereby excluding the effect of increasing greenhouse gas concentrations, emphasising that even without
anthropogenic climate change, teleconnections from the Tropics to the extratropics need not be robust on inter- decadal time scales.
ACKNO WLEDGEMENTS
The data used in this study can be obtained at https://
doi.org/10.5281/zenodo.4432354. Comments from two anonymous reviewers led to considerable improvement in the manuscript. We are also grateful to Johann Jun- gclaus for making the historical run available to us. Open access funding enabled and organized by Projekt DEAL.
CONFLICT OF INTEREST
The authors declare no potential conflict of interest.
ORCID
Ole Rieke https://orcid.org/0000-0002-5854-6220 Richard J. Greatbatch https://orcid.org/0000-0001- 5758-2249
Gereon Gollan https://orcid.org/0000-0002-8329-4168
REFERENCES
Barnston, A.G. and Livezey, R.E. (1987) Classification, seasonality and persistence of low-frequency atmospheric circulation pat- terns.Monthly Weather Review, 115, 1083–1126.
Dee, D.P., Uppala, S.M., Simmons, A.J., Berrisford, P., Poli, P., Kobayashi, S., Andrae, U., Balmaseda, M.A., Balsamo, G., Bauer, P., Bechtold, P., Beljaars, A.C.M., van de Berg, L., Bidlot, J., Bormann, N., Delsol, C., Dragani, R., Fuentes, M., Geer, A.J., Haimberger, L., Healy, S.B., Hersbach, H., Hólm, E.
V., Isaksen, L., Kållberg, P., Köhler, M., Matricardi, M., Mcnally, A.P., Monge-Sanz, B.M., Morcrette, J.J., Park, B.K., Peubey, C., de Rosnay, P., Tavolato, C., Thépaut, J.-N. and Vitart, F. (2011) The ERA-Interim reanalysis: configuration and performance of the data assimilation system.Quarterly Journal of the Royal Meteorological Society, 137, 553–597.
Duchez, A., Frajka-Williams, E., Josey, S.A., Evans, D.G., Grist, J.P., Marsh, R., McCarthy, G.D., Sinha, B., Berry, D.I. and Hirschi, J.
J. (2016) Drivers of exceptionally cold North Atlantic Ocean temperatures and their link to the 2015 European heat wave.
Environmental Research Letters, 11, 074004.
Dunstone, N., Smith, D., Scaife, A., Hermanson, L., Fereday, D., O'Reilly, C., Stirling, A., Eade, R., Gordon, M., MacLachlan, C., Woollings, T., Sheen, K. & Belcher, S. (2018) Skilful seasonal predictions of summer European rainfall.Geophysical Research Letters, 45, 3246–3254.
Folland, C.K., Knight, J., Linderholm, H.W., Fereday, D., Ineson, S.
and Hurrell, J.W. (2009) The summer North Atlantic Oscillation:
past, present, and future.Journal of Climate, 22, 1082–1103.
Greatbatch, R.J. (2000) The North Atlantic Oscillation.Stochastic Environmental Research and Risk Assessment, 14, 213–242.
Greatbatch, R.J. and Jung, T. (2007) Local versus tropical diabatic heating and the winter North Atlantic Oscillation.Journal of Climate, 20, 2058–2075.
Greatbatch, R.J., Lu, J. and Peterson, K.A. (2004) Nonstationary impact of enso on Euro-Atlantic winter climate. Geophysical Research Letters, 31, 2208.
Greatbatch, R.J. and Rong, P.-P. (2006) Discrepancies between dif- ferent Northern Hemisphere summer atmospheric data prod- ucts.Journal of Climate, 19, 1261–1273.
Hersbach, H., Bell, B., Berrisford, P., Hirahara, S., Horányi, A., Muñoz-Sabater, J., Nicolas, J., Peubey, C., Radu, R., Schepers, D., Simmons, A., Soci, C., Abdalla, S., Abellan, X., Balsamo, G., Bechtold, P., Biavati, G., Bidlot, J., Bonavita, M., Chiara, G., Dahlgren, P., Dee, D., Diamantakis, M., Dragani, R., Flemming, J., Forbes, R., Fuentes, M., Geer, A., Haimberger, L., Healy, S., Hogan, R.J., Hólm, E., Janisková, M., Keeley, S., Laloyaux, P., Lopez, P., Lupu, C., Radnoti, G., Rosnay, P., Rozum, I., Vamborg, F., Villaume, S. and Thépaut, J.N. (2020) The ERA5 global reanalysis. Quarterly Journal of the Royal Meteorological Society, 146, 1999–2049.
Hurrell, J.W., Kushnir, Y., Ottersen, G. and Visbeck, M. (2003) An overview of the North Atlantic Oscillation. In:American Geo- physical Union. Geophysical Monograph. 134, 1–36. https://doi.
org/10.1029/134GM01.
Jungclaus, J., Fischer, N., Haak, H., Lohmann, K., Marotzke, J., Matei, D., Mikolajewicz, U., Notz, D. and Von Storch, J. (2013) Characteristics of the ocean simulations in the Max Planck Institute Ocean Model (MPIOM) the ocean component of the MPI-Earth system model. Journal of Advances in Modeling Earth Systems, 5, 422–446.
Moore, G. and Renfrew, I. (2012) Cold European winters: interplay between the NAO and the East Atlantic mode.Atmospheric Sci- ence Letters, 13, 1–8.
North, G.R., Bell, T.L., Cahalan, R.F. and Moeng, F.J. (1982) Sam- pling errors in the estimation of empirical orthogonal func- tions.Monthly Weather Review, 110, 699–706.
O'Reilly, C.H. (2018) Interdecadal variability of the ENSO teleconnection to the wintertime North Pacific.Climate Dynamics, 51, 3333–3350.
O'Reilly, C.H., Heatley, J., MacLeod, D., Weisheimer, A., Palmer, T.
N., Schaller, N. and Woollings, T. (2017) Variability in seasonal forecast skill of Northern Hemisphere winters over the twenti- eth century.Geophysical Research Letters, 44, 5729–5738.
O'Reilly, C.H., Woollings, T., Zanna, L. and Weisheimer, A. (2018) The impact of tropical precipitation on summertime Euro- Atlantic circulation via a circumglobal wave train.Journal of Climate, 31, 6481–6504.
O'Reilly, C.H., Woollings, T., Zanna, L. and Weisheimer, A. (2019) An interdecadal shift of the extratropical teleconnection from the tropical Pacific during boreal summer.Geophysical Research Letters, 46, 13379–13388.
Ossó, A., Sutton, R., Shaffrey, L. and Dong, B. (2018) Observational evidence of European summer weather patterns predictable from spring.Proceedings of the National Academy of Sciences of the United States of America, 115, 59–63.
Pfahl, S. and Wernli, H. (2012) Quantifying the relevance of atmo- spheric blocking for co-located temperature extremes in the Northern Hemisphere on (sub-) daily time scales.Geophysical Research Letters, 39, L12807.
Poli, P., Hersbach, H., Dee, D.P., Berrisford, P., Simmons, A.J., Vitart, F., Laloyaux, P., Tan, D.G., Peubey, C., Thépaut, J.-N., Tremolet, Y., Holm, E.V., Bonavita, M., Isaksen, L. &
Fisher, M. (2016) Era-20c: an atmospheric reanalysis of the twentieth century.Journal of Climate, 29, 4083–4097.
Rieke, O. (2018)The nonstationarity of the summer East Atlantic pattern and its tropical–extratropical teleconnection. Bachelor
8 of 9 RIEKEET AL.
Thesis, Christian-Albrechts-Universität zu Kiel, Germany.
https://oceanrep.geomar.de/51648/.
Scaife, A., Arribas, A., Blockley, E., Brookshaw, A., Clark, R., Dunstone, N., Eade, R., Fereday, D., Folland, C., Gordon, M., Hermanson, L., Knight, J.R., Lea, D.J., MacLachan, C., Maidens, A., Martin, M., Peterson, K.A., Smith, D., Vellinga, M., Wallace, E., Waters, J. and Williams, A. (2014) Skillful long-range prediction of european and north american winters.Geophysical Research Letters, 41, 2514–2519.
Scaife, A.A., Comer, R.E., Dunstone, N.J., Knight, J.R., Smith, D.
M., MacLachlan, C., Martin, N., Peterson, K.A., Rowlands, D., Carroll, E.B., Belcher, S., and Slingo, J. (2017) Tropical rainfall, rossby waves and regional winter climate predictions.Quarterly Journal of the Royal Meteorological Society, 143, 1–11.
Scaife, A.A., Ferranti, L., Alves, O., Athanasiadis, P., Baehr, J., Dequé, M., Dippe, T., Dunstone, N., Fereday, D., Gudgel, R.G., Greatbatch, R.J., Hermanson, L., Imada, Y., Jain, S., Kumar, A., MacLachlan, C., Merryfield, W., Müller, W.A., Ren, H.-L., Smith, D., Takaya, Y., Vecchi, G. and Yang, X. (2019) Tropical rainfall predictions from multiple seasonal forecast systems.
International Journal of Climatology, 39, 974–988.
Stevens, B., Giorgetta, M., Esch, M., Mauritsen, T., Crueger, T., Rast, S., Salzmann, M., Schmidt, H., Bader, J., Block, K., Brokopf, R., Fast, I., Kinne, S., Kornblueh, L., Lohmann, U., Pincus, R., Reichler, T. and Roeckner, E. (2013) Atmospheric component of the MPI-M earth system model: ECHAM6.Jour- nal of Advances in Modeling Earth Systems, 5, 146–172.
Trenberth, K.E. and Stepaniak, D.P. (2001) Indices of El Niño evo- lution.Journal of Climate, 14, 1697–1701.
Weisheimer, A., Decremer, D., MacLeod, D., O'Reilly, C., Stockdale, T.N., Johnson, S. and Palmer, T.N. (2018) How con- fident are predictability estimates of the winter North Atlantic Oscillation?Quarterly Journal of the Royal Meteorological Soci- ety. 145(Suppl. 1), 140–159.
Wulff, C.O., Greatbatch, R.J., Domeisen, D.I., Gollan, G. and Hansen, F. (2017) Tropical forcing of the summer East Atlantic pattern.Geophysical Research Letters, 44, 11166–11173.
Wunsch, C. (1999) The interpretation of short climate records, with comments on the North Atlantic and Southern Oscillations.
Bulletin of the American Meteorological Society, 80, 245–256.
SUPPORTING INFORMATION
Additional supporting information may be found online in the Supporting Information section at the end of this article.
How to cite this article:Rieke O, Greatbatch RJ, Gollan G. Nonstationarity of the link between the Tropics and the summer East Atlantic pattern.
Atmos Sci Lett. 2021;22:e1026.https://doi.org/10.
1002/asl.1026