M. Aker,1 K. Altenm¨uller,2, 3 A. Beglarian,4 J. Behrens,5, 6 A. Berlev,7U. Besserer,1 B. Bieringer,8 K. Blaum,9 F. Block,5 B. Bornschein,1 L. Bornschein,6 M. B¨ottcher,8 T. Brunst,2, 10 T. S. Caldwell,11, 12 L. La Cascio,5
S. Chilingaryan,4 W. Choi,5 D. D´ıaz Barrero,13 K. Debowski,14 M. Deffert,5 M. Descher,5 P. J. Doe,15 O. Dragoun,16 G. Drexlin,5 S. Dyba,8 F. Edzards,2, 10 K. Eitel,6 E. Ellinger,14 R. Engel,6 S. Enomoto,15 M. Fedkevych,8 A. Felden,6 J. A. Formaggio,18F. M. Fr¨ankle,6 G. B. Franklin,19 F. Friedel,5 A. Fulst,8 K. Gauda,8
W. Gil,6 F. Gl¨uck,6 R. Gr¨ossle,1 R. Gumbsheimer,6 T. H¨ohn,6 V. Hannen,8 N. Haußmann,14 K. Helbing,14 S. Hickford,5 R. Hiller,5 D. Hillesheimer,1 D. Hinz,6 T. Houdy,2, 10 A. Huber,5 A. Jansen,6 L. K¨ollenberger,6 C. Karl,2, 10 J. Kellerer,5 L. Kippenbrock,15M. Klein,6, 5 A. Kopmann,4 M. Korzeczek,5 A. Koval´ık,16B. Krasch,1
H. Krause,6 T. Lasserre,3,∗ T. L. Le,1 O. Lebeda,16 B. Lehnert,20 A. Lokhov,8, 7 J. M. Lopez Poyato,13 K. M¨uller,6 M. Machatschek,5 E. Malcherek,6 M. Mark,6 A. Marsteller,1 E. L. Martin,11, 12 C. Melzer,1 S. Mertens,2, 10 S. Niemes,1 P. Oelpmann,8 A. Osipowicz,21D. S. Parno,19,† A. W. P. Poon,20 F. Priester,1 M. R¨ollig,1 C. R¨ottele,1, 6, 5O. Rest,8R. G. H. Robertson,15 C. Rodenbeck,8 M. Ryˇsav´y,16 R. Sack,8 A. Saenz,22 A. Schaller (n´ee Pollithy),2, 10 P. Sch¨afer,1 L. Schimpf,5 K. Schl¨osser,6 M. Schl¨osser,1 L. Schl¨uter,2, 10 M. Schrank,6 B. Schulz,22M. ˇSefˇc´ık,16 H. Seitz-Moskaliuk,5 V. Sibille,18 D. Siegmann,2, 10 M. Slez´ak,2, 10 F. Spanier,6 M. Steidl,6
M. Sturm,1 M. Sun,15 H. H. Telle,13 T. Th¨ummler,6 L. A. Thorne,19 N. Titov,7 I. Tkachev,7 N. Trost,6 D. V´enos,16 K. Valerius,6 A. P. Vizcaya Hern´andez,19 S. W¨ustling,4 M. Weber,4 C. Weinheimer,8 C. Weiss,23
S. Welte,1J. Wendel,1 J. F. Wilkerson,11, 12 J. Wolf,5 W. Xu,18 Y.-R. Yen,19 S. Zadoroghny,7 and G. Zeller1 (KATRIN Collaboration)
1Tritium Laboratory Karlsruhe (TLK), Karlsruhe Institute of Technology (KIT), Hermann-von-Helmholtz-Platz 1, 76344 Eggenstein-Leopoldshafen, Germany
2Technische Universit¨at M¨unchen, James-Franck-Str. 1, 85748 Garching, Germany
3IRFU (DPhP & APC), CEA, Universit´e Paris-Saclay, 91191 Gif-sur-Yvette, France
4Institute for Data Processing and Electronics (IPE), Karlsruhe Institute of
Technology (KIT), Hermann-von-Helmholtz-Platz 1, 76344 Eggenstein-Leopoldshafen, Germany
5Institute of Experimental Particle Physics (ETP), Karlsruhe Institute of Technology (KIT), Wolfgang-Gaede-Str. 1, 76131 Karlsruhe, Germany
6Institute for Astroparticle Physics (IAP), Karlsruhe Institute of Technology (KIT), Hermann-von-Helmholtz-Platz 1, 76344 Eggenstein-Leopoldshafen, Germany
7Institute for Nuclear Research of Russian Academy of Sciences, 60th October Anniversary Prospect 7a, 117312 Moscow, Russia
8Institut f¨ur Kernphysik, Westf¨alische Wilhelms-Universit¨at M¨unster, Wilhelm-Klemm-Str. 9, 48149 M¨unster, Germany
9Max-Planck-Institut f¨ur Kernphysik, Saupfercheckweg 1, 69117 Heidelberg, Germany
10Max-Planck-Institut f¨ur Physik, F¨ohringer Ring 6, 80805 M¨unchen, Germany
11Department of Physics and Astronomy, University of North Carolina, Chapel Hill, NC 27599, USA
12Triangle Universities Nuclear Laboratory, Durham, NC 27708, USA
13Departamento de Qu´ımica F´ısica Aplicada, Universidad Autonoma de Madrid, Campus de Cantoblanco, 28049 Madrid, Spain
14Department of Physics, Faculty of Mathematics and Natural Sciences, University of Wuppertal, Gaußstr. 20, 42119 Wuppertal, Germany
15Center for Experimental Nuclear Physics and Astrophysics, and Dept. of Physics, University of Washington, Seattle, WA 98195, USA
16Nuclear Physics Institute of the CAS, v. v. i., CZ-250 68 ˇReˇz, Czech Republic
17Institute for Technical Physics (ITEP), Karlsruhe Institute of Technology (KIT), Hermann-von-Helmholtz-Platz 1, 76344 Eggenstein-Leopoldshafen, Germany
18Laboratory for Nuclear Science, Massachusetts Institute of Technology, 77 Massachusetts Ave, Cambridge, MA 02139, USA
19Department of Physics, Carnegie Mellon University, Pittsburgh, PA 15213, USA
20Institute for Nuclear and Particle Astrophysics and Nuclear Science Division, Lawrence Berkeley National Laboratory, Berkeley, CA 94720, USA
21University of Applied Sciences (HFD) Fulda, Leipziger Str. 123, 36037 Fulda, Germany
22Institut f¨ur Physik, Humboldt-Universit¨at zu Berlin, Newtonstr. 15, 12489 Berlin, Germany
23Project, Process, and Quality Management (PPQ), Karlsruhe Institute of Technology (KIT), Hermann-von-Helmholtz-Platz 1, 76344 Eggenstein-Leopoldshafen, Germany
(Dated: May 13, 2021)
We report on the data set, data handling, and detailed analysis techniques of the first neutrino- mass measurement by the Karlsruhe Tritium Neutrino (KATRIN) experiment, which probes the absolute neutrino-mass scale via theβ-decay kinematics of molecular tritium. The source is highly pure, cryogenic T2 gas. The β electrons are guided along magnetic field lines toward a high- resolution, integrating spectrometer for energy analysis. A silicon detector countsβelectrons above
arXiv:2101.05253v3 [hep-ex] 12 May 2021
the energy threshold of the spectrometer, so that a scan of the thresholds produces a precise measure- ment of the high-energy spectral tail. After detailed theoretical studies, simulations, and commis- sioning measurements, extending from the molecular final-state distribution to inelastic scattering in the source to subtleties of the electromagnetic fields, our independent, blind analyses allow us to set an upper limit of 1.1 eV on the neutrino-mass scale at a 90% confidence level. This first result, based on a few weeks of running at a reduced source intensity and dominated by statistical uncertainty, improves on prior limits by nearly a factor of two. This result establishes an analysis framework for future KATRIN measurements, and provides important input to both particle theory and cosmology.
CONTENTS
I. Introduction 2
II. KATRIN experimental setup 4
III. The KNM1 measurement campaign 6
A. Tritium source parameters 6
B. Column density 6
C. Electron starting potential 7
D. Analyzing-plane potentials 9
E. Electron counting and region of interest 9
F. Data pipeline 10
G. Acquisition of the integralβdecay
spectrum 11
IV. Tritium-spectrum modeling 12
A. Theoreticalβ-spectrum of molecular
tritium 12
B. Final-state distribution (FSD) 13 1. Solutions to the molecular Schr¨odinger
equation 13
2. Energy-resolved FSD 14
V. Response function modeling 14
A. Response and transmission functions 15 B. Inelastic-scattering cross section 15
C. Energy-loss function 16
VI. Background 17
A. Steady-State Background 17
B. Background Dependence on Scan-Step
Duration 19
VII. Assembling spectral data for KNM1 19
A. Pixel combination 19
B. Scan combination (stacking) 20 C. Resulting integral spectrum 20
VIII. Systematic uncertainties 20
A. Tritium concentration 21
B. Column density and expected number of
scatterings 21
C. Electron starting potential 21
∗thierry.lasserre@cea.fr
†dparno@cmu.edu
D. Detector efficiency 22
E. Final-state distribution 22
F. Response function 23
G. Background 23
H. Stacking 23
I. Neutrino-mass fit range 24
IX. Spectral fit 24
A. Blinding strategy 24
B. Covariance-matrix approach 25 C. Monte-Carlo-propagation approach 26
D. Fit results 27
X. Frequentist bounds on the neutrino mass 27 XI. Bayesian bound on the neutrino mass 28
XII. Q-value measurement 30
XIII. Results and discussion 31
XIV. Conclusion 32
Acknowledgments 32
References 32
I. INTRODUCTION
The absolute mass scale of the neutrino remains a key open question in contemporary physics, with far- reaching implications from cosmology to elementary par- ticle physics. Despite numerous efforts along three com- plementary lines of approach (observational cosmology, the search for neutrinoless double-β decay, and direct searches using the kinematics of weak-interaction pro- cesses such as singleβ decay or electron capture), only upper bounds on the neutrino mass have been found so far (see,e.g., [1–3] for reviews on these subjects). Mean- while, neutrino flavor-oscillation experiments (e.g., [4, 5]) have firmly established the existence of non-zero neutrino masses.
With the advent of precision cosmology, correspond- ing bounds on neutrino masses have been dramatically improved, and now form the tightest constraints avail- able. Yet, cosmological bounds on P
mi (the sum of the distinct neutrino-mass eigenvalues mi) are derived using the paradigm of the cosmological standard model
(ΛCDM), and the values obtained vary with the selec- tion of data sets included in the analysis. The Planck collaboration has inferred robust bounds from cosmic- microwave-background power spectra alone: Pmi <
0.26 eV (95 % confidence level, CL), which can be further improved toP
mi<0.12 eV (95 % CL) by including lens- ing and baryon-acoustic-oscillation data [6]. Meanwhile, laboratory searches for neutrinoless double-β decay are sensitive to the neutrino-mass scale, under the assump- tion that neutrinos are Majorana particles that make the dominant contribution to the decay mechanism. Here, the observable is the coherent sum of weighted neutrino mass valueshmββi=|P
Uei2mi|, where Uei denotes the electron-flavor element coupled to the ith neutrino-mass state in the neutrino mixing matrix. Presently, the most sensitive limits on hmββi are set by searches in 76Ge (GERDA, 0.07 - 0.16 eV) [7] and in136Xe (KamLAND- Zen, 0.06 - 0.17 eV) [8]. The ranges of these 90% con- fidence limits arise from uncertainties in nuclear-matrix elements.
Direct laboratory-based measurements are an indis- pensable model-independent probe of the neutrino-mass scale, resting solely on the determination of kinematic pa- rameters. Two weak processes particularly suitable for this quest are the electron capture of 163Ho [9, 10] and theβdecay of tritium:
T→3He++β−+ ¯νe. (1) The kinematics of these decays provide access to the effective neutrino-mass square value, an incoherent sum over the weighted squares of the mass values mi (i = 1,2,3):
m2ν =X
i
|Uei|2m2i. (2) Historically, the Mainz and Troitsk experiments used tritium to set the previous most stringent direct upper limit at mν < 2 eV (95 % CL) [11, 12] with a high- accuracy shape measurement of the β-decay spectrum in the vicinity of its kinematic endpoint (E0= 18.57 keV for molecular tritium, T2). Meanwhile, the mass split- tings measured in oscillation experiments impose a lower limit on this observable. Depending on the ordering of the pattern of neutrino-mass eigenstates νi, this floor is either approximately 8 meV (normal ordering) or 50 meV (inverted ordering) – see,e.g., Ref. [13].
The Karlsruhe Tritium Neutrino (KATRIN) experi- ment [14, 15] is further improving this approach to target a neutrino-mass sensitivity of 0.2 eV (90 % CL) after five years of measurement time; note the change to 90% confi- dence level. This goal requires an improvement of about two orders of magnitude in the m2ν observable. To ac- complish this challenging measurement, KATRIN relies on the proven technology of the MAC-E filter (Magnetic Adiabatic Collimation with an Electrostatic filter, devel- oped for neutrino-mass measurements by the Mainz and Troitsk groups [16, 17]) and a large β-decay luminosity
provided by a gaseous molecular tritium source (following pioneering work at the Los Alamos experiment [18]). Af- ter commissioning and characterizing the complex 70 m- long electron beamline, initially with monoenergetic cal- ibration sources [19] and subsequently with first-tritium βelectrons [20], the KATRIN collaboration has recently reported an improved upper limit on the neutrino mass ofmν <1.1 eV (90 % CL) based on an initial four-week science run [21]. This result yields an improvement of about a factor of two with respect to the best previous direct bound.
In this work, we present a detailed account of the data set acquired, data-handling and analysis techniques ap- plied, and statistical inference methods employed to de- rive this result. In the following we will use the term
“KATRIN Neutrino Mass run 1” (KNM1) to label the in- augural four-week science campaign that marks the first operation of KATRIN at high tritium purity, at about a quarter of the nominal tritium source strength. During KNM1, an integrated β spectrum was acquired over a
“full” energy interval stretching from about 90 eV be- low to about 50 eV above the endpoint E0. The ac- tual neutrino-mass analysis was performed in a narrower interval, [E0–37 eV, E0+49 eV], in which the measure- ment is statistics-dominated. Within this 86 eV analy- sis interval, the data set comprises a total ensemble of 2.03×10⁶events after data-quality selection cuts. The ensemble was collected over a measurement time of 521.7 h and is composed of 1.48×10⁶ βdecay electrons belowE0and 0.55×10⁶events in a flat background over the entire analysis interval.
We begin this paper with an overview of the exper- imental setup (Sec. II) and the configuration in which the KATRIN beamline was operated, including data han- dling and measurement strategy (Sec. III). (For reference, Table I lists abbreviations frequently used in this pa- per.) Two key ingredients of the analysis, theβ-spectrum model and the instrument response function, are pre- sented in Secs. IV and V. Section VI summarizes relevant sources of background and their characteristics. General underlying principles of the analysis, in which data from the individual detector pixels andβ-spectrum scans are combined into a single spectrum for fitting, are given in Sec. VII.
Section VIII presents a detailed assay of individual sys- tematic uncertainties. Section IX documents the strat- egy employed for blind analysis, describes two comple- mentary methods employed to propagate the systematic uncertainties into the neutrino-mass fit, and shows the resulting spectral fit and uncertainty breakdown. Sec- tion X details the construction of the confidence belt and the derivation of the neutrino-mass upper limit via the Feldman-Cousins [22] and the Lokhov-Tkachov [23] ap- proaches. Our Lokhov-Tkachov result of mν < 1.1 eV (90 % CL), presented in Ref. [21], was obtained using Frequentist methods. In this work we also present a derivation of the upper limit based on Bayesian meth- ods, yielding a limit ofmν <0.9 eV (90% C.I.) (Sec. XI).
TABLE I. Acronyms and abbreviations used in this work.
ADC Analog-to-Digital Converter
CL Confidence Level
cps counts per second DAQ Data-Acquisition System d.o.f. degree(s) of freedom e-gun electron gun
FSD molecular Final-State Distribution FPD Focal-Plane Detector
HV High Voltage
KNM1 KATRIN Neutrino Mass run 1 LARA LAser RAman spectroscopy system ΛCDM Λ Cold-Dark Matter model
(cosmological standard model) MAC-E filter Magnetic Adiabatic Collimation with
Electrostatic filter
MC Monte Carlo
ppm part per million
p-value Probability of achieving a result as extreme as the one found, through statistical fluctuation
Q-value Kinetic energy released in tritiumβdecay (for zero neutrino mass)
ROI Region of Interest TOF Time of Flight
WGTS Windowless Gaseous Tritium Source
This method uses a different approach to deal with the unphysical region of negative neutrino-mass squared.
In Sec. XII, as a consistency check of KATRIN’s ab- solute energy scale, we show that the effective endpoint valueE0obtained from the fit to theβspectrum agrees with independent measurements of the Q-value through the3He-T mass difference.
We conclude by summarizing our findings (Sec. XIII) and discussing them in the wider context of contempo- rary neutrino-mass probes (Sec. XIV).
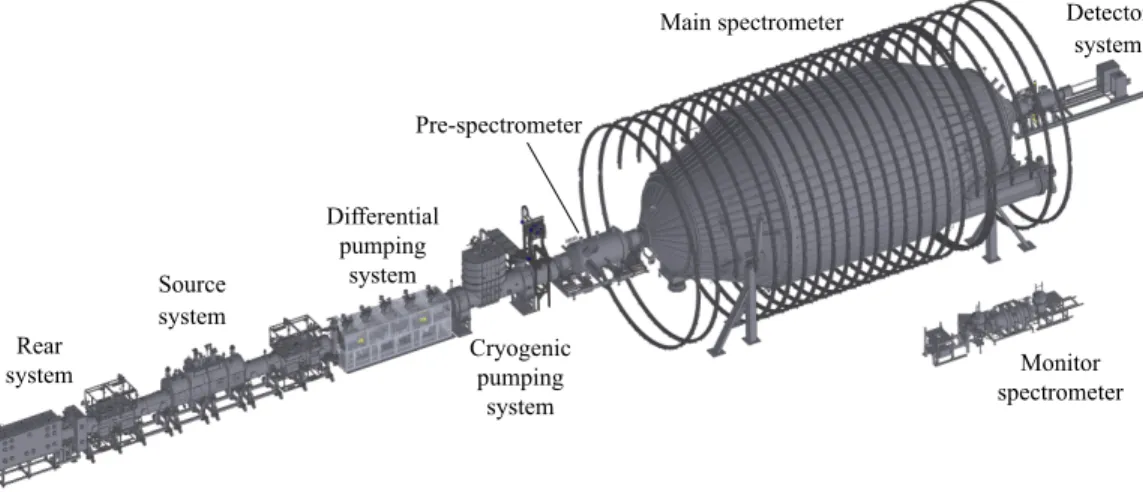
II. KATRIN EXPERIMENTAL SETUP Figure 1 gives an overview of the KATRIN apparatus.
Briefly, in order to ensure sufficient statistics, a bright tri- tium source produces some 2.45×10¹⁰ decays each sec- ond in the KNM1 configuration. In order to perform a fine-grained energy analysis near the tritium endpoint, the energies of the resultingβelectrons are analyzed by a pair of MAC-E-filter spectrometers [16, 17]. These ba- sic functions require the support of extensive systems for handling the tritium gas, maintaining vacuum conditions, ensuring adiabatic electron transport, mitigating or elim- inating backgrounds, detectingβelectrons, and calibrat- ing and monitoring the apparatus as a whole. The re- sulting 70 m beamline is described in detail in Ref. [24];
here, we offer a brief summary.
T2 gas from a temperature- and pressure-controlled buffer vessel at 313 K is cooled to 30 K and continuously injected via a capillary into the center of the source sys-
tem. The resulting Windowless Gaseous Tritium Source (WGTS) freely streams to both ends of the system, where it is continuously pumped away with turbomolecular pumps. This results in a stable pressure distribution inside the source beam tube [25]. Once the T2 gas is pumped away, it flows over a PdAg membrane filter that is permeable only to hydrogen isotopes. A constant frac- tion of the circulating gas is also removed at this stage for later purification, and is replaced with highly pure T2 directly after the filter. The purified gas is fed back to the temperature- and pressure-controlled buffer vessel, forming a closed loop. The loop system is integrated with the infrastructure of the Tritium Laboratory Karlsruhe, which provides tritium purification of exhaust gas, tri- tium storage, and fresh tritium supply for KATRIN [26–
28].
Within the 10 m-long, 90 mm-diameter source beam tube [29], tritium decays produce β electrons that are guided along magnetic field lines [30] through the rest of the experimental beamline. At the upstream end, the WGTS terminates in a gold-plated rear wall, which can be held at a fixed potential and/or illuminated with ul- traviolet light to liberate photoelectrons. At the down- stream end, the windowless nature of the source is es- sential to avoid catastrophic energy loss, but necessitates other means for the confinement of tritium. Theβelec- trons are first guided around magnetic chicanes through two pumping stages, namely a differential pumping sys- tem and a cryogenic pumping system, which collectively reduce the partial pressure of tritium by more than 14 or- ders of magnitude [31]. Specially designed electrodes within the differential stage [32] prevent the transmission of tritium ions.
βelectrons must then pass through a pair of MAC-E- filter spectrometers, operated in tandem. Each MAC-E filter is characterized by strong magnetic fields at the entrance and exit, with a region of weak magnetic field in the center. Since the magnetic moment is conserved in the adiabatic transport of the electrons through the beamline, the electron momenta rotate to become ap- proximately parallel to the magnetic field lines, produc- ing a broad, roughly collimated beam. A longitudinal re- tarding potential therefore analyzes the total kinetic en- ergy of the electrons at the central “analyzing plane,” at which the magnetic field is the weakest. Electrons below the resulting energy threshold are reflected upstream, to- ward the source; electrons above the energy threshold are transmitted downstream, toward the spectrometer exit.
The transmission function of the spectrometers was ex- tensively calibrated prior to the measurement (Sec. V).
The first MAC-E filter in the tandem pair, the pre- spectrometer [33], has a fixed energy threshold at 10 keV and removes the bulk of the low-energy electrons. Im- mediately downstream, the main spectrometer is the high-resolution, adjustable-threshold filter that analyzes the integral β spectrum. Each data-taking “scan”
(Sec. III G) consists of a sequence of main-spectrometer retarding-potential settings, with a new threshold of in-
Main spectrometer
Rear system
Source system
Differential pumping
system
Detector system
Monitor spectrometer Cryogenic
pumping system Pre-spectrometer
FIG. 1. Overview of the 70 m KATRIN beamline. Moving downstream, from left to right, the major components are: the rear system, the source system, the differential pumping system, the cryogenic pumping system, the pre-spectrometer, the main spectrometer, and the detector system. The monitor spectrometer monitors the retarding potential of the main spectrometer.
tegration at each setting. The electropolished interior stainless-steel surface of the main spectrometer is lined with two layers of inner, wire electrodes, providing fine shaping of the electric fields and, when operated at a negative potential offset from the main-spectrometer ves- sel, electrostatic rejection of low-energy secondary elec- trons from the main-spectrometer surface [34]. The ves- sel potential is supplied by a commercial system, with additional regulation and post-regulation designed and built by the collaboration to suppress 50 Hz mains noise and other sources of interference [35]. Air-cooled mag- netic coils, mounted on a framework surrounding the main spectrometer, compensate for the Earth’s magnetic field, fringe fields of the solenoids, and residual magneti- zation [36]. The ultra-high vacuum in the spectrometer is maintained by non-evaporable getter strips and tur- bomolecular pumps [37]. Liquid-nitrogen-cooled copper baffles are positioned across the pump ports to suppress background electrons due to radon decay in the main vol- ume [38, 39]. To mitigate backgrounds from the Penning trap between the two MAC-E filters, a conductive elec- tron catcher is inserted into the inter-spectrometer region at each change in the set voltage of the main spectrom- eter [40]. This device removes trapped electrons that would produce secondary ions and electrons.
Electrons that pass through the main spectrometer un- dergo additional acceleration via the post-acceleration electrode, improving rejection of non-spectrometer back- grounds. When they reach the detector system, they are counted in the focal-plane detector (FPD) [41], a monolithic siliconp-i-n diode segmented into 148 equal- area pixels. The FPD and its readout electronics are elevated to the post-acceleration potential, and pream- plified signals are transmitted to the data-acquisition (DAQ) system via optical fiber. Each FPD pulse is digitized in a 12-bit analog-to-digital converter (ADC), and its amplitude and timing are reconstructed on- line by the sequential application of two trapezoidal fil-
ters [41, 42]. These values are then recorded using the Object-oriented Real-time Control and Acquisition (ORCA) framework [43], which can also communicate directly with the main-spectrometer high-voltage sys- tem using a web-based database tool [44]. Pulse ampli- tudes are translated into energies in near-time processing (Sec. III F), based on the results of regular calibration runs with an241Am photon source.
Multiple calibration and monitoring systems provide essential information during both neutrino-mass scans and dedicated runs [45]. In the tritium loops feeding the source, a laser-Raman spectroscopy system (LARA) [46–
48] monitors the relative concentrations of hydrogen iso- topologs, particularly T2, DT, and HT, within the source gas. In the rear system upstream of the source, an elec- tron gun (e-gun), following the design of a similar e-gun used for testing the main spectrometer [49], serves as an angle- and energy-selective calibration source. This e- gun delivers electrons through an aperture in the rear wall at the upstream end of the source. Observed in the FPD, these electrons test the response function of the experiment as a whole. Two radioactive, in-vacuum calibration sources are also available: gaseous83mKr that can be circulated within the source when its temperature is elevated to about 100 K [50], and a condensed83mKr source that can be inserted into the cryogenic pumping system [51].
Upstream of the rear wall, the β-induced x-ray spec- troscopy system continuously monitors the source activ- ity: silicon drift detectors view x-rays produced by β electrons scattering in the rear wall [52]. Further down- stream, within the cryogenic pumping system, a forward beam monitor provides complementary activity monitor- ing [53]. This monitor includes two siliconp-i-n diodes for electron rate and spectrum measurements, a Hall sen- sor, and a temperature gauge. A vacuum manipulator allows these sensors to be positioned radially within the beam; normally, the forward beam monitor is positioned
at the outer edge of theβelectron flux.
The main-spectrometer retarding potential, which de- fines the energy analysis, is continuously monitored both by a voltage divider with demonstrated part-per-million (ppm) precision [54–57] and by the refurbished MAC-E filter from the historical Mainz experiment [11]. Now relocated to KATRIN, this monitor spectrometer refer- ences the main-spectrometer retarding potential to an atomic standard via synchronous scans of a 83mKr con- version line [58].
Prior to the KNM1 neutrino-mass run, the full KA- TRIN beamline was commissioned with photoelectrons, ions, and 83mKr conversion electrons in 2016–2017 [19], and with small amounts of tritium in D2 carrier gas in 2018 [20]. Subsequently, in another campaign with D2, the electron gun was commissioned and gas properties of the source were investigated [59]. KNM1 marked the first time that the inner surfaces of the injection capil- lary and source system were exposed to large amounts of tritium. Radiochemical reactions between T2 and these metal surfaces produced both CO and tritiated methane, which condensed on the cold metal surface of the cap- illary and partially obstructed tritium flow over time.
To improve stability during this burn-in period, KA- TRIN operated at a reduced column density of ρdexp = 1.11×10¹⁷molecules/cm2.
III. THE KNM1 MEASUREMENT CAMPAIGN In this section we describe the operating conditions of the KATRIN experiment during its first high-purity tritium campaign (KNM1), which took place from 10th April to 13th May 2019. In particular, we characterize the system performance in terms of the source-gas iso- topic purity (Sec. III A) and column density (Sec. III B), as well as the reproducibility, homogeneity, and sta- bility of the electron starting potential in the source (Sec. III C) and the retarding potential in the analyzing plane (Sec. III D). We also discuss the detection ofβelec- trons and the definition of a region of interest (Sec. III E) as well as the processing and analysis pipeline for the data (Sec. III F).
The requirements for system stability arise from the method adopted to measure the tritium β spectrum by repeatedly scanning the retarding potential in alternating up and down sweeps (Sec. III G), and from the fact that KNM1 data from all pixels and all scans are combined into a single spectrum for fitting. In the final analysis, then, experimental parameters are essentially averaged over both space (across the detector) and time (across like scan steps throughout the KNM1 data-taking pe- riod). Later on, Sec. VII explores the justification for this analysis method in the statistics-dominated KNM1 data set.
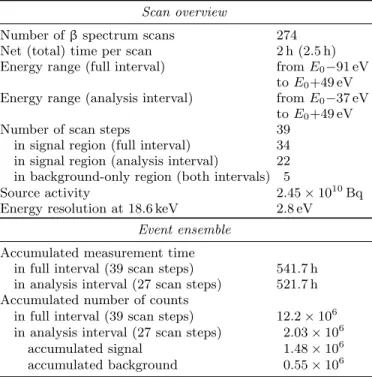
For the KNM1 campaign, the sequence of scan steps, each consisting of a retarding-potential set point dis- tributed in the interval [E0−91 eV,E0+49 eV], resulted
in a typical scan duration of 2.5 h. Therein, each scan step corresponds to a measurement time varying from 17 s for high-rate points deeper in the spectrum to 576 s near the endpoint region, as will be shown later in Fig. 7.
A. Tritium source parameters
The average source activity during KNM1 neutrino- mass data-taking was about 2.45×10¹⁰Bq, maintained by a column density of 1.11×10¹⁷molecules/cm2. This was achieved by a cumulative tritium throughput of 4.9 g/d.
The gas injected into the source consists mainly of molecular T2. Due to initial impurities and exchange reactions with the stainless-steel piping and vessel, the other hydrogen isotopologs (H2, HD, HT, D2, and DT) are also present in minor fractions. A PdAg membrane (permeator) in the tritium loop [60] continuously fil- ters the circulated tritium gas to prevent the recircula- tion of built-up impurities. The relative fractionscx of the six hydrogen isotopologs are continuously monitored by LARA, downstream of the permeator. The relative molecular isotopolog fractionscx and the atomic tritium purityεT are defined as:
cx= Nx
P6 iNi
,and (3)
εT=NT2+12(NHT+NDT) P6
iNi
(4) whereNx is the number of molecules of isotopolog xin the source, and the sums are over all six isotopologs.
The tritium purity is monitored with better than 10−3 statistical precision [48].
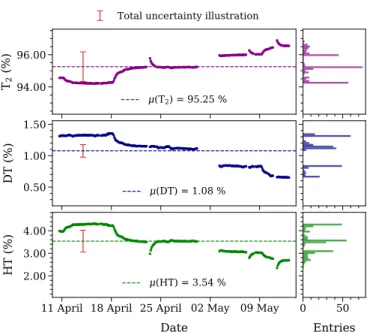
The time evolution of the relative fractions of the three tritiated isotopologs injected into the source dur- ing KNM1 is shown in Fig. 2. On average, the concen- trations of the tritiated species throughout the campaign werecT2 = 0.953,cHT = 0.035, and cDT = 0.011; these values are used in the final neutrino-mass analysis. The resulting tritium purity is εT = 0.9758(13) [48]. The prominence of HT as a secondary species is due to ex- change reactions with H atoms that are naturally present in stainless-steel piping [59], and the residual presence of DT is due to the isotope-separation process used to purify the tritium [61]. The inactive species (H2, HD, and D2) are only present in trace amounts, as they are strongly suppressed by shifts of the chemical equilibrium in the presence of high-surplus T2.
B. Column density
The column density ρddetermines the number of tri- tium atomsNT in the source
NT = 2εT·ρd·A, (5)
94.00 96.00 T2 (%)
(T2) = 95.25 %
11 April 18 April 25 April 02 May 09 May Date
2.00 3.00 4.00
HT (%)
(HT) = 3.54 %
0 50
Entries 0.50
1.00 1.50
DT (%)
(DT) = 1.08 % Total uncertainty illustration
FIG. 2. Evolution of the relative fractions of the three triti- ated isotopologs injected into the source during KNM1. The dotted lines show the mean values over KNM1, with the red error bars illustrating the total uncertainties (statistical and systematic). The steps and kinks in the trends indicate times at which a new tritium gas batch was fed into the circulation loop. As the tritium is re-processed in several steps at the Tritium Laboratory Karlsruhe [62], its purity varies slightly between batches.
whereAis the cross-sectional area of the WGTS, and the factor of 2 is necessary becauseρdis defined in terms of the number of T2molecules. The column density further defines thes-fold scattering probabilitiesPsof electrons, traveling parallel to magnetic field lines through the en- tire tritium source, with the gas molecules:
Ps=(ρdσ)s
s! e−ρdσ. (6)
The productρdσ, whereσis the cross section for inelastic scattering of electrons from molecular tritium (Sec. V B), gives the expected number of scatterings. It must be known with high accuracy for the analysis [25].
The precise absolute value ofρdσis obtained from mea- surements with the narrow-angle, quasi-monoenergetic e- gun located in the rear system. This e-gun produces a high-intensity beam of electrons via the photoelectric ef- fect according to the principle described in Ref. [49]. On their path towards the detector, the electrons traverse the source, where they can undergo inelastic scattering and in the process lose energy. Only those electrons with sufficient remaining energy to surpass the spectrometer potential are counted in the detector. By measuring the electron rate at different retarding potentials and fitting a model response function (Sec. V) to these data, we may make a precise determination ofρdσ.
E-gun electrons differ fromβ-electrons with regard to their starting positions and their energy and angular dis-
tributions. For this reason a modified response func- tion, including a precise description of the e-gun beam characteristics, is used in the column-density determina- tion. The e-gun electron rate is measured at retarding potentials where the impact of the column density is the strongest. The mean energy of the e-gun electrons is set to 18.78 keV, allowing a clean separation from β elec- trons that could bias the column-density determination.
During KNM1,ρdσwas determined with the e-gun on a weekly basis, achieving relative uncertainties of less than 0.9 %.
As described in Sec. II, the first exposure of the inner loop to T2resulted in the production of gas species which condensed on the surface of the injection capillary. This obstruction caused the tritium injection flow and column density to drift over time at constant tritium injection pressure. By lowering the column density to be a fac- tor of approximately 5 smaller than the nominal column density ρdnom, and by increasing the tritium injection pressure several times during KNM1, these drifts were kept lower than 3 %. To ensure precise monitoring of the column density during the whole measurement pe- riod, the e-gun measurements were combined with con- tinuousρdfluctuation data from a mass-flow meter with 200 sccm full-scale range [63], applied to the tritium in- jection flow. The reproducibility of the flow meter dur- ing KNM1 is conservatively estimated to be 1.5µbar·l/s.
Based on simulations that show a linear relation between ρdσand the tritium injection flow for a narrow through- put range [64], a linear calibration function is suitable to relate the measured throughput toρdσ.
With this strategy, we determine the column density with high precision for all tritium data-taking. The time evolution and distribution of the column-density values are shown in Fig. 3; the average value of ρdσ is 0.404 at the molecular tritium endpoint. Using the cross-section value from Eq. 17 further below, this value translates to an average column density of ρd = 1.11×10¹⁷molecules/cm2.
C. Electron starting potential
The starting potential of the β electrons is provided by a cold and strongly magnetized plasma in the WGTS.
The magnitude of the potential depends on the bound- ary conditions at the rear wall and the grounded beam tube. By optimization of the rear-wall set voltage, a ho- mogeneous, stable plasma potential can be created. This is important because both spatial inhomogeneities and temporal fluctuations of the plasma potential distort our spectrum in a manner analogous to the neutrino mass.
Indeed, the shift in neutrino-mass squared due to an er- ror ∆σ2in the Gaussian variance of a continuous variable (such as the starting potential of theβelectrons) is given at leading order by [65]:
∆m2ν=−2∆σ2. (7)
11 April 18 April 25 April 02 May 09 May Date
1.06 1.08 1.10 1.12 1.14
d (molecules/cm2) ×10
17
( d) = 1.110 × 1017 cm 2 Total uncertainty illustration
0 25
Entries
FIG. 3. Evolution of the column density during KNM1; the uncertainty is dominated by systematics arising from the rela- tionship of e-gun data to the measured throughput, and from fluctuations in the latter quantity. The visible decrease of the column density over time is caused by conductance changes of the tritium injection capillary. By increasing the tritium injection pressure several times, the column density was sta- bilized.
Since we combine all pixels and all scans for our KNM1 fits (Sec. VII), our analysis does not account for inhomo- geneities or temporal fluctuations, and the full variance of the electron starting potential therefore contributes via Eq. 7.
The source plasma is generated by the weakly self- ionizing tritium gas. According to simulation, each β electron creates on average 36 secondary electrons, and thus 36 positive ions, through scattering interactions.
Throughout the central part of the WGTS, the ions have a mean free path of less than 0.5 m for momentum trans- fer with the neutral gas. Consequently, the flow of neu- tral tritium gas drives the ions toward both ends of the source. The low-energy, secondary electrons follow the ion motion in order to maintain quasi-neutrality, facili- tated by their much higher mobility along the magnetic field lines. While the ions quickly become fully thermal- ized to the meV scale, the energy spectrum of secondary andβelectrons ranges from meV to keV.
The electric potential inside the plasma depends on the surface potentials at its boundaries. These are deter- mined in turn by their intrinsic work functionsφ, which are expected to differ by several 100 mV [66], and by the applied bias voltages. As the beam tube is grounded (Ubt= 0 V), only the rear-wall bias voltageURW remains to compensate the work-function differences. At an opti- malURW, the radial and longitudinal inhomogeneities of the plasma potential both vanish, as expected from sim- ulations with the assumption of negligible work-function inhomogeneities [67].
The optimal rear-wall bias voltage was determined by measuring the β-rate at variousURW settings. Compar- ing these rates to reference spectra, we extracted the de- pendence of the spectral endpoint E0 on the FPD ring number – which correlates to radius in the source.
ForURW =−150 mV, a flat radialE0distribution was found. Also, the measurement of the plasma-induced cur-
rent on the rear wall showed no drifts and less noise than at other bias voltages. URWwas therefore set to−150 mV for the measurement campaign.
The systematic effect of remaining spatial inhomo- geneities and fluctuations of the plasma potential can be constrained by studying the line widths and posi- tions of quasi-monoenergetic conversion electrons from gaseous 83mKr co-circulating in the T2 gas [68]. The L3-32 line at 30 472.2(5) eV is particularly interesting for this study. First, it is located above E0. Second, the 37.8(5) % branching ratio into this final state leads to a high signal-to-noise ratio [69]. Third, it possesses a small intrinsic line width of Γ≈1 eV. In a previous campaign using gaseous 83mKr in the absence of tritium gas [19], the KATRIN experiment measured an L3-32 line posi- tion ofEL3-32 = 30472.604±0.003stat±0.025syseV and a Lorentzian line-width of ΓL3-32 = 1.152±0.007stat± 0.013syseV [70]. This effective line position includes a shift arising from the absolute work-function difference between the source and the main spectrometer.
After the KNM1 neutrino-mass campaign ended, plasma studies were performed for two days with co-circulating 83mKr and T2. It should be noted that the column density during neutrino-mass mea- surements was only 22 % of the nominal value of 5.0×10¹⁷molecules/cm2, while during the plasma study it was about 30 % of the nominal value.
The krypton admixture did not affect general plasma properties, such as charged-particle density or electric potentials, because the partial pressure and activity (≈ 3 MBq) of krypton were several orders of magnitude be- low those of tritium (≈ 33 GBq). However, the plasma was affected by the beam-tube temperature of 100 K, elevated from the nominal 30 K. This higher tempera- ture was necessary to prevent the krypton from freez- ing, but also increased the temperature of the dominant low-energy part of the electron energy distribution [71].
The plasma temperature is known to strongly influence the rate of electron-ion recombination at the meV scale.
As the recombination rate is much stronger at 30 K, we expect plasma effects at elevated source temperature to be more prominent. We thus use results obtained dur- ing the krypton measurement at 100 K to set an upper limit of the scale of possible plasma effects. Theβ-decay electrons and non-thermalized electrons make only minor contributions to the number density, but their dominant role in the energy density of charged particles requires a detailed investigation.
The intrinsic Lorentzian line width was measured with gaseous 83mKr in the absence of tritium, with the ex- perimental conditions as similar as possible to the L3-32 measurements with co-circulating T2/83mKr (described above). By comparing these two measurements and as- suming an energy-independent background, we find that the presence of T2 results in a Gaussian line broadening of<80 mV for rear-wall settings in the range−350 mV<
URW < 350 mV. The collaboration is currently investi- gating the impact of a possible radial-dependent back-
ground, which could arise due to detector effects.
The impact of these findings on the neutrino-mass measurement is discussed in Sec. VIII C.
D. Analyzing-plane potentials
The threshold energy for electrons to pass through the MAC-E filter is determined by the value of the retard- ing potential U at the analyzing plane. Any unknown instabilities in the retarding potential directly affect the energy scale of the tritium spectrum and can introduce systematic effects on m2ν. To first order, significant, unaccounted-for continuous inhomogeneities and fluctu- ations effectively broaden the spectrum as seen in Eq. 7.
Our KNM1 analysis does not account for inhomogeneities or fluctuations inU, so that the full variance is seen in the broadening. For the target sensitivity of KATRIN, the energy scale must be stable to within 60 meV or 3 ppm on a baseline retarding potential of−18.6 kV.
To achieve this, we have constructed a dedicated mea- surement chain, including precision high-voltage dividers with proven long-term stability on the ppm level over one year [56]. A custom-built post-regulation system [35] en- sures stability at higher frequencies, up to 1 MHz.
In order to stack multiple scans for the KNM1 analysis (Sec. VII B), it is not only necessary to have 3 ppm mon- itoring, but also to achieve comparable precision in both the stability at each scan step and the reproducibility of the retarding potential from scan to scan.
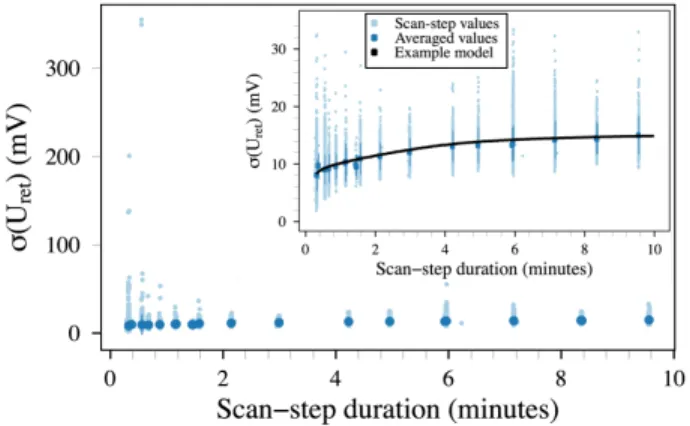
Figure 4 shows the achieved high-voltage stability while acquiring data at individual scan steps over the full measurement interval. This stability is on average below 15 mV, significantly exceeding requirements. The observed increase in standard deviation as a function of scan-step duration is described well by a simple statisti- cal model that combines a random-walk diffusion process with a feedback loop. The reproducibility of retarding potentials from scan to scan follows a Gaussian distribu- tion with a width ofσ=34(1) mV. This limitation of the reproducibility is directly related to the digital-to-analog converter inside the post-regulation setup; for measure- ment phases after KNM1, finer-grained regulation is in place.
The retarding potential is continuously monitored dur- ing the measurements. Therefore, at each scan step, the time evolution of the retarding potential is known with ppm precision. Neglecting this in the analysis introduces an additional broadening of the energy scale, leading to a neutrino-mass shift of ∆m2ν =−3×10⁻³eV2. This shift is less than half the allotment for the high-voltage-related systematic uncertainty in the KATRIN uncertainty bud- get for full five-year statistics [15], and can be neglected in the KNM1 analysis.
FIG. 4. Achieved stability of the retarding potential as a function of the scan-step duration. Light blue points show the standard deviation of the measured retarding potential for each scan step during KNM1. Dark blue points show the mean of this standard deviation for scan steps with the same length; their error bars show the standard deviation of this value. Outliers arise from a brief period in which the change in HV setpoint was incorrectly synchronized with the DAQ, a problem affecting 0.3% of scan steps. In the inset figure, scans with synchronization errors have been removed to show the performance of the HV subsystem. The black line gives the prediction of the statistical model described in the text.
E. Electron counting and region of interest The FPD records a low-resolution, differential spec- trum of electrons that have passed the high-resolution energy threshold set by the main spectrometer. Measur- ing the integrated tritium β spectrum for KNM1, and thereby extracting the neutrino mass, requires an accu- rate count of electrons that arrive at the FPD within an energy region of interest (ROI) during each scan step.
The ROI cut allows rejection of backgrounds and noise events generated near or in the FPD.
When electrons strike the FPD, its pixels are triggered individually, with thresholds set just above the noise floor at around 5 keV. As described in detail in earlier work [41], the energy and timing for each pulse are recon- structed online using a double trapezoidal filter and then recorded; FPD waveforms are not saved during normal operations. The shaping length of the trapezoidal-filter pair is set to 1.6 µs, optimizing the energy resolution at around 1.8 keV (full width at half maximum, FWHM).
During βscans, rates are too low for significant pileup, but severe pileup during high-rate e-gun measurements can result in deadtime when multiple coincident events drive the baseline out of the ADC dynamic range. This effect is mitigated by individually adjusting the gain of each channel to approximately 5 ADC counts per keV, preserving good energy resolution while defining a dy- namic range (up to 400 keV) sufficient to accommodate pileup. These settings were implemented in the DAQ firmware prior to the KNM1 measurement. Simulations of the readout chain show that the fraction of time dur- ing which the baseline is shifted out of the ADC input
![FIG. 7. Cumulative measurement-time distribution for KNM1. The 27 scan steps of the [E 0 −37 eV, E 0 +49 eV] analy-sis interval are shown in blue below E 0 , and in black above E 0](https://thumb-eu.123doks.com/thumbv2/1library_info/3995748.1540066/11.918.477.843.81.252/cumulative-measurement-distribution-steps-analy-interval-shown-black.webp)
![Figure 9 shows a comparison of the current distribution with Ref. [79] for transitions from the most populated T 2](https://thumb-eu.123doks.com/thumbv2/1library_info/3995748.1540066/14.918.477.842.76.264/figure-shows-comparison-current-distribution-ref-transitions-populated.webp)


