Development of a Micro-
total Analysis System for the detection of Biogenic Amines
Dissertation zur Erlangung des Doktorgrades der Naturwissenschaften
(Dr. rer. nat.)
an der Fakultät Chemie und Pharmazie der Universität Regensburg
Deutschland
Vorgelegt von Sarah Nagy Ali Mobarez
aus Kairo
im Jahr 2020
Printed with the support of the German Academic Exchange Service
Die vorliegende Dissertation entstand in der Zeit von April 2017 bis September 2020 am Institut für Analytische Chemie, Chemo‐ und Biosensorik der
Universität Regensburg.
Die Arbeit wurde angeleitet von PD. Dr. Axel Dürkop.
Promotionsgesuch eingereicht am: 23.07.2020 Voraussichtlicher Kolloquiumstermin: 02.09.2020
Prüfungsausschuss
Vorsitzender: Prof. Dr. Alkwin Slenczka
Erstgutachterin: PD Dr. Axel Dürkop
Zweitgutachter: Prof. Dr. Antje J. Bäumner
Drittprüfer: Prof. Dr. Alexander Breder
Acknowledgement
I would like to especially thank my supervisor PD Dr. Axel Dürkop for helping and supporting me through all. I would like to express my gratitude to him for guiding me through the whole work and being so friendly. I also thank him for the detailed discussions and patiently answering my questions.
I would like to thank my supervisor Prof. Dr. Antje Bäumner for the opportunity to work on this interesting topic, as well as for giving me the chance to be a part of her scientific research and supporting me during the entire doctorate.
I want to thank Dr. Nongnoot Wongkaew for useful discussions and sharing her experience in this field. I would also like to thank Prof. Dr. Alexander Breder and Prof. Dr. Alkwin Slenczka for taking on the roles of third-party reviewer and chair in my doctoral examination.
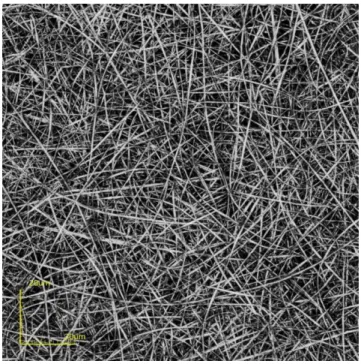
I would like to thank Marcel for taking the SEM images of the two types prepared of the nanofibers to characterize them. I want to thank my lab members Marcel Simsek and Antonia Teodora for their good, friendly company, and having a really good time. I would also like to thank my working group, and all of my colleagues for being nice and cooperative.
I want to thank Arne Behrent for being a good supportive friend. Special thanks to my best friends either here in Germany or in Egypt Nashwa Ibrahim, Hoda Mahmoud, Soha Hassan, and Marwa Eletreby for being there for me especially through the hard time.
Last but not least, my greatest thanks go to my parents Nahed Mohamed and Nagy Ali and my sister Rana Nagy for their support. I want to thank my mother again for believing in me and always supporting me.
Many thanks to all of you!
Declaration of Collaborations
This work was conducted in large degrees of experimental and theoretical work solely by the author. However, to a certain extent, collaborations with other researchers were conducted to generate results, which is stated in this chapter in accordance with §8 Abs. 1 Satz 2 Ziffer 7 of the “Ordnung zum Erwerb des akademischen Grades eines Doktors der Naturwissenschaften (Dr. rer. nat.) an der Universität Regensburg vom 18. Juni 2009“.
Optical Sensors for Determination of Biogenic Amines in Food (Chapter 1)
Major parts of his chapter have been published as a review article. Alexandra Danchuk, Nadezhda S. Komova, Sarah Mobarez, Sergey Doronin and Axel Duerkop performed literature search and wrote the manuscript. The article was revised by Natalia A. Burmistrova, Alexey V. Markin and Axel Duerkop. Axel Duerkop is corresponding author.
Functional Electrospun Nanofibers for Multimodal Sensitive Quantitation of Biogenic Amines in Food via a Simple Dipstick Assay (Chapter 3)
This chapter has been published as a research article. Sarah Mobarez shared in the experimental work and revision of the manuscript. The experimental work was mainly done by Nadezhda S. Yurova and Alexandra Danchuk. Antje J.
Baeumner and Nongnoot Wongkaew contributed with strategic discussions.
Axel Duerkop is the corresponding author. Axel Duerkop was the leader of this
project.
Dipsticks with Reflectometric Readout of an NIR Dye for Determination of Biogenic (Chapter 4)
This chapter is intended for submission in Chemosensors. The experimental work and writing the manuscript was carried out by Sarah Mobarez. The article was revised by the Sarah Mobarez and Axel Duerkop who is corresponding author and leader of this project. Antje J. Baeumner contributed with strategic discussions. Nongnoot Wongkaew and Marcel Simsek contributed with useful discussions and sharing skills and experience especially for data analysis.
Approaching a µ-TAS for the quantitation of Biogenic Amines in Food (Chapter 5)
The experimental work and writing of this chapter were carried out by Sarah
Mobarez.
Table of Contents
1 Optical Sensors for Determination of Biogenic Amines in Food 1
1.1 Abstract 1
1.2 Introduction 3
1.3 Biogenic amines as indicators of food spoilage 4 1.4 Sensor design 9 1.5 Detection Methods 12 1.5.1 Reflectometric readout 24 1.5.2 Photometric readout 28
1.5.3 Luminescence readout 30
1.5.4 Chemiluminescence readout 34
1.5.5 Total internal reflection ellipsometry 35
1.5.6 Surface-enhanced Raman spectroscopy 36
1.6 Conclusion and outlook. 38
1.7 References 40
2 Motivation and Structure of the Thesis 51
2.1 References 55
3 Functional electrospun nanofibers for multimodal sensitive detection of biogenic amines in food via a simple dipstick assay 59
3.1 Abstract 59
3.2 Introduction 61
3.3 Materials and Methods 64
3.3.1 Materials 64
3.3.2 Apparatus 64
3.3.3 Electrospinning of fibers containing Py-1 65
3.3.4 Preparation of dipsticks and BA determination 66
3.3.5 Acquisition of images and evaluation 66
3.3.6 Preparation of real samples 67
3.4 Results and Discussion 67
3.4.1 Choice of materials, conditions of spinning, and fiber morphology 67
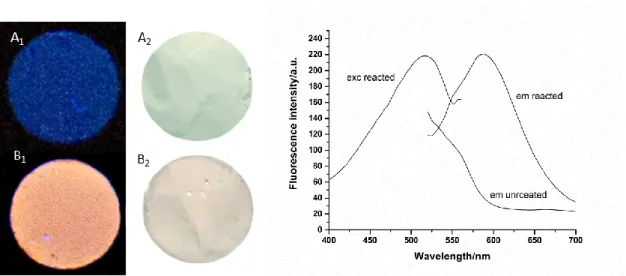
3.4.2 Optical properties of nanofibers and acquisition of images 73
3.4.3 Assay procedure for quantitation of BAs 75
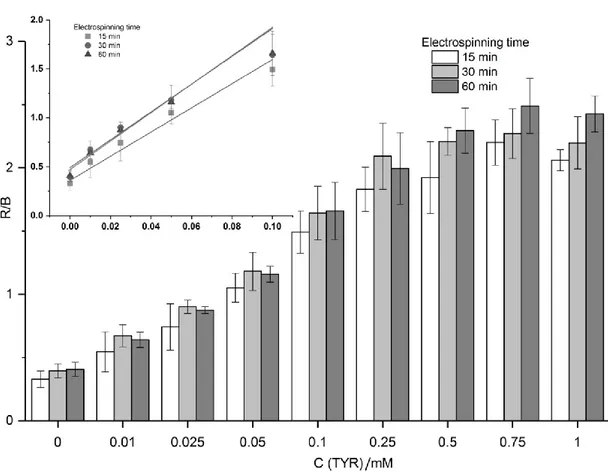
3.4.4 BA Calibration and sensitivity 78
3.4.5 Selectivity Studies 80
3.4.6 Quantitation of BAs in real samples 81
3.5 Conclusion 82
3.6 References 83
4 Dipsticks with Reflectometric Readout of an NIR Dye for Determination of Biogenic Amines 88
4.1 Abstract 88
4.2 Introduction 90
4.3 Materials and Methods 93
4.3.1 Materials 93
4.3.2 Apparatus 94
4.3.3 Electrospinning of S0378-CA fibers 95
4.3.4 Preparation of dipsticks and BA determination 95
4.3.5 Preparation of real samples 96
4.4 Results and Discussion 97
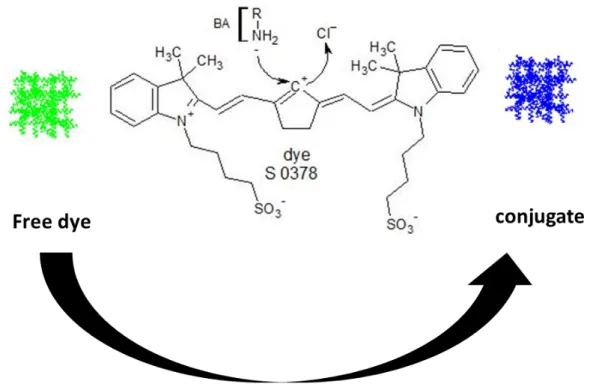
4.4.1 Choice of the dye 97
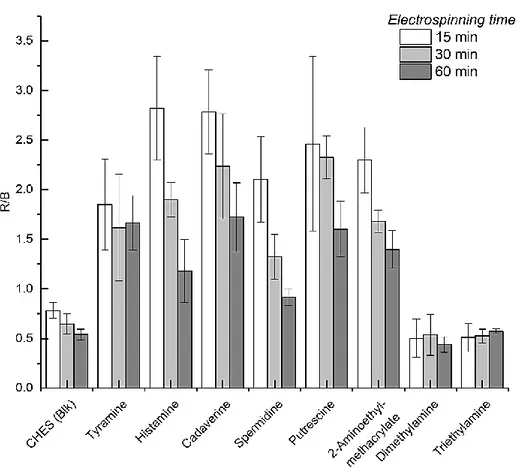
4.4.2 Choice of nanofiber materials, conditions of spinning, reaction temperature and time, and fiber morphology 100
4.4.3 Visible color change of dipsticks 103
4.4.4 Assay procedure for quantitation of BAs 104
4.4.5 BA Calibration and sensitivity 105
4.4.6 Selectivity Studies 108
4.4.7 Quantitation of BAs in real samples 111
4.5 Conclusion 113
4.6 References 114
4.7 Supporting information 119
5 Approaching a µ-TAS for the quantitation of Biogenic Amines in Food 125
5.1 Introduction 125
5.1.1 µ-TAS as an application of microfluidics and its advantages 125
5.1.2 Laminates 126
5.1.2.1 Laminates‟ Fabrication 126
5.1.2.2 Paper based microfluidic device 128
5.1.3 Microfluidic systems including nanofibers 129
5.2 Materials and Methods 130
5.2.1 Materials 130
5.2.2 Apparatus 130
5.2.3 Electrospinning of S0378-CA fibers 131
5.2.4 Fabrication of the microfluidic chip 132
5.3 Results and discussion 133
5.3.1 Setting up the design of the microfluidic chip 133
5.3.2 Optimization of the wax melting conditions, and applied BAs volume 134
5.3.3 Optimization of reaction temperature and time for TYR calibration 134
5.4 Conclusion and outlook 138
5.5 References 138
6 Conclusion and Future Perspectives 142
6.1 Reference 145
7 Summary 147
8 Zusammenfassung 149
Curriculum Vitae 152
Publications 154
EIDESSTATTLICHE ERKLÄRUNG 155
1 Optical Sensors for Determination of Biogenic Amines in Food
1.1 Abstract
This chapter presents the state-of-the-art of optical sensors for determination of biogenic amines (BAs) in food by publications covering about the last ten years.
Interest in the development of rapid and preferably on-site methods for
quantification of BAs is based on their important role in implementation and
regulation of various physiological processes. At the same time, BAs can
develop in different kinds of food by fermentation processes or microbial
activity or arise due to contamination, which induces toxicological risks, food poisoning, and cause serious health issues. Therefore, various optical chemosensor systems have been devised that are easy to assemble and fast responding and low-cost analytical tools. If amenable to on-site analysis, they are an attractive alternative to existing instrumental analytical methods used for BA determination in food. Hence, also portable sensor systems or dipstick sensors are described based on various probes that typically enable signal readouts such as photometry, reflectometry, luminescence, surface-enhanced Raman spectroscopy or ellipsometry. The quantification of BAs in real food samples as well as the design of the sensors are highlighted and the analytical figures of merit are compared. Future instrumental trends for BA sensing point to the use of cell-phone-based fully automated optical evaluation and devices that could even comprise microfluidic micro total analysis systems.
________________________________________________________________
This chapter has been published:
Alexandra I. Danchuk, Nadezhda S. Komova, Sarah N. Mobarez, Sergey Yu.
Doronin, Natalia A. Burmistrova, Alexey V. Markin, Axel Duerkop, Anal.
Bioanal. Chem., 2020, DOI: 10.1007/s00216-020-02675-9
Author contributions:
Major parts of this chapter have been published as a review article. Alexandra
Danchuk, Nadezhda S. Komova, Sarah Mobarez, Sergey Doronin and Axel
Duerkop performed literature search and wrote the manuscript. The article was
revised by Natalia A. Burmistrova, Alexey V. Markin and Axel Duerkop. Axel
Duerkop is corresponding author.
1.2 Introduction
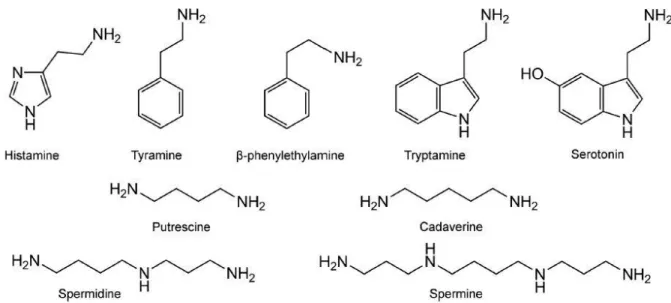
Biogenic amines (BAs) are small organic molecules, which show high biological activity. They mainly arise in tissues of living organisms as a result of enzymatic decarboxylation of amino acids or by amination and transamination of aldehydes and ketones. In fresh foods, they are mostly found in protein-rich samples but their concentrations in any food can quickly increase upon improper storage. The molecular structure of some main BAs which can occur in food and which are involved in food poisoning are shown in Fig. 1.
Fig. 1. Molecular structures of main biogenic amines present in food.
This chapter focuses in detail on optical chemosensor systems for BA
determination in quality control of real food samples and particularly highlights
the analytical aspects of the various optical detection methods. Commonly,
different types of probes (organic dyes, metal-ligand complexes, nanomaterials,
enzymes, etc.) and sensor designs as well as signal readouts find their way into
BA sensors and hence those are classified here with respect to the various
optical detection methods.
1.3 Biogenic amines as indicators of food spoilage
Fish, meat, cheese, vegetables, fruits, nuts and chocolate and various beverages
like wine or beer are typical foodstuffs in which BAs are present at various
concentration levels. The concentration of BAs in food depends on its nature
and bacterial environment [1, 2]. For example, scromboid fish has a high free
histidine content, which may produce (especially with increasing temperature)
histamine . The levels of histamine, putrescine and cadaverine usually becomes
higher during ageing of fish and meat whereas the levels of spermine and
spermidine (exist at high concentrations from the beginning) will be reduced
with food ageing [3]. Other amines, such as trimethylamine and dimethylamine
are indicators of fish freshness [4]. In dry sausages especially the concentration
of histamine and tyramine increases during ripening [5]. Several juices, nectars
and lemonades made from oranges, raspberries, lemons, grapefruit, mandarins,
strawberries, currants and grapes include various biogenic amines in different
concentrations, among them putrescine is the most dominant one [6]. High
amine concentrations are found in orange juice (noradrenaline, tryptamine),
tomato (tyramine, tryptamine, histamine), banana (tyramine, noradrenaline,
tryptamine, serotonin), plum (tyramine, noradrenaline) and spinach leaves
(histamine) [7]. Cocoa and chocolate contain tyramine, serotonin, β
phenylethylamine, and tryptamine [8]. Some types of mushrooms also include
high content of phenylethylamine and pyrrolidine was found also in high
concentrations in white and black pepper and soya sauce [9]. Fresh and
processed pork meat contain high concentrations of adrenaline, spermidine and
spermine but low concentrations of noradrenaline, putrescine, histamine,
cadaverine and tyramine [7]. Spermine and spermidine in meat and meat
products are within 6.4 - 62.1 mg/kg for spermine and 0.7 - 13.8 mg/kg for
spermidine. There is a big difference in tyramine, histamine, putrescine, and
cadaverine contents in meat especially in ripened products. In general, biogenic
amines in cooked meat products are less than 10 mg/kg, while in 40% of
ripened products they may exceed 300 mg/kg [10]. Seven amines were found in beef: 1,2 diaminopropane, histamine, putrescine, cadaverine, permine, permidine and tyramine [11]. Low levels of polyamines were observed in full cream and semi-skimmed cow‟s milk [12]. During the fermentation process, food is stored over days, weeks, or months. At the first steps of the fermentation process all types of microorganisms can flourish so the biogenic amine concentration expected to increase. This is already validated by the analysis of some fermented products like cheese, sauerkraut, wine, and fermented sausages [13]. Regarding milk-based fermented foods, cheese is the most probable product to contain a potentially unsafe BAs, especially tyramine, histamine, and putrescine [14]. Comparing cheeses made from raw and pasteurized milk, BA concentrations were higher in cheeses made from raw milk than in those made from pasteurized milk. Blue cheeses made from raw milk contain the biggest BA content with tyramine being most predominant [15]. Putrescine has been detected in all the fruits and nuts, with the highest amounts in orange, orange juice, mandarin, grapefruit, grapefruit juice, banana, passion fruit, and pistachio.
The range of the amine amount in citrus fruits and their juices is very wide varying from 0 - 200 mg/kg [16]. Although BAs can act as hormones and neurotransmitters their potential toxicity accounts for their significant role in food analysis [1, 2]. Papageorgiou and co-workers summarized different matrices (food and beverage products) in their review [2] that could contain biogenic amines in order to show which of them should be continuosly monitored for their toxicity. Moreover, the regulation policy and the toxicity of BAs are discussed.
Histamine is one of the most bioactive and toxic BAs, which can trigger an
allergic reaction in humans and mammals. According to the European Food
Safety Authority (EFSA), the U.S. Food and Drug Administration (FDA) as
well as the World Health Organization (WHO) there are some ranges of BA
concentration in foodstuff which point to various levels of food quality or food
degradation. A concentration of histamine of less than 50 mg/kg indicates good quality fresh food. Concentrations of histamine between 50 and 200 mg/kg may cause adverse health effects and levels above 200 mg/kg of histamine are reported to cause toxic effects in humans. Cadaverine and putrescine can potentiate the toxic effect of histamine. Poisoning of BAs on the one hand depends on the amount that has entered the body and on the other hand also on the individual human sensitivity to each BA. The permissible concentrations of other BAs are greater than for histamine. Therefore, e.g. doses of tyramine can vary from 600 mg up to 2000 mg, depending on the individual tolerance of each person [2]. Inappropriate storage temperature often is the reason for high concentrations of histamine in fish which have formed following decarboxylation under bacterial action from initial histidine [17]. Tyramine and β-phenylethylamine may initiate a hypertensive crisis in certain patients and dietary-induced migraine [18]. Polyamines (putrescine, spermine, spermidine and cadaverine) however, play essential functions in living cells and can be present in micro- or even millimolar concentrations. On the other hand, some polyamines can react with nitrite to form carcinogenic nitrosamines, and can also be food spoilage indicators [18]. Therefore, monitoring of BAs is a mandatory part of food analysis as a quality indicator for the sample under investigation.
BA detection in food is challenging because these analytes are very polar and better soluble in water than in organic solvents (Table 1, left column).
Furthermore, BAs need to be detected at low concentrations in a complex matrix, in most cases. Hence sensitive detection methods are required.
Furthermore, high selectivity should be provided to avoid that interfering
components in food may give a similar response as the target BA. The presence
of structurally similar BAs in the sample can further complicate the analysis as
a result of competitive interactions with the sensing material [2]. Therefore, the
application of a new sensor to a specific food sample should be validated by a
chromatographic method to warrant sufficient selectivity. BA detection by optical analytical methods is often complicated because of the weak capability of BAs to absorb light in the visible range. Therefore, derivatization of BAs with chromophores or fluorophores are employed to make them amenable for being optically analyzed. Further, a huge number of separation methods like GC, HPLC or capillary electrophoresis is hyphenated with optical, electrochemical or mass spectrometric detection as shown in recent reviews [18–22]. Finally, ELISAs [23] are applied for BA determination in foodstuff, as well. The main advantages of those methods are their high sensitivity and selectivity. However, they require highly qualified and trained staff, expensive high-quality reagents and time-consuming sample preparation (Table 1, left column). In order to overcome these limitations, the recent development of fast, low-cost and portable chemo and biosensors which can be used for on-site analysis of BAs in food is shown by recent publications covering about the last ten years, in this chapter. Kaur et al. [24] published a comprehensive review describing the existing probes and their recognition mechanisms (including e.g.
aggregation-induced emission (AIE), ligand exchange mechanism, photo-
induced electron transfer (PET)/internal charge transfer (ICT) mechanism and
some others) used for detection of biothiols and biogenic amines. Unlike this
earlier publication, the present one focuses on evaluating whole sensors
(comprising of probes, transducer and detector), discussing on-site use
capability and compares the merits and disadvantages of the various optical
detections methods together with discussing the impact of sensor material
design (in view of the materials used for embedding of the probe and exclusion
of unwanted interferents) on sensor performance. From this wealth of
perspectives on the topic, it is obvious that optical sensors for qualitative and
quantitative analysis of BAs are an attractive alternative to existing analytical
methods and some of them may be handled by non-trained staff or in-field.
Table 1. Challenges to be solved in the determination of BAs in real food samples and merits of optical sensors that promote their use.
Challenges of BA determination Advantages of optical sensors a. derivatization of BAs and
compliance with green chemistry;
b. strong polar character of BAs;
c. low concentration ranges of BAs;
d. presence of complex matrix with potentially interfering compounds e. occurrence of several BAs
simultaneously;
f. complexity of sample matrix;
g. time for sampling, work-up and detection;
h. requirement of trained personnel.
General:
a. fast signal reading and processing;
b. low-cost instrumentation;
c. minimum amount of sample required;
d. ease of operation;
e. evaluation by public-domain software;
f. acceptable for analysis by less- trained users;
g. flexible size from µm 2 to cm 2
h. multiplexing/array sensing possible i. amenable to remote sensing
j. no electrodes required.
Luminescence sensors:
general advantages as from a - j;
k. high sensitivity.
Surface-enhanced Raman spectroscopy sensor:
general advantages as from a, c, d, f-j;
l. high sensitivity.
1.4 Sensor design
Sensors can be described as technical sensing organs [25]. Sensors are devices which respond to a physical input and convert it into a signal, usually optical or electrical, that can be read by an observer or an instrument [26].The sensing process occurs over two steps: first to measure or detect a variety of physical, chemical, and biological quantities, including proteins, bacteria, chemicals, gases, light intensity, motion, position, sound and many others and the second is converting the physical quantity into a signal by the transducer. The sensors can be classified with respect to different aspects such as e.g. the receptor part, or the transduction mechanism, etc. The transducer converts one form of energy to another [26].
Fig. 2. The sensing process. Reprinted from [26].
The signal can be usually optical (fluorescence, absorption) or electrical (redox,
capacitance, resistive) [27]. Sensors can be classified also according to the
receptor element to chemical and biosensors. The main difference between
chemical and bio- sensors is not the type of the analyte detected or the nature of
the reaction taking place, it is according to the recognition element weather if it
is a chemical or biological molecule [28]. Chemical sensors respond to stimuli
caused by different chemicals or chemical reactions. These sensors are used for
qualitative and quantitative analysis of chemical species in liquid or gas phase [29]. Optical chemical sensors are of great advantage since they join the advantages from using optical fibers with the selectivity of the chemical transduction system [30]. Optical sensors are favorable over electrical sensors and other types since they are flexible, easily miniaturized, safe, selective, non- destructive, not subject to corrosion, of high resolution, allow remote sensing over several kilometers and offer a higher number of measurements over a small area using a single optical cable which leads to higher sensitivity [31].
Furthermore, the development in the quality of optical components, including light sources (lasers, light emitting diodes), photodetectors, amplifiers, etc. had a really high impact on the efficiency of the optical sensors [30]. Optical sensors depend on different optical principles such as absorbance, reflectance, luminescence, fluorescence that occur over different regions of the spectrum (UV, Visible, IR, NIR) and detection can be carried out not only by measuring the intensity of light, but also other related properties, such as lifetime, refractive index, scattering, diffraction and polarization [32]. Generally, optical sensors consist of molecular recognition elements and signal transducers. The molecular recognition elements interact with the analyte and give qualitative or quantitative information. As a result of this interaction, changes in the signal are produced by the sensor which are then transduced into easily evaluated and quantified optical signals [33]. The sensor quality relies on the overall components of the system, which are defined by the transduction, the sensitive layer, light source, data-acquisition electronics and evaluation software [34].
The optical detection depends on either a) direct sensing or b) indicator
mediated sensing. The analyte can be directly detected by some intrinsic optical
property such as, for example, absorption or luminescence. In an indicator
mediated system, the determination of the analyte concentration is carried out
based on the change in the optical response caused by an intermediate agent,
usually an analyte-sensitive dye indicator [35].
Fluorescence has attracted special attention among the different optical sensing methods since it is sensitive, and has various variables that can serve as an analytical information [36]. Fluorescence is more sensitive than absorption detection because in absorbance it is about measuring the ratio of the intensity between the two light beams passing through the reference and the sample which are comparable to each other, while in fluorescence the emission intensity is measured against a black background [37]. Samples which show fluorescence emit light with a longer wavelength than the absorbed light used for sample excitation. Fluorescence sensors are usually characterized by their excellent detection limit [38]. The typical emission rates of fluorescence are around10 8 s –1 , so that a typical fluorescence lifetime is near 10 ns (10 x 10 –9 s) [39].
Historically, the development of the (single use) test strips was mainly built on the principles of reflectometry [36]. Reflectance spectroscopy is a useful method of measuring the absorption spectra and other properties of solids. Reflectance based sensors are very useful for remote sensing since this kind of measurement can be done without contacting the sample [40].
Colorimetric sensors are an important category of optical sensors that show observable color change (often recognized by naked eye) upon reaction with the analyte. For more quantitative analysis, the change in intensity at certain wavelength within the visible range (400–800mm) of the spectrum can be determined using instruments. Colorimetric sensors are more popular because they are simple, inexpensive, easy to be used, selective and sensitive towards different analytes [41]. The comparison of the color change occurred in colorimetric strip tests with a color chart is useful for qualitative, or semiquantitative evaluation.
The use of a reflectometer to read the test strips has a great influence in
increasing the reproducibility and accuracy of the measurements. The
combination between indicator-based colorimetric strip tests with a
reflectometer to read them, is a practical alternative analyzing method to traditional laboratory methods [42]. Because of the increasing need for more sensitive sensors for many purposes such as global environmental monitoring, monitoring of food chains and medical diagnostics, there is rising interest in nanostructured materials such as nanofibers and nanowebs.
Electrospinning is a perfect technique for producing different forms of nanofiber sensor mats and achieving homogenous and highly uniform fibers at the same time. The electrospun nanomaterials are well known by their specific surface area and high porosity which promotes the sensor sensitivity [43].
Most of the optical sensors for BAs follow the classical sensor design where a probe for recognition is immobilized in a membrane and/or fixed on a suitable support which can be paper [44–46], glass [45, 47], TLC plates [48–
50], microtiter plates [51] and test-tubes [52]. To deposit the recognition layer knife coating, spin coating or simple soaking may be used. The probe is mostly embedded into a polymer layer as a thin film [48, 53], or eventually allowed to settle on another film of e.g. gold or silicon [54], on polymer particles [51, 55, 56], a hydrogel [57] or inside nanofibers [58].
1.5 Detection methods
Various optical methods are applied for detection. Those will be discussed in the following sections together the individual sensor schemes and with their major merits towards quantitation of BAs in real samples. Only if these methods have shown to work in real food samples, they are presented in Table 2 (see page 16) together with an in-depth overview on sensor composition and individual sensor details like response times, analytical ranges and limits of detection.
The optical BA recognition is correlated to binding to the receptor
molecules that create the analytical signal. Unfortunately, many BAs
themselves do not carry structural features that promote their optical detection
(i.e. large conjugated π-systems which are necessary for reflectometric, photometric or fluorimetric readout), so they need to be transformed into corresponding derivatives with the desirable detection properties [59]. The derivatization reagents may be divided into several groups: they can be chromophores and fluorophores (to impart absorption of UV light or fluoresce emission into the derivatives, respectively); fluorogenic molecules (which show fluoresce upon formation of the fluorescent derivative with the analyte) and redox reagents (which reduce/oxidize analytes to enable detection). For instance, reagents such as o-phthalic aldehyde, 1-fluoro-2,4-dinitrobenzene (DNFB), 2,4,6-trinitrobenzenesulfonic acid (TNBS), 4-fluoro-3-dinitro- fluoromethylbenzene, ninhydrin, benzoyl chloride and many others were widely used for derivatization of primary, secondary amines or polyamines to form colored products, followed by their chromatographic determination with absorbance or a fluorescence detector. However, most of these methods require expensive instrumentation that cannot be used in the field and the related reagents cannot be used in optical sensors for BAs because they lack long-term storage stability inside the sensor membrane.
Optical sensors (so called pH opt(r)odes) have the merit not to require electrodes and hence to be electrically safe which made them increasingly attractive in the fields of gas sensing, ion sensing, bioanalysis and pH sensing.
Optodes are based on changes of optical properties such as absorbance, fluorescence, luminescence, chemiluminescence, energy transfer or reflectance by measuring the intensity of light in various regions of the spectrum (UV, Visible, NIR, IR). Moreover, related properties such as light scattering, luminescence lifetime, refractive index (via surface plasmon resonance spectrometry), diffraction and polarization may be exploited analytically.
Optodes are beneficial due to their flexibility in size and shape, low cost, fast
response and light weight (Table 1, right column). They can be used in both
aqueous or organic media and can deliver information with either highly local
resolution (using fiber-optical sensors down to µm), which additionally can
reduce the sample volume down to nL. This is e.g. hardly available for electrical
sensors. Also areas until tens of cm 2 can be read using in optical imaging. A
further benefit is the potential to use multiplexed sensing, e.g. when various
optical probes with different detection wavelengths are used for simultaneously
probing a collection of analytes or to build up and read out a sensor array [48,
53, 60]. Arrays of multiple sensors with similar and low selectivity often require
multivariate data analysis methods to introduce analyte-selectivity but also
enable prediction of the freshness of food samples. Luminescence is the
detection method of choice if high sensitivity is required because due to the
absence of interfering excitation light it is more sensitive than reflectometry and
photometry. Sensors based on surface enhanced Raman spectroscopy (SERS)
present another modern highly sensitive alternative here because they are based
on analyte-induced changes of the refractive index. For appropriate use in food
sensing these sensors either may require labelling or derivatization procedures
in or on the sensor membrane or a sample pretreatment that involves analyte
separation from the matrix to warrant selectivity. Leaching or photobleaching of
the optical probe may compromise long-term stability and therefore has to be
carefully controlled, as well as selectivity. Optical sensors are suitable for
remote sensing (even over distances of kilometers) and can be used for in-vivo
measurements because of their immunity to electromagnetic interferences. This
wide range of how optical sensors can be tailored makes them hot candidates for
emerging into new fields like food chemistry that is dominated by more
expensive separation methods (GC and HPLC) hyphenated to various optical,
electrical or mass detection techniques. Here, optical sensors can operate on a
much less expensive level by using e.g. digital cameras, smartphones or flatbed
scanners for detection together with public domain software for evaluation. The
use of these inexpensive components provides a much easier operation of the
sensors. This will further promote the use of optical sensors in food sensing as
well as by less trained personnel.
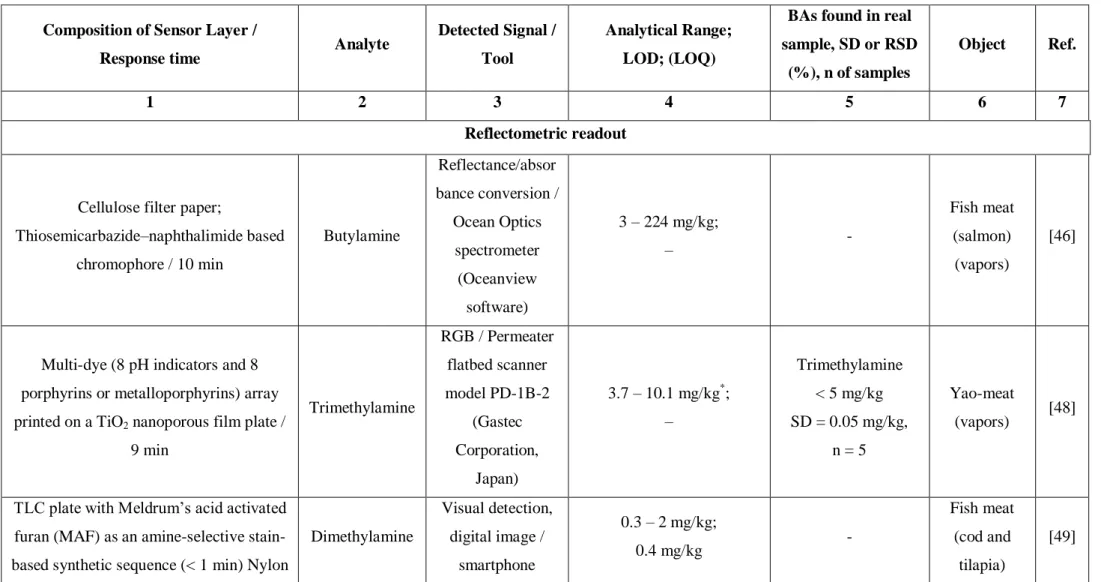
Table 2. Selection of representative sensors with proven applicability to real food samples and their analytical figures of merit.
Composition of Sensor Layer /
Response time Analyte Detected Signal / Tool
Analytical Range;
LOD; (LOQ)
BAs found in real sample, SD or RSD
(%), n of samples
Object Ref.
1 2 3 4 5 6 7
Reflectometric readout
Cellulose filter paper;
Thiosemicarbazide–naphthalimide based chromophore / 10 min
Butylamine
Reflectance/absor bance conversion /
Ocean Optics spectrometer
(Oceanview software)
3 – 224 mg/kg;
– -
Fish meat (salmon)
(vapors)
[46]
Multi-dye (8 pH indicators and 8 porphyrins or metalloporphyrins) array printed on a TiO
2nanoporous film plate /
9 min
Trimethylamine
RGB / Permeater flatbed scanner model PD-1B-2
(Gastec Corporation,
Japan)
3.7 – 10.1 mg/kg
*; –
Trimethylamine
< 5 mg/kg SD = 0.05 mg/kg,
n = 5
Yao-meat
(vapors) [48]
TLC plate with Meldrum‟s acid activated furan (MAF) as an amine-selective stain- based synthetic sequence (< 1 min) Nylon
Dimethylamine
Visual detection, digital image /
smartphone
0.3 – 2 mg/kg;
0.4 mg/kg -
Fish meat (cod and
tilapia)
[49]
filter membranes spotted with MAF / 5 min
(vapors)
TLC plates pre-coated with silica gel G,
diazonium reagent / 15 min Histamine
Optical density / Mobile phone, ImageJ software
50-150 ng/spot 14.03 ppm; (39.15 ppm)
Histamine RSD = 1.07 % – 2.76
%, n = 6
Fish meat (mackerel)
(vapors)
[50]
Array of pH indicators (methyl red, alizarin, bromophenol blue, thymol blue,
chlorophenol red) cellulose acetate membranes / 10 min
Isobutylamine, triethylamine, isopentylamine
RGB / iPhone®
2-8 ppm 2-10 ppm 1-4 ppm (1 mg/kg)
- Minced meat
(vapors) [53]
Inkjet paper with monolayers array of hollow AuNPs received by reversal
nanoimprint lithography / 30 min
Putrescine Shift of reflectance spectra
0.1 – 200 mg/kg;
13.8 mg/kg -
Spiked fish meat (vapors)
[56]
Au NRs with Ag metallization / 30 min Trimethylamine
RGB / smartphone, visual
detection
0.011 – 0.200 μM;
8.6 nM = 0.51 μg/kg
*-
Fish (salmon), beef meat (vapors)
[57]
Combination of 2-fluoro-4-[4-(2- hydroxyethanesulfonyl)-phenylazo]-6-
methoxyphenol and Remazol Brilliant Blue R, immobilized on cellulose
microparticles / 1.5 h
Methylamine, dimethylamine,
putrescine, cadaverine, histamine, tyramine and
CIE lab color space / color measurement
device (Mathi, Germany)
0.3 – 30 mg/kg
– -
Chicken, pork meat
(micro- biological
spoilage) (vapors)
[60]
tryptamine
Silica gel 60 F
254plates, 16 chemo- sensitive dyes/24 h – several days
Trimethylamine, dimethylamine,
cadaverine, putrescine
Gray scale / Corel Photo- Paint X3,
flatbed scanner (Epson V750-M
Pro Perfection scanner)
81.7 – 350 mg/kg
*–
Volatile basic nitrogen (TVB-N) 81.7 mg/kg
*(1 day),
350 mg/kg
*(9 day), RSD < 9 %,
n = 4
Fish meat (atlantic salmon) (vapors)
[63]
AuNPs
(13.1 ± 0.7 nm) / 15 min Histamine
Color change / visual detection or
camera;
Absorbance / TU- 1901 spectrophotometer
0.1 – 2.1 μM;
1.81 μM;
38 nM
Histamine 1.81 μM SD = 0.3 – 0.7 µM,
n = 3
Fish meat (salmon) (solution)
[66]
Photometric readout
Polymeric film,
Nitrated conjugated polythiophene (NPTh) / 2.5 – 37 min
Ethylenediamin e, putrescine,
cadaverine, spermidine, phenethylamine,
histamine
Color change / visual detection or
camera;
Absorbance / UV–
vis
spectrophotometer
– 5.6 mg/kg;
0.92 mg/kg;
0.45 mg/kg;
– –
-
Beef, pork, and salmon
meat (vapors)
[68]
(JASCO V-650) –
AuNPs (11–19 nm) Histamine,
histidine
Color change / eye-vision
2 – 16 μM;
0.6 μM - Poultry meat
(solution) [67]
o-phthalaldehyde (OPA) and thioglycolic acid (TGA) derivative of putrescine / 12
min
Putrescine
Absorbance / UV–
vis
spectrophotometer (Perkin Elmer Lambda 35, USA)
0.8 – 200 μM;
0.44 μM
Putrescine 41 – 180 mg/g RSD = 10 – 42 %,
n = 3
Fish meat (10 commercial
products) (solution)
[70]
Luminescence readout
Cellulose acetate nanofibers embedded
with Py-1 / 20 min Tyramine
Fluorescence with RGB / Digital camera Canon EOS 550D
10 – 100 µM;
20 µM
Histamine (µmol/g) 14.1 ± 0.3 (day 0), 16.4 ± 1.5 (day 3), 38.8 ± 2.6 (day 6) RSD = 17 – 21 %
n = 4
Shrimp meat (solution;
TAC)
[58]
Microtiterplate with sensor film based on Py-1 embedded in Hypan HN 80 / 10 min
Histamine putrescine tyramine
Fluorescence / FLUOstar Optima
microtiterplate reader
Histamine:
0.5 – 70.0 mg/kg;
0.165 mg/kg;
(0.495 mg/kg)
Total content of BAs (TAC) 49.6 – 137.8 μg/mL
(day 1), 97.6 – 397 μg/mL
10 samples of meat,
cheese (solution;
TAC)
[61]
(day 5) SD = 0.23 – 2.19
μg/mL RSDs 3.71% (10.0 μg/mL), 4.08% (20.0 μg/mL), 3.73% (30.0 μg/mL) 5.03% (40.0 μg/mL)
n = 5
Tiss
®-Link (NanoMyP
®) support with
immobilized tryptamine / 15 min Tryptamine
Phosphorescence /Varian Cary-
Eclipse luminescence spectrophotometer
with flow-through cell
19 – 600 μg/kg;
6 μg/kg; (19 μg/kg)
Tryptamine 366.8 – 697.6 ng/mL
RSD = 1.8 – 6.1 % n = 4
Beer
(solution) [74]
DAO immobilized on chitosan-coated magnetic microparticles (MCH) or SEPABEADS® EC-HA (MFS) deposited
with
Ru-bathophenanthroline on a lens connected to optical fiber
Putrescine Home-made time- correlated single photon counting
instrument
MCH, mM 0.1 – 1.000;
0.025 = 2.2 mg/kg
*;
(0.082)
0.1 – 1.000;
MFS, mM 0.1 – 0.750;
0.061 = 5.4 mg/kg
*;
(0.202)
0.1 – 1.000;
- Beer
(solution) [76]
Cadaverine
Spermidine
Histamine
0.030 = 3.1 mg/kg
*;
(0.102)
0.1 – 2.200;
0.271 = 39.6 mg/kg
*;
(0.905)
0.1 – 2.200;
0.479 = 53.2 mg/kg
*;
(1.595)
0.052 = 5.1 mg/kg
*;
(0.175)
0.1 – 1.250;
0.093 = 13.5 mg/kg
*;
(0.309)
0.1 – 1.250;
0.205 = 22.7 mg/kg
*;
(0.683) Chemiluminescence readout
Glass support with hydroxyethyl cellulose membrane included luminol and covered
with Co(II) and enzyme (putrescine oxidase or diamine oxidase) fixed on the
photodiode
Putrescine
Chemiluminescen ce/ Anthos Labtec
Instruments Microplate luminometer
Putrescine using putrescine oxidase: 1 – 2 mg/L;
(0.8 mg/L);
Putrescine using diamine oxidase: 1 – 2 mg/L;
Putrescine using putrescine oxidase
0.72 – 2.76 mg/L SD = 0.1 – 1 mg/L;
Putrescine using
Beef, pork, chicken, turkey and
fish meat (solution)
[51]
Lucy1 (1.3 mg/L) diamine oxidase 0.78 – 2.45 mg/L SD = 0.3 – 1.1 mg/L
n = 15
Bis(2,4,6-trichlor-
ophenyl)oxalate(TCPO)–H
2O
2system modified with Mg–Al–CO
3- LDH
nanosheet colloids
Histamine
Ingibition of chemiluminescenc
e/Hitachi, F-7000 fluorescence spectrophotometer
0.1 – 100 M;
(3.2 nM = 0.4 μg/kg
*)
Histamine 14.6 – 14.7 μM SD = 0.2 – 0.4 μM
(day 12) 30.8 – 31.2 μM SD = 0.2 – 0.4 μM
(day 5) n = 3
Fish, pork meat (solution)
[80]
Surface-enhanced Raman spectroscopy AuNPs;
preliminary solid phase extraction of the analyte by PVC film with incorporated
MIP
Histamine
Raman spectrometer with 785 nm excitation
wavelength
3‒90 mg/kg
– -
Fish meat (canned
tuna) (solution)
[82]
AgNPs;
preliminary liquid-liquid extraction of the analyte
Raman spectrometer with 514 nm excitation
wavelength
10‒200 mg/kg
– -
Fresh fish meat (solution)
[83]
*
![Fig. 2. The sensing process. Reprinted from [26].](https://thumb-eu.123doks.com/thumbv2/1library_info/3738192.1509142/17.893.123.768.529.811/fig-sensing-process-reprinted.webp)